
Introduction to Epidemiology
and Demography
4
th
Year, Oct, 2015
Dr Faris Al Lami

• Define Epidemiology
• Summarize the epidemiologic approach
• List the uses of Epidemiology
• Modes of expression (N, percentages
and ratios)
Learning Objectives

Epidemiological Principles
• Diseases (or other health events) don’t occur at
random
• Diseases (or other health events) have causal and
preventive factors which can be identified

Epidemiology
•
From the
Greek
words:
EPI (upon) DEMOS (population) LOGOS (study)
• Hippocrates
400 BC Epidemeion (visit)
Endemeion (reside)
• English language
1850s AD Epidemiology
• Arabic language
1950s AD علم الوبائيات

Epidemiology
The study of the
distribution
and
determinants
of health-related states
and events in specified population and
the application of this study to the
control
of health problems.
Last, 2001

Key Words:
Distribution
Time, place, person
Determinants
Cause, risk factors
Population
Public health
Application
Information for action

Uses of Epidemiology
• Determine the magnitude and trends
• Identify the etiology or cause of disease
• Determine the mode of transmission
• Identify risk factors or susceptibility
• Determine the role of the environment
• Evaluate the impact of the control measures

The Five W’s of Journalism / Epidemiology
• What
• Who
• Where
• When
• Why / How
= Diagnosis
(the disease or condition
being investigated)
= Person
(who is getting the disease, who is
at risk)
= Place
(residence, work, school, etc.)
= Time
(date and/or time of onset of
disease, time of exposure)
= Cause, mode of
transmission, risk factors
The Five W’s of Journalism / Epidemiology
• What
• Who
• Where
• When
• Why / How
=
Clinical
=
Person
=
Place
=
Time
=
Cause,
=
mode of
transmission,
risk factors
Descriptive
Epidemiology
(Distribution)
Analytic
Epidemiology
(Determinants)

Basic Epidemiologic Approach
• Observe
• Count cases (events)
• Describe
– Time, place, person
– Calculate rates,
• Compare rates
• Develop hypothesis
• Test hypothesis
• Implement actions (control, prevention)
Descriptive
Epidemiology
Analytical
Epidemiology

Epidemiologist Core Functions
• Public health surveillance
• Investigation
• Data analysis
• Evaluation
• Communication
• Management and teamwork

Clinical
Medicine
Epidemiology
Focus
Individuals
Populations
Main Goal
Diagnosis and
Treatment
Prevention and
Control
Questions
What is wrong with
this patient?
What treatment is
appropriate?
What are the leading
causes of death or
disability in this
population?
What can be done to
reduce/prevent
them?
Medicine Versus Epidemiology

Clinical Medicine
Epidemiology
Surveillance
Questions
-Medical history,
physical examination
Differential diagnosis
Diagnostic test
Treatment
descriptive
epidemiology
Comparison
Analytical
epidemiology
Intervention
(prevention/control)
Medicine Versus Epidemiology
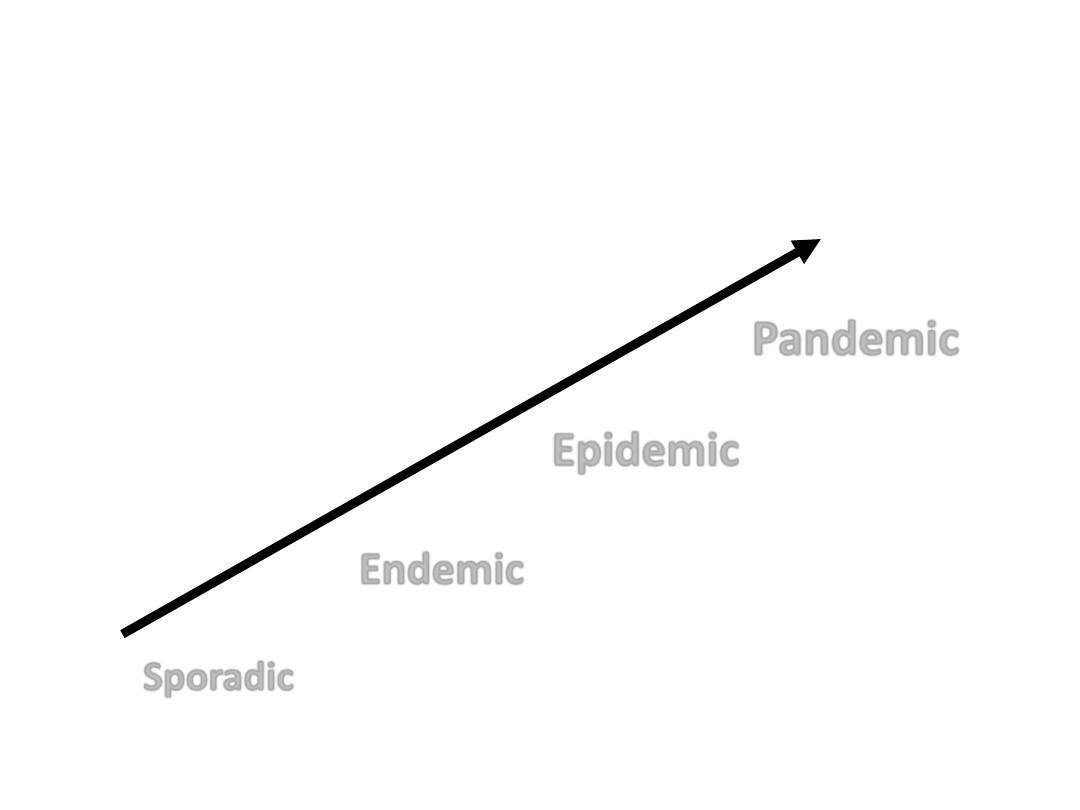
Levels of Disease
Sporadic
Endemic
Epidemic
Pandemic
Increasing amount of disease

Phases in the use of Epidemiology
• Descriptive Epidemiology (What is the problem?
Its frequency? Who is involved? Where? And
When? Frequency and distribution
• Analytical Epidemiology (How is the disease
caused?)Determinants
• Interventional or experimental epidemiology
Effectiveness of new methods for controlling
disease
• Evaluative Epidemiology (Effectiveness of
different health services and programs)

Health Related States
• Infectious diseases
• Chronic disease,
• Environmental problems,
• Behavioral problems,
• Injuries

Modes of expression of data
Absolute numbers, percentages
and ratios

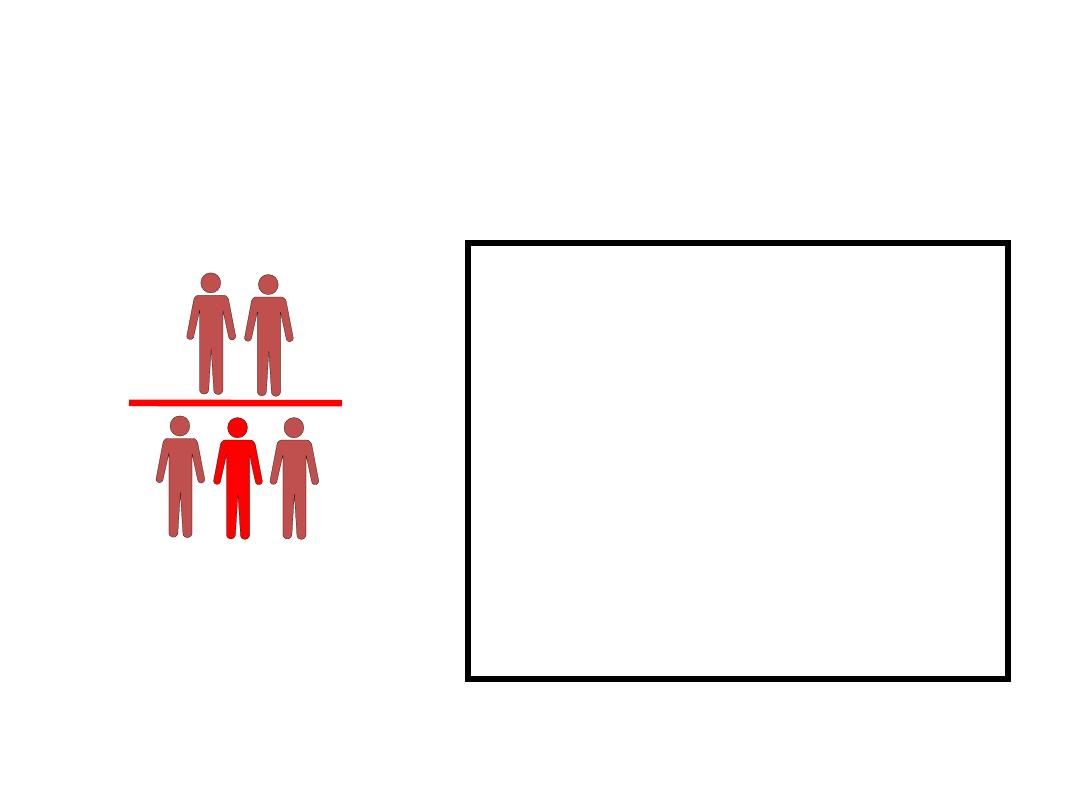
Diseased
Not
Diseased
We often want to know:
1) How many people have a
disease?
2) What proportion of the
population has disease?
3) What proportion of the
population could still get the
disease?
Measures of Frequency
•
Counts
•
Ratio
•
Proportion
•
Percentages
•
Rate
Counts
X 100
What, who is in the denominator ?
What, who is in the numerator?
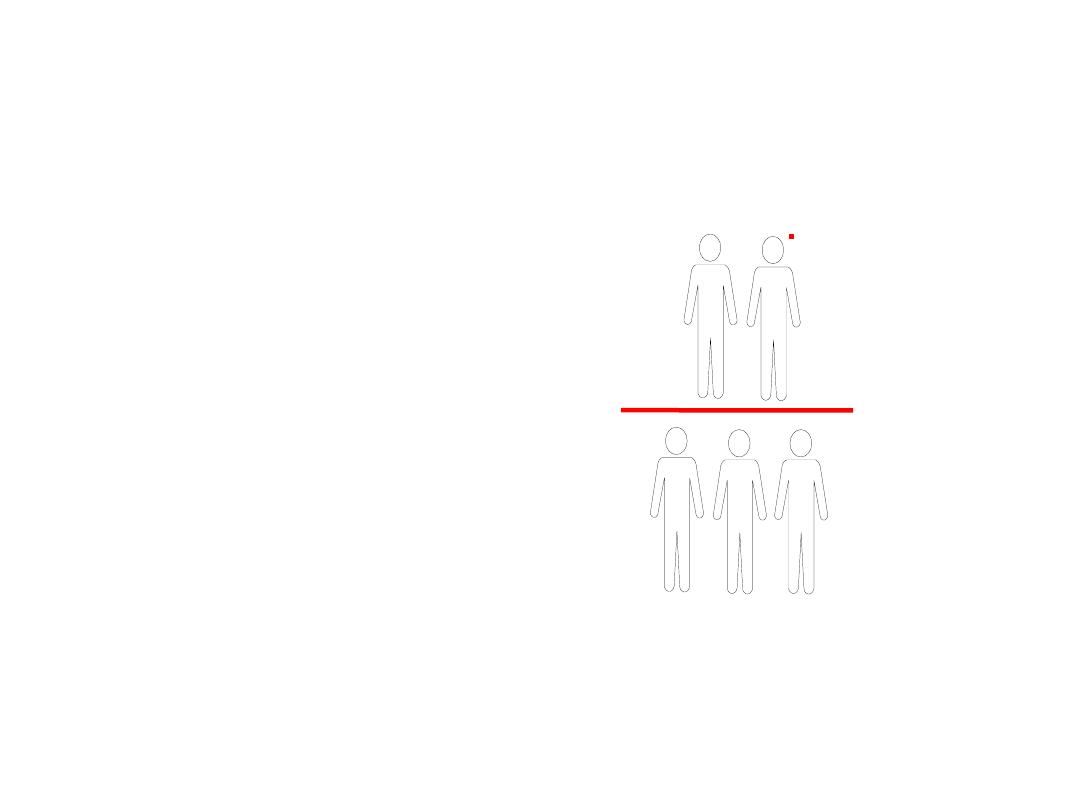
Ratio
The quotient of two numbers
Numerator NOT necessarily
INCLUDED included in the
denominator
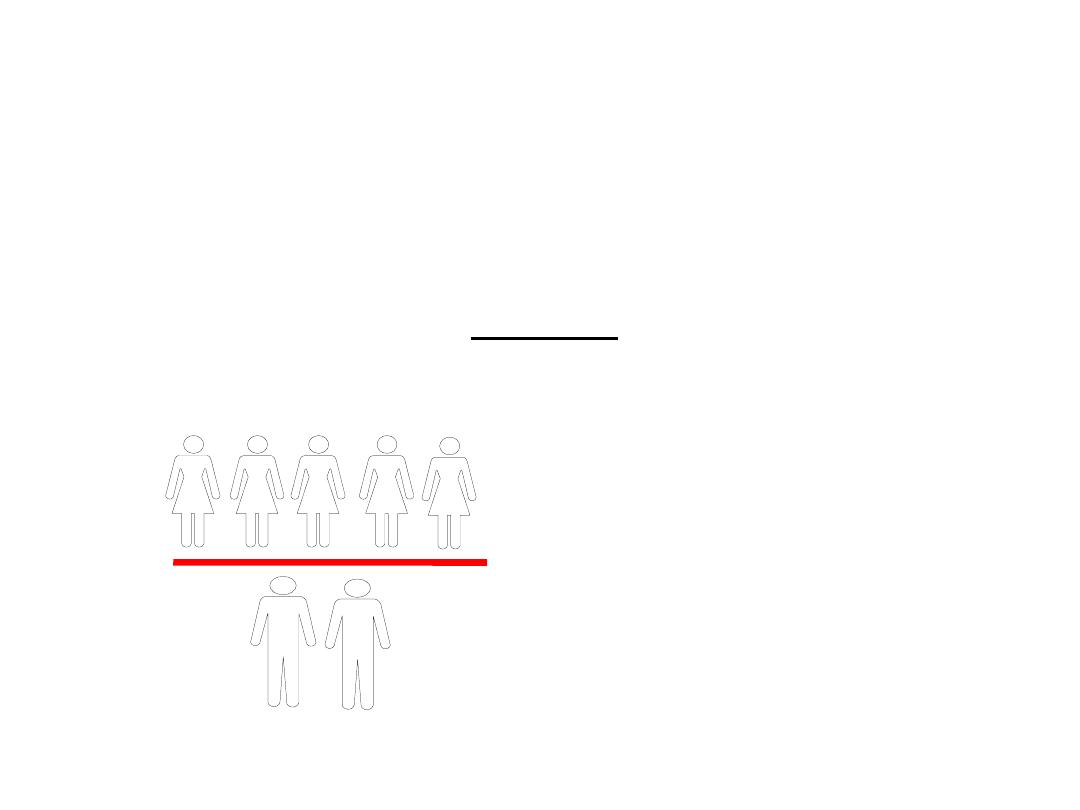
Ratio Example
= 5 / 2 = 2.5 / 1
What is the number of females per one male?
# Females
# Males
* 100
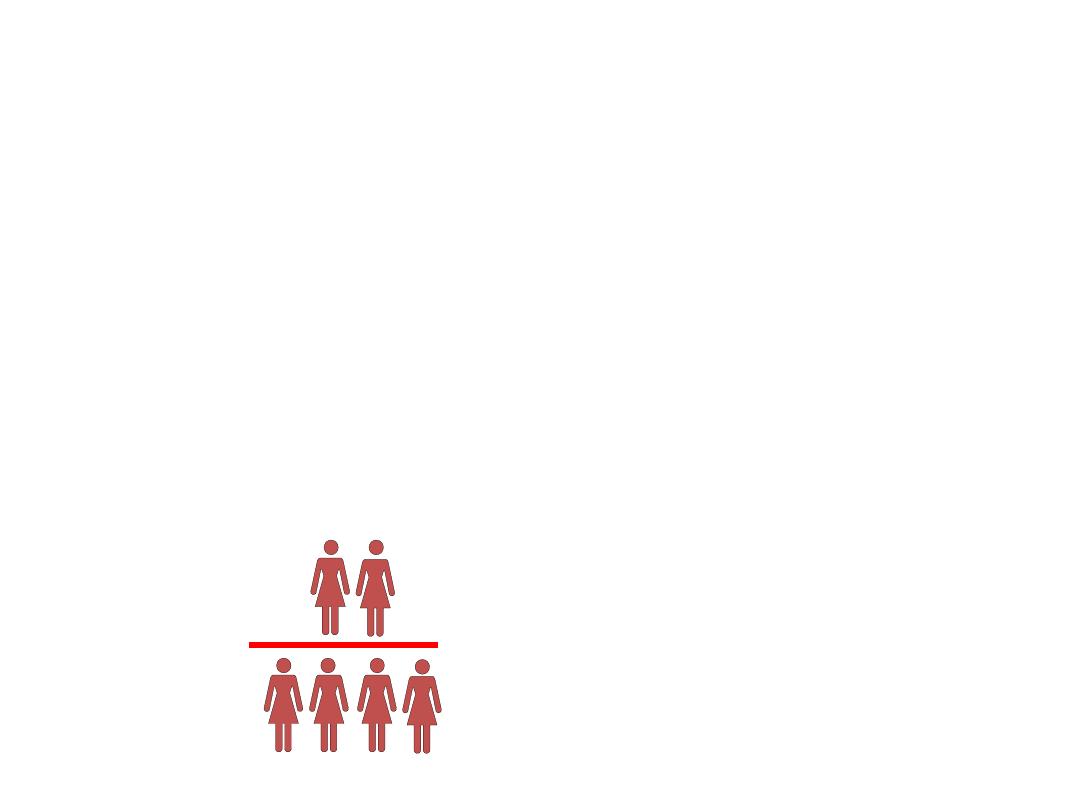
2
--- = 0.5 = 50%
4
Proportion
The quotient of 2 numbers
Numerator IS INCLUDED In the denominator
Quantities have to be of the same nature
Proportion always ranges between 0 and 1
Percentage = proportion x 100

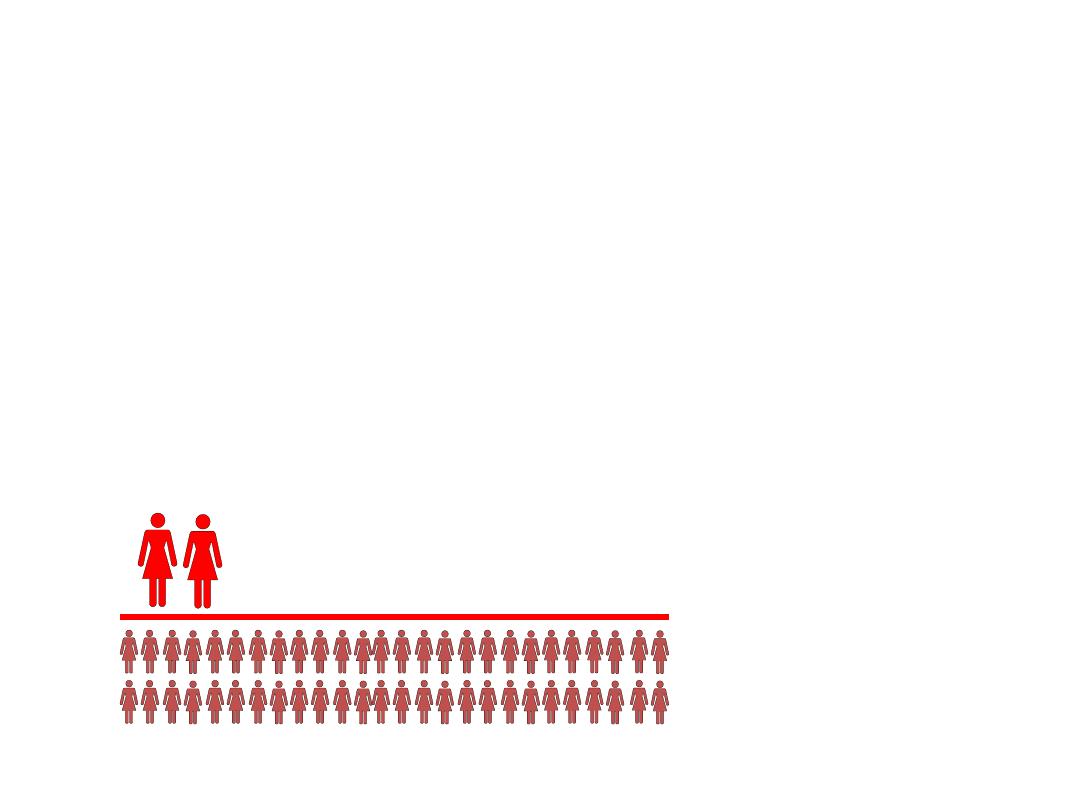
Prevalence
Number of cases of disease at a specific time
Population at risk at that time
Proportion of a population
affected by a disease at a given time.
Prevalence will always fall between 0 and 1
Example:
Prevalence = 100 people = .1
1000 people

Effect of prevalence on two populations
January 1
st
, 2001
Population 1
Population 2
Diabetes
1-1-2001
1-1-2001
Yes
250
250
No
750
750
Total
1 000
1 000
Prevalence
25%
25%

Population 1
Population 2
Diabetes
1-1-1999 1-1-2001 1-1-1999 1-1-2001
Yes
50
250
150
250
No
950
750
850
750
Total
1000
1 000
1000
1 000
Prevalence
5%
25%
15%
25%
Effect of prevalence on two populations
January 1
st
, 1999 and 2001

Case-fatality
Number of deaths due to disease X
Number of diagnosed cases of disease X
This is a measure of the propensity of a disease to casue
death of the affected individual.

In a Central Asian country with a population of six million
people, there were 60,000 deaths during the year ending
December 31, 1997. These included 30,000 deaths occurring in
100,000 people who were sick with cholera.
Case fatality rate from cholera in 1997 ?
Cause specific mortality rate from cholera in
1997 ?
Practice

Rate
• The quotient of 2 numbers
An expression of the relative frequency with which an event occurs in a
defined population per unit of time.
It is calulated as the number of new cases or deaths during a specified
period divided by either person-time or the average population
• Time is always included in the denominator
– Something observed during some time
– Measures the speed of occurrence of an event
– Measure the probability to become sick by unit of time
– Measures the risk of disease
Rate Example
2
----- = 0.02 /
year
100
Observed in 1998
Numerator
- number of
NEW
EVENTS
observed for a given time
Denominator
- population in which the events occur
(
population at risk
)
- includes time

Ratio
Division of two unrelated
numbers
Proportion
Division of two related numbers;
numerator is a subset of
denominator
Rate
Division of two related numbers;
numerator is a subset of
denominator; time is always in
denominator
Comparison of Calculations

Demography
• Demographic data and vital statistics are
useful tools in:
– Determining a community’s health status
– Deciding what’s the best way for providing
health services
– Planning a public health program
– Evaluating a program’s effectiveness

Demographic Data
Demographic data include those
variables that describe the
characteristics of a population
(i.e., population size and how it
changes over time)

Demographic Variables
Population composition include:
Age
Sex
Income
Occupation
Health services use
Geographic location
Geographic density

Vital Statistics (Events)
Include:
Births
Deaths
Marriages
Divorces

Sources of Vital Statistics &
Demographic Data
• Census
• Registration of Vital Events
• Morbidity Surveys

Descriptive Variables for the Health of the
Community
Demographic & Social Variables
•
Age and Sex
•
Socioeconomic Status
•
Family structure
•
Racial, ethnic and religious composition
Variables related to community infrastructure
•
Availability of social and health services
•
Quality of housing stock
•
Social stability

Population Dynamics and Epidemiology
•
Three factors affect the size of populations:
Birth
Death
Migration

Q?