Student’s t test
Researcher
Reader
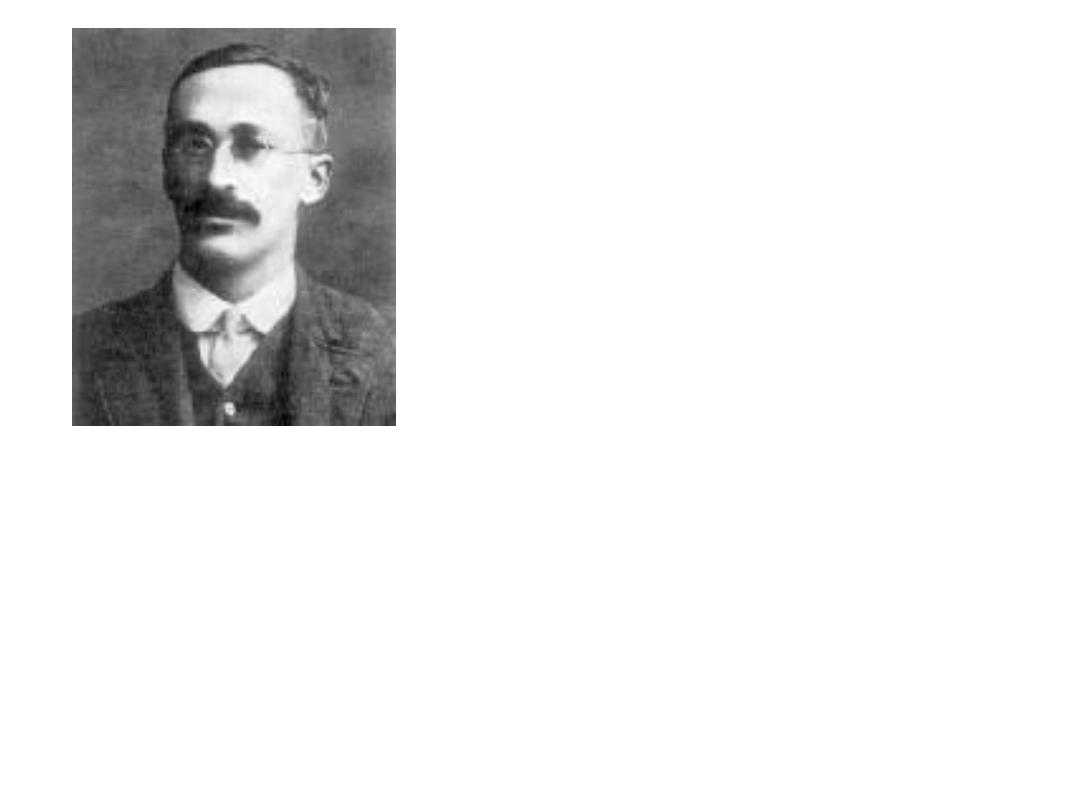
William S. Gosset 1876 - 1937

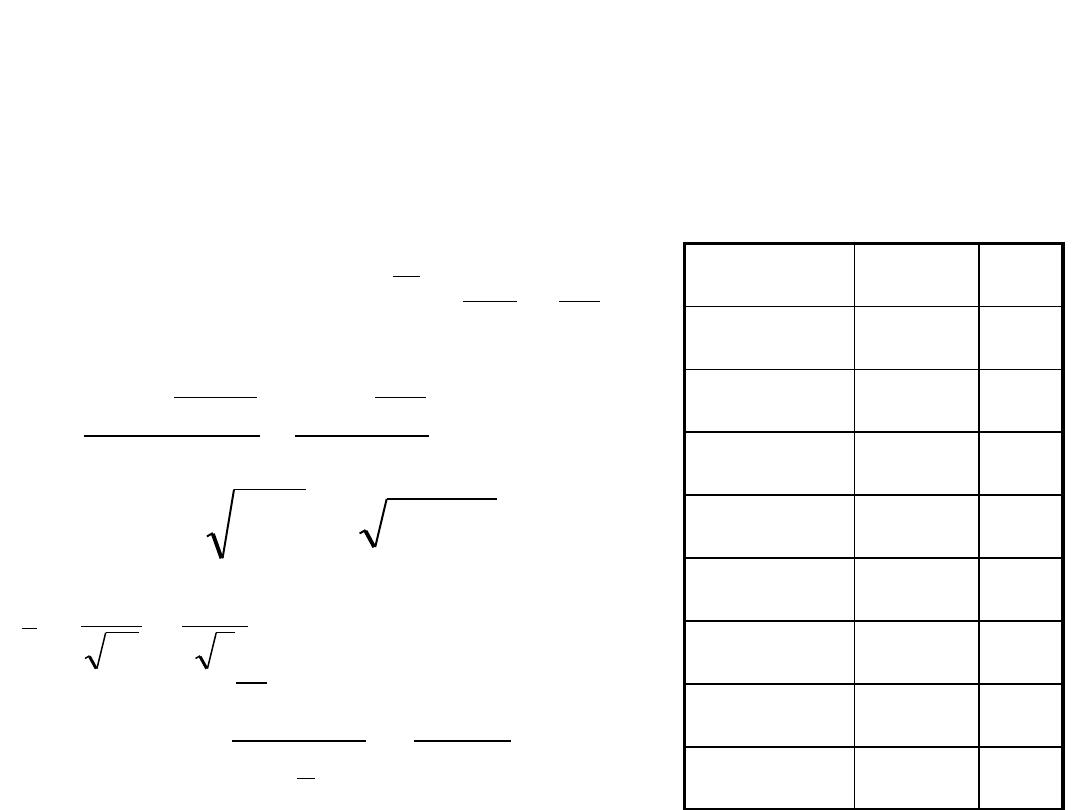
Population 1
µ 1
Population 2
µ 2
Sample 1
Ẋ 1, SD1
Sample 2
Ẋ 2, SD2
Two independent samples t test
Ho:
H1:

Example
• One of the first studies I analyzed was a tumor size study.
Having an accurate measure of tumor size is extremely
important because it allows a physician to accurately
determine if a tumor is growing, shrinking or remaining
constant.
• The problem is that often the measurements of the tumor
size vary from physician to physician.
• In the past, tumor size was measured using the linear distance
across the tumor, but this was found to be very variable
because of the irregular shape of some tumors. A new
method called the RECIST criteria traces the outside of the
tumor. The RECIST method was believed to give more
consistent measures of the volume of the tumor.

Available data
• For a portion of the study, a pair of doctors were
shown the same set of tumor pictures. The volume
of the tumor was measured by two separate
physicians under similar conditions.
• Question of interest: Did the measurements from the
two physicians significantly differ?
• If not, then there would be no evidence that the
volume measurements change based on physician.
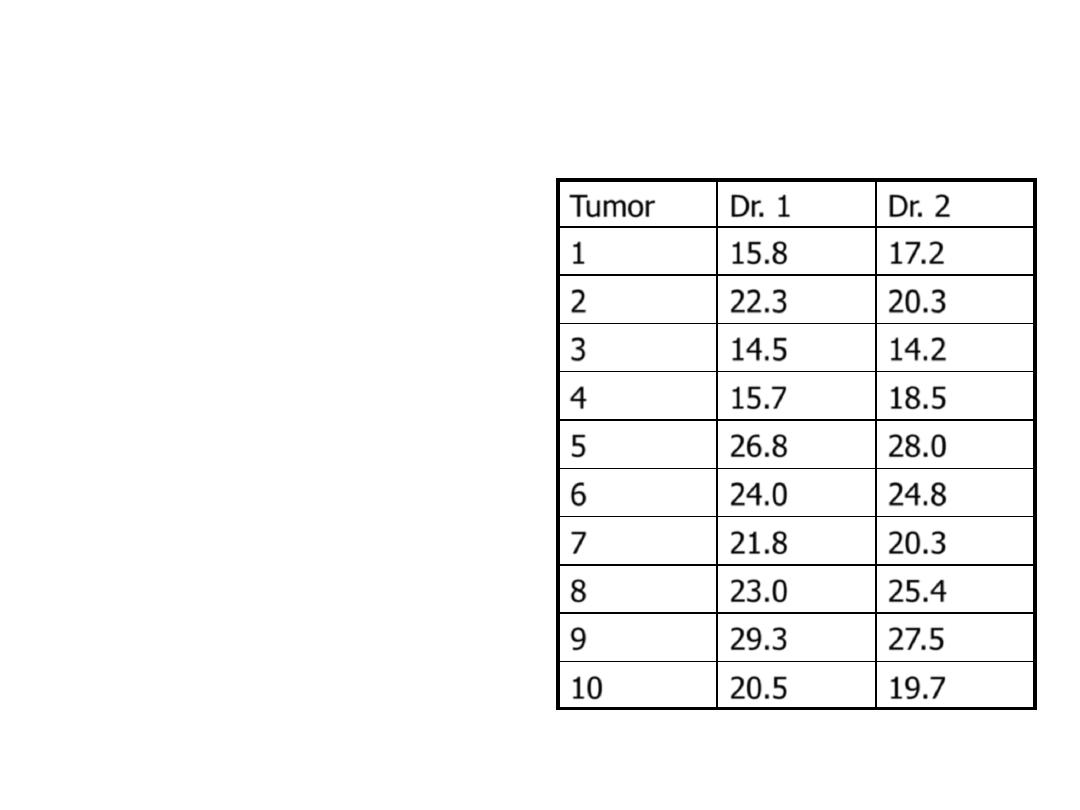
• 20 scans were measured
by each physician (10 are
shown here)
• Measurements in cm
3
• What can you say about
these samples?
– Two measurement on the
same person
– They are related so we
must account for this
– Much research in statistics
deals with how to handle
correlated data, but in this
case it is pretty easy
Tumor
Dr. 1
Dr. 2
1
15.8
17.2
2
22.3
20.3
3
14.5
14.2
4
15.7
18.5
5
26.8
28.0
6
24.0
24.8
7
21.8
20.3
8
23.0
25.4
9
29.3
27.5
10
20.5
19.7
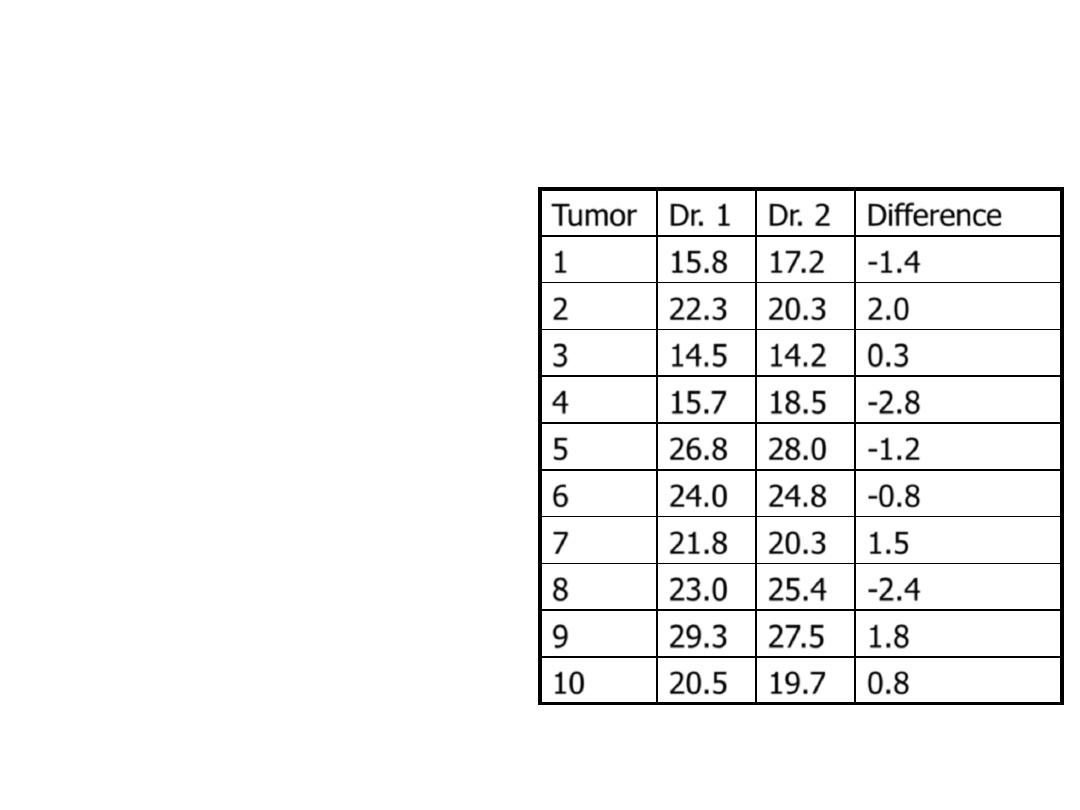
Dependent sample
• We can measure the effect
of the treatment in each
person by taking the
difference
• Instead of having two
samples, we can consider
our dataset to be one
sample of differences
– Just like the one sample
problem
Tumor Dr. 1 Dr. 2 Difference
1
15.8 17.2 -1.4
2
22.3 20.3 2.0
3
14.5 14.2 0.3
4
15.7 18.5 -2.8
5
26.8 28.0 -1.2
6
24.0 24.8 -0.8
7
21.8 20.3 1.5
8
23.0 25.4 -2.4
9
29.3 27.5 1.8
10
20.5 19.7 0.8
i
i
i
x
x
d
2
1

Differences
• Volume from Dr. 1
– Population mean:
– Sample mean:
• Volume from Dr. 2
– Population mean:
– Sample mean:
• Difference
– Population mean:
– Sample mean:
1
x
2
x
n
d
d
n
i
i
1
2
1
2
1
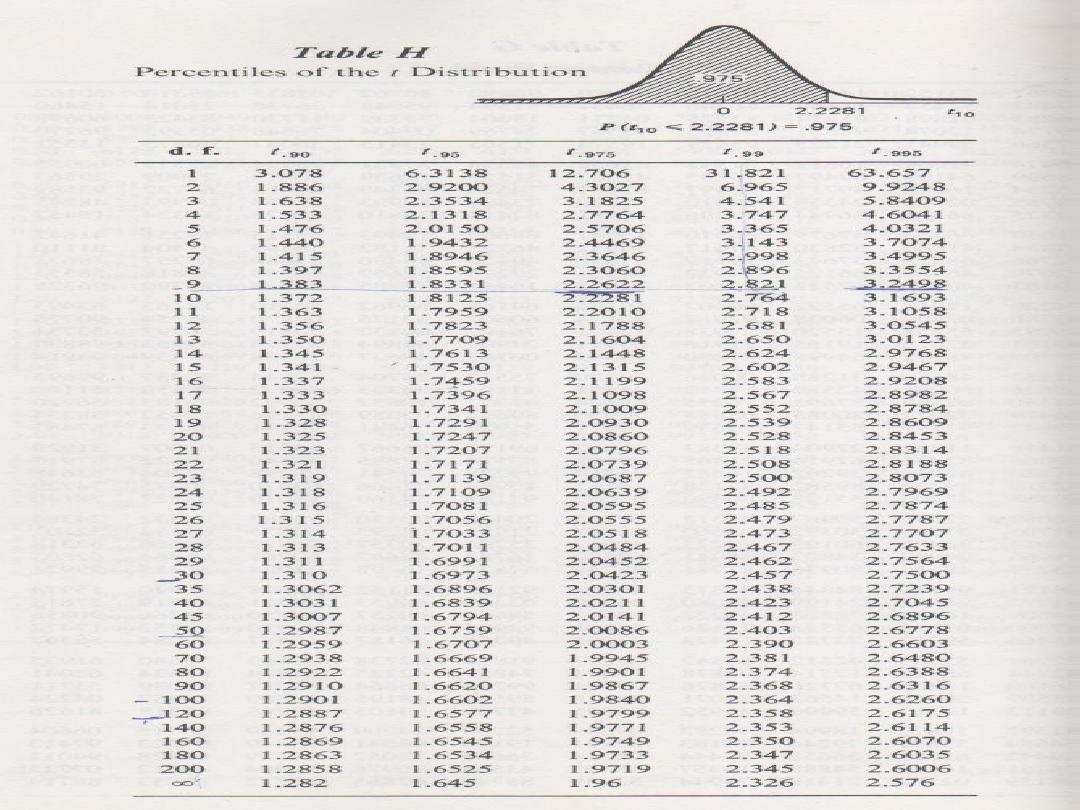
Distribution of differences
• Assuming d
i
’s are normally distributed, can use t-
distribution with n-1 dof where n is the number of
differences
• Standard deviation of differences
• Test statistic acts just like one sample
n
s
d
t
d
1
1
2
n
d
d
s
n
i
i
d
Paired t-test
1) Null hypothesis: No difference between physicians effect
2) Two dependent samples; alpha=0.05
3) Test statistic: t-statistic with dof
4) p-value=0.53
5) Fail to reject null hypothesis
6) Conclusion: there is no evidence of a difference in tumor
volume measurement based on physician
0
:
2
1
2
1
0
dr
dr
dr
dr
H
646
.
0
20
66
.
1
24
.
0
n
s
d
t
d
A researcher investigate whether children exhibit
a higher number of aggressive acts after watching
a violent television show. The number of
aggressive acts for the same 10 participants
before and after watching the show are as
follows:
(a) Subtracting before-scores from after-scores,
what are H
0
and H
a
? (b) Compute t
obt
. (c) With
a
=
.05, what is t
crit
? (d) What should the researcher
conclude about this relationship? (e) Compute
the appropriate confidence interval. (f) If you
want to understand children’s aggression, how
important is it to consider whether they watch
violent television shows?
After Before
5
4
6
6
4
3
4
2
7
4
3
1
2
0
1
0
4
5
3
2
Difference Scores
After Before D
5
4
5-4=+1
6
6
6-6=0
4
3
4-3=+1
4
2
4-2=+2
7
4
7-4=+3
3
1
3-1=+2
2
0
2-0=+2
1
0
1-0=+1
4
5
4-5=-1
3
2
3-2=+1
Difference scores can be
calculated by subtracting before-
after or after-before. The same
answer will be obtained (opposite
sign though). I personally choose
the order which creates the
fewest negative numbers. When
we interpret the results we need
to be careful to remember the
order we used.
(a) Subtracting before-
scores from after-scores,
what are H
0
and H
a
?
H
0
:
H
a
:
9-4a
After Before D
5
4
5-4=+1
6
6
6-6=0
4
3
4-3=+1
4
2
4-2=+2
7
4
7-4=+3
3
1
3-1=+2
2
0
2-0=+2
1
0
1-0=+1
4
5
4-5=-1
3
2
3-2=+1
0
D
0
D
(b) Compute t
obt
.
S
D = 1+0+1+2+3+2+2+1+-1+1=12
S
D
2
= 1
2
+ 0
2
+ 1
2
+ 2
2
+ 3
2
+ 2
2
+ 2
2
+
1
2
+ -1
2
+ 1
2
= 26
N = 10
After Before D
5
4
5-4=+1
6
6
6-6=0
4
3
4-3=+1
4
2
4-2=+2
7
4
7-4=+3
3
1
3-1=+2
2
0
2-0=+2
1
0
1-0=+1
4
5
4-5=-1
3
2
3-2=+1
2
.
1
10
12
S
N
D
D
(b) Compute t
obt
.
After Before D
5
4
5-4=+1
6
6
6-6=0
4
3
4-3=+1
4
2
4-2=+2
7
4
7-4=+3
3
1
3-1=+2
2
0
2-0=+2
1
0
1-0=+1
4
5
4-5=-1
3
2
3-2=+1
29
.
1
1
10
10
12
26
1
)
(
2
2
2
2
S
S
N
N
D
D
s
D
135
.
1
29
.
1
2
D
D
s
s
359
.
10
135
.
1
N
s
s
D
D
34
.
3
359
.
0
2
.
1
D
D
obt
s
D
t
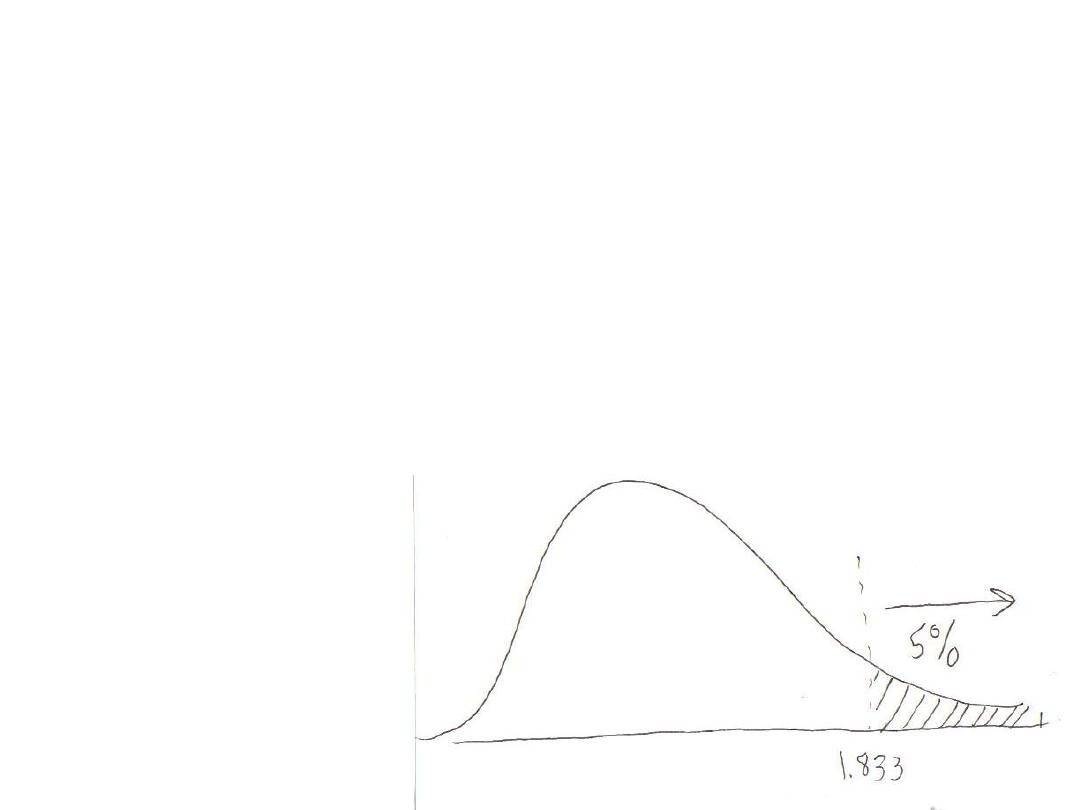
(c) With
a
= .05, what is t
crit
?
n
D
= 10
df = n – 1 = 9
Researcher predicts higher aggressive acts after
watching violence, therefore, this is a one-tailed
test.
t
crit
(9)
a
=.05
= +1.833
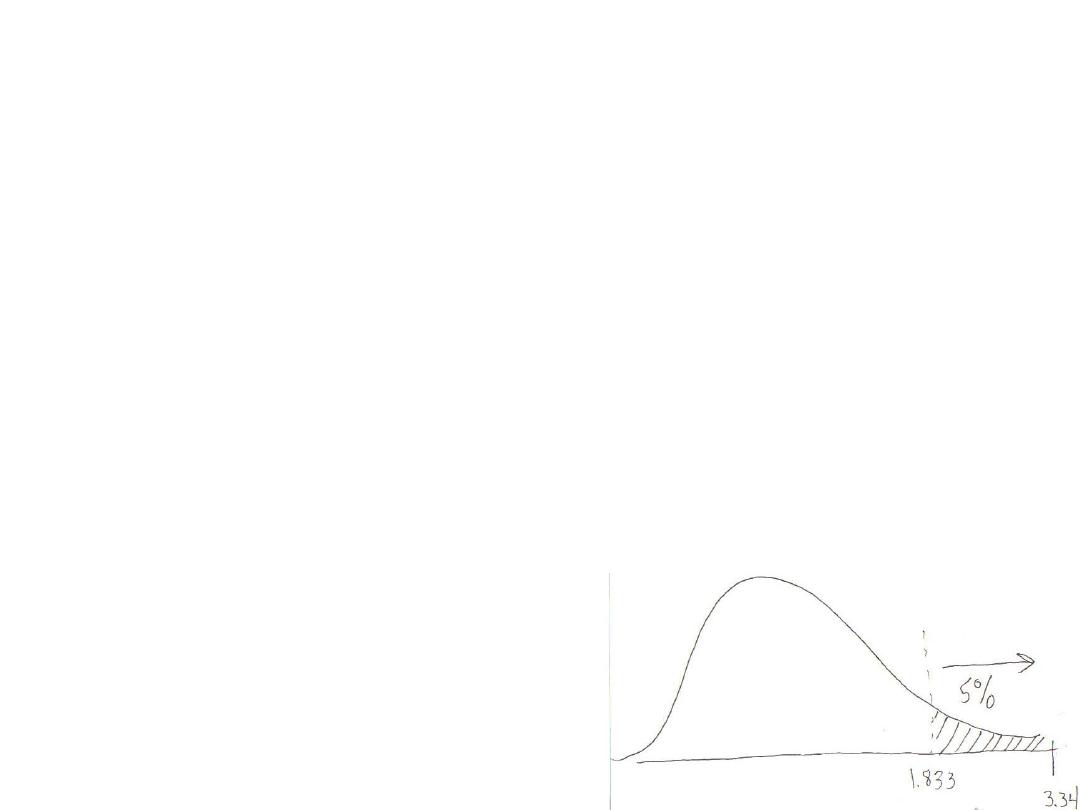
(d) What should the researcher conclude about this
relationship?
Since the t
obt
is in the tail created by t
crit
, we reject H
0
and
conclude the results are significant. In the population,
children exhibit more aggressive acts after watching the show
(with
about 3.9) than they do before the show (with
about 2.7).
You investigate whether the older or
younger male in pairs of brothers tend to
be more extroverted. You obtain the
following extroversion scores:
(a) What are H
0
and H
a
? (b) Compute t
obt
.
(c) With
a
= .05, what is t
crit
? (d) What
should you conclude about this
relationship? (e) Is this a scientifically
informative relationship?
Younger Older
10
18
11
17
18
19
12
16
15
15
13
19
19
13
15
20
(a) What are H
0
and H
a
?
H
0
:
H
a
:
Younger Older
10
18
11
17
18
19
12
16
15
15
13
19
19
13
15
20
0
D
0
D
(b) Compute t
obt
.
S
D = 8 + 6 + 1 + 4 + 0 + 6 + (-6) + 5 = 24
S
D
2
= 8
2
+ 6
2
+ 1
2
+ 4
2
+ 0
2
+ 6
2
+ (-6)
2
+ 5
2
= 214
N = 8
Younger Older D
10
18
8
11
17
6
18
19
1
12
16
4
15
15
0
13
19
6
19
13
-6
15
20
5
3
8
24
S
N
D
D
29
.
20
1
8
8
24
214
1
)
(
2
2
2
2
S
S
N
N
D
D
s
D
50
.
4
29
.
20
2
D
D
s
s
592
.
1
8
50
.
4
N
s
s
D
D
88
.
1
592
.
1
0
3
D
D
obt
s
D
t
(c) With
a
= .05, what is t
crit
?
n
D
= 8
df = n – 1 = 7
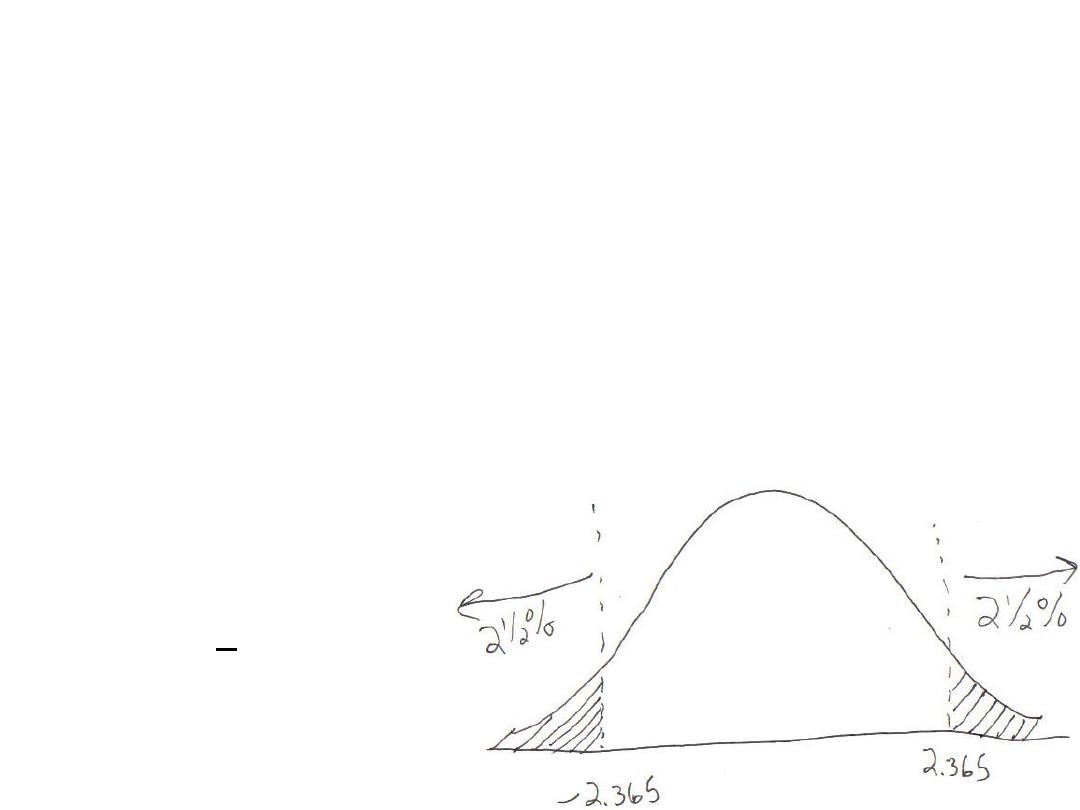
The researcher did not predict whether older or younger
siblings would be more extraverted, therefore, this is a two-
tailed test.
t
crit
(7)
a
=.05
= +2.365
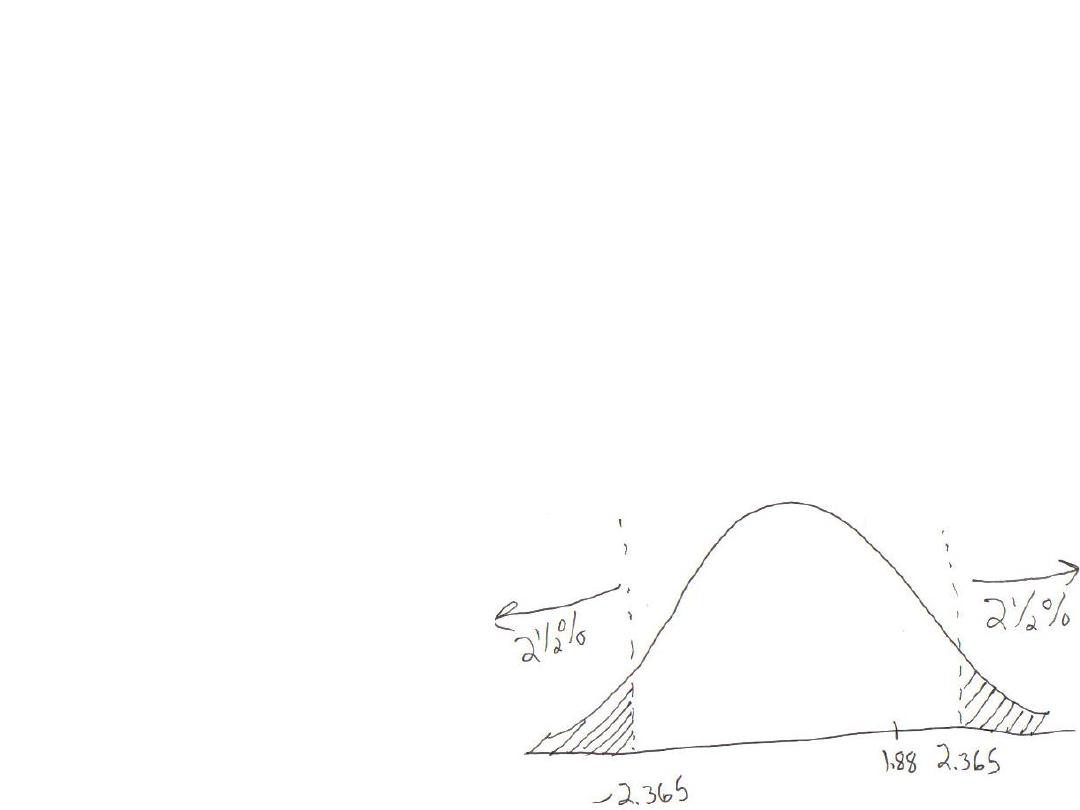
(d) What should you conclude about this relationship?
Since the t
obt
does not fall in the regions of rejection created
by t
crit
, we conclude the results are not significant, we have
no evidence of a relationship. In the population, neither
older nor younger brothers are significantly more
extraverted than the other.

(e) Is this a scientifically informative relationship?
We cannot determine effect size with a nonsignificant result
because we do not know if a relationship exists or not.