SAMPLING DISTRIBUTION
SAMPLING DISTRIBUTION
It is the distribution of all possible values
which can be assumed by some statistic,
computed from samples of the same size
randomly drawn from the same population
1
2
3
4
5
1 2 3 4 5
10 Samples
STEPS IN CONSTRUCTING SAMPLING
DISTRIBUTION
• From a population of size (N), we
randomly draw all possible samples
of size (n)
• From each sample we compute the
statistic of interest
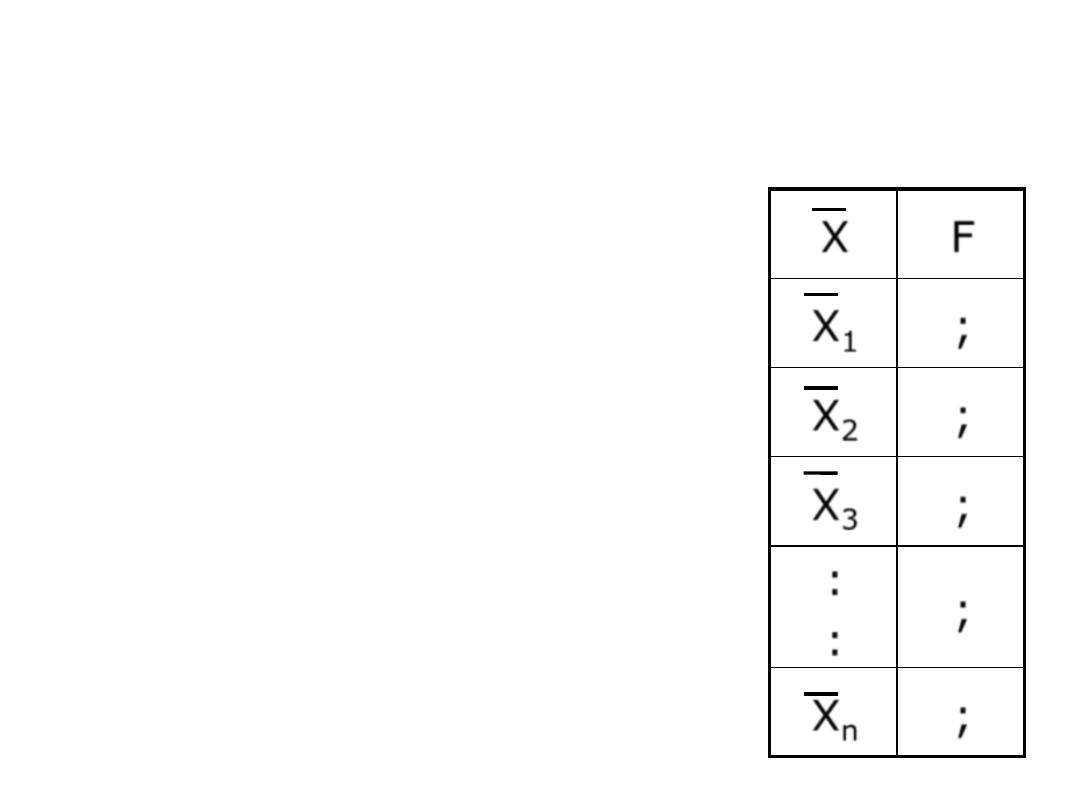
• Make a table of the observed
values of the statistic and its
corresponding frequency
• For any sampling distribution we
are interested in the mean ,
variance, and the shape of the
curve.
F
X
;
X
1
;
X
2
;
X
3
;
:
:
;
X
n

DISTRIBUTION OF THE SAMPLE
MEAN
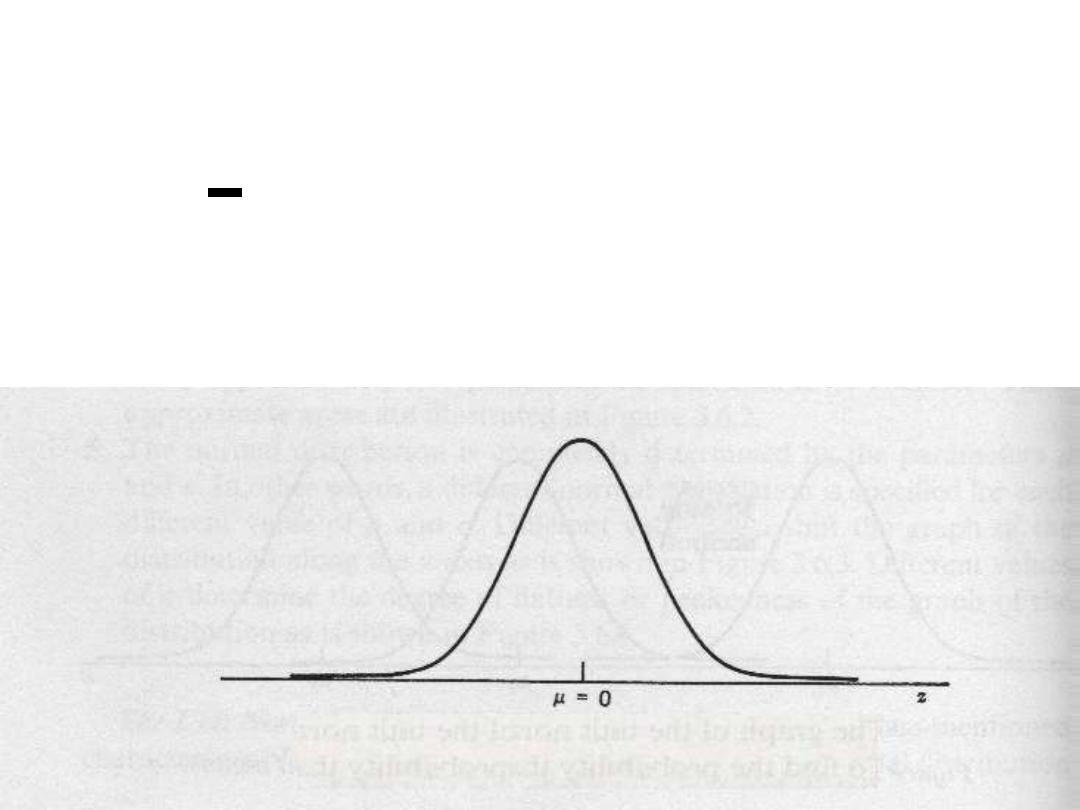
• When sampling is from a normally distributed
population , the distribution of the sampling
mean will posses the following properties:
• The distribution of the means of the
_
samples (X) will be normal

DISTRIBUTION OF THE SAMPLE
MEAN
• The mean of the means of the
_
samples µ
X
will be equal to the mean
of the underlying population from
which these samples were drawn

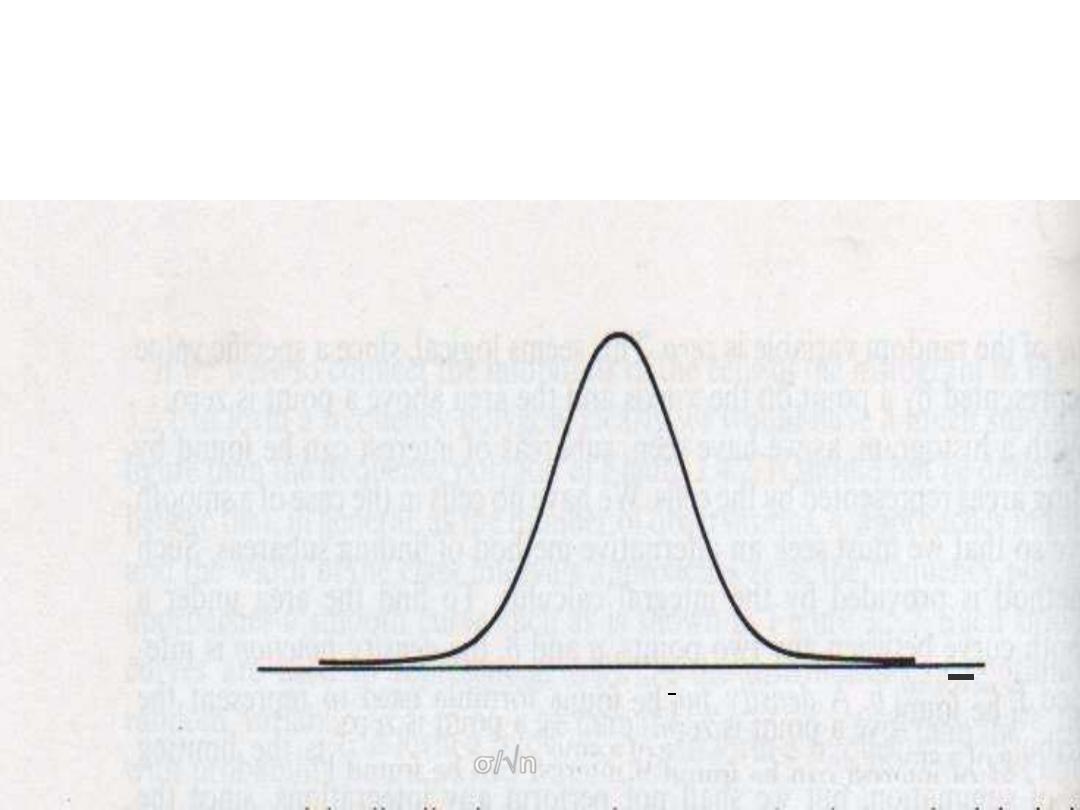
DISTRIBUTION OF THE SAMPLE
MEAN
• The standard deviation of these means will
be
σ/√n
_
X-
µ
Z=---------
σ/√n

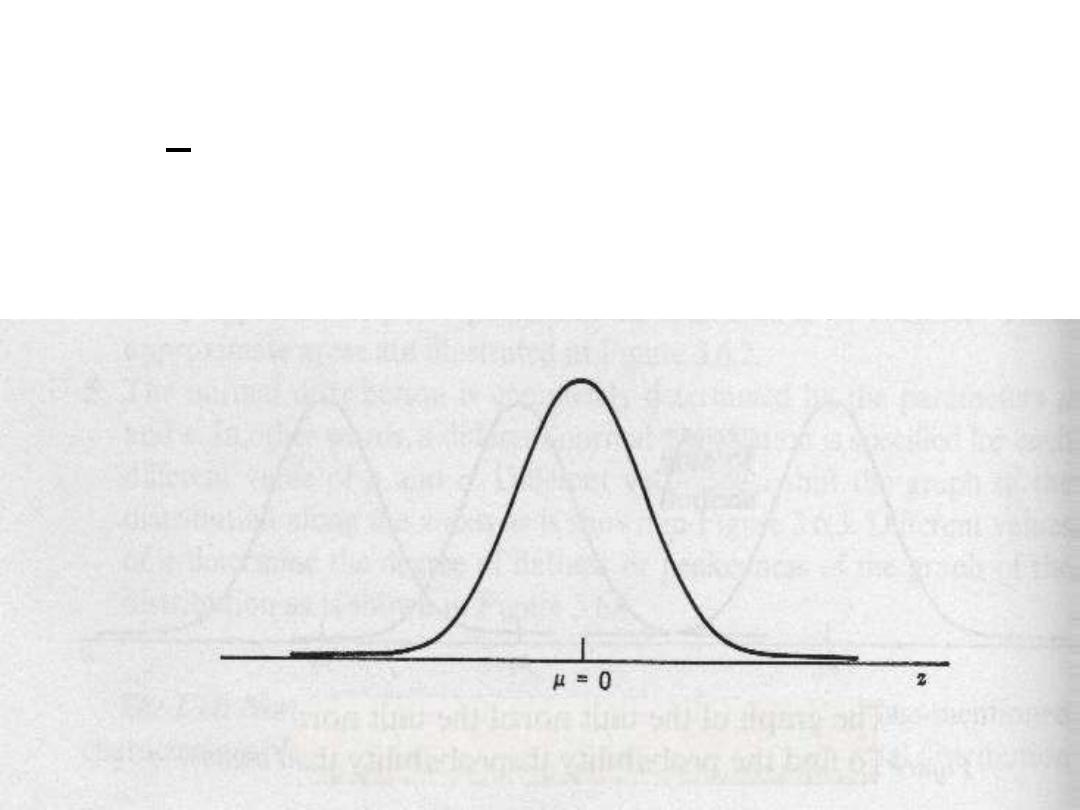
DISTRIBUTION OF THE SAMPLE
MEAN
When sampling is from a normally distributed
population , the distribution of the sampling mean will
posses the following properties:
• The distribution of the mean of the samples (X) will
be normal.
• The mean of the means of the samples µ
X
will be
equal to the mean of the underlying population from
which these samples were drawn.
• The standard deviation of these means will be σ/√n
DISTRIBUTION OF THE SAMPLE
MEAN
X
µ=
µ
X
SE=
σ/√n
DISTRIBUTION OF THE SAMPLE
MEAN
X-
µ
Z=---------
σ/√n

Exercise
If the cranial length of certain large human
population is normally distributed with a
mean =185.6 mm, and standard
deviation=12.7 mm.
What is the probability that a random
sample of size 10 from this population will
have a mean greater than 190 mm?

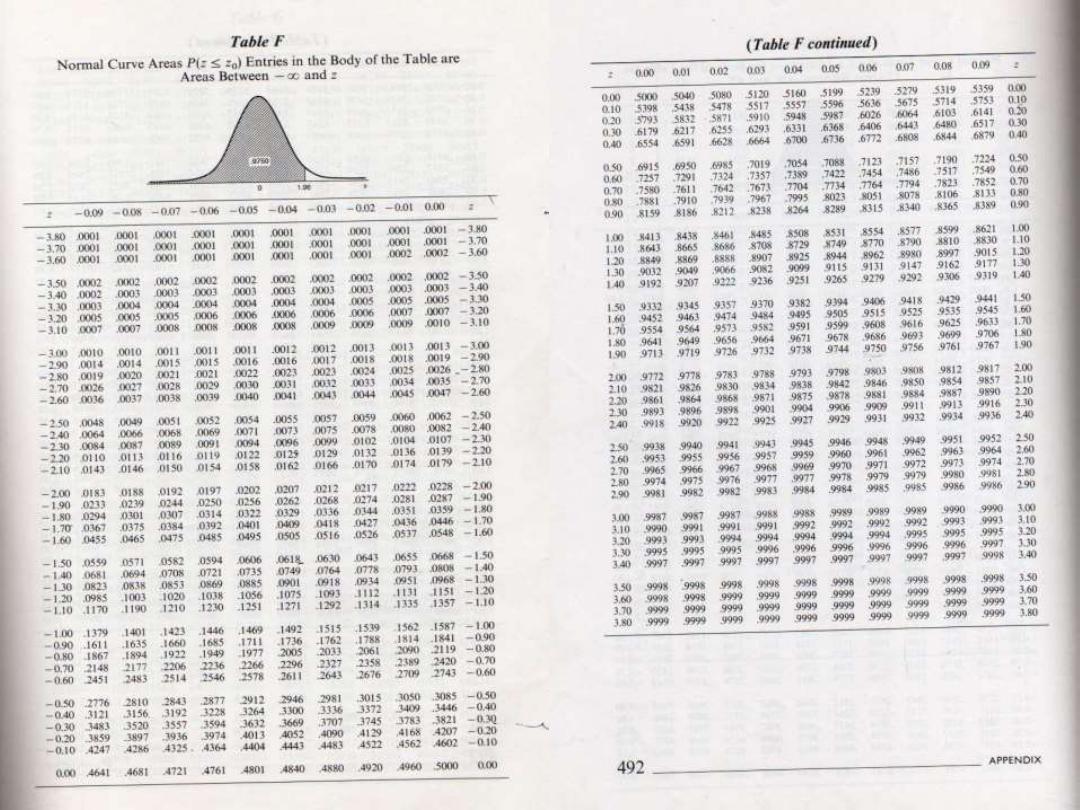
Exercise
X-
µ 190-185.6
Z=--------- =--------------=1.09 P=0.1379
σ/√n 12.7 / √ 10
Z
(1.09)
=0.8621
P
Z(1.09)
=1- 0.8621
= 0.1379

Distribution of the difference of
two sample means
_ _
(x
1
_ x
2
)-(µ
1
-
µ
2
)
Z=----------------------
√
(σ
2
1
/n1
)+ (σ
2
2
/n2)
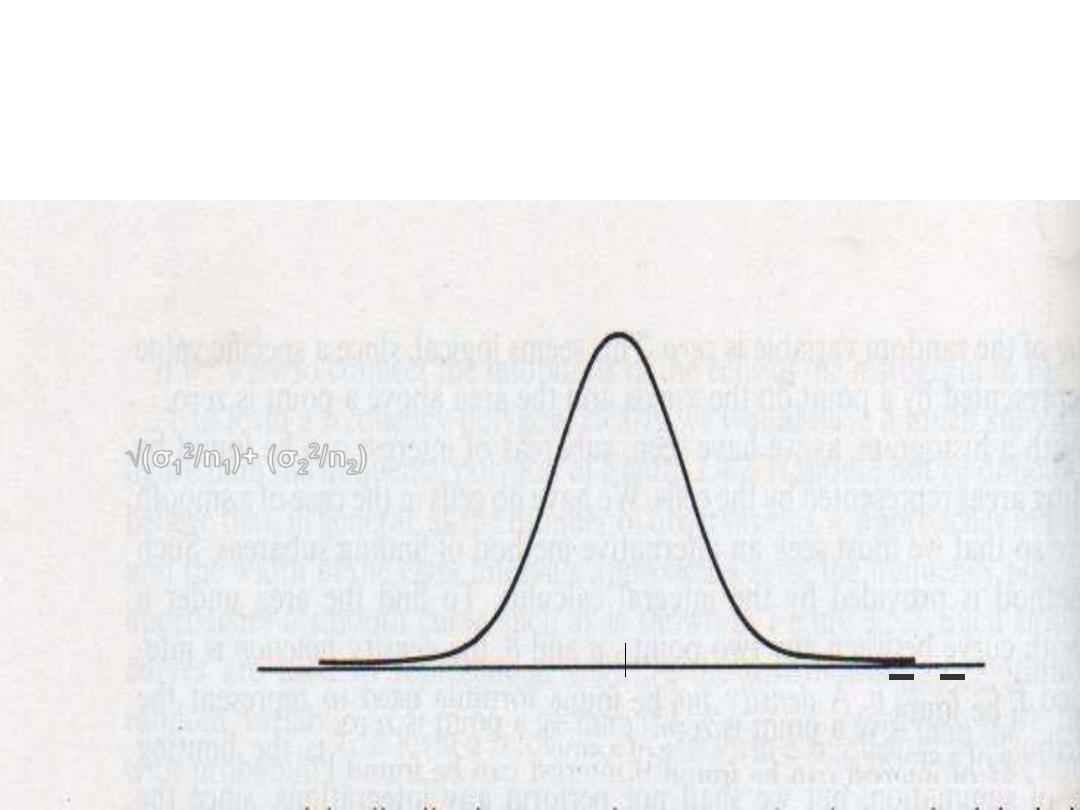
Distribution of the difference of two
sample means
(X
1
-X
2
)
µ= (
µ
1
-µ
2
)
SE=
√(σ
1
2
/n
1
)+ (σ
2
2
/n
2
)

EXERCISE
If the level of vitamin A in the liver of two
human populations is normally distributed,
the variance of population 1 =19600 unit
2
,
and of population 2 =8100 unit
2
.
If there is no difference in population
means , what is the probability of having a
difference in means between two samples
(n
1
=15, n
2
=10) drawn at random is equal
or greater than 50 unit.

_ _
x
1
_ x
2
= 50 , µ
1
-
µ
2
= 0.0
, σ
2
1
=19600
, σ
2
2
=8100, n1= 15, n2= 10
_ _
(x
1
_ x
2
) - (µ
1
-
µ
2
) 50-0.0
Z=------------------------- = -----------------------------
√
(σ
2
1
/n1
)+ (σ
2
2
/n2)
√
(19600/15)+ (8100/10)
50
=------ = 1.09
P(Z
1.09
)=0.8621
46
P=
1-0.8621
=
0.1379

DISTRIBUTION OF SAMPLE
PROPRTION
~
P _ P
Z=-------------
√
p(1-p)/n
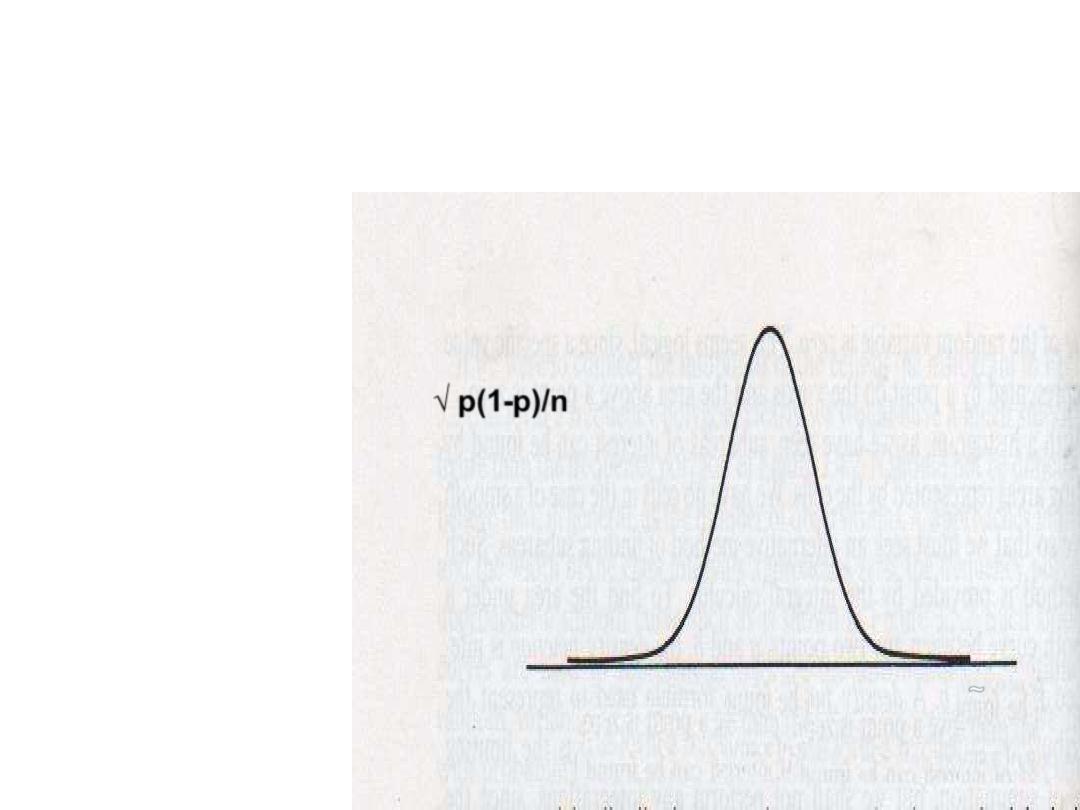
DISTRIBUTION OF SAMPLE
PROPRTION
~
P - P
Z=-------------
√ p(1-p)/n
P
~
P
√ p(1-p)/n

EXERCISE
Suppose in a certain human population ,
the prevalence of color blindness is 8%. If
we randomly select 150 individuals from
this population, what is the probability that
the prevalence in the sample is as great
as 15%

~
P=0.15 , P= 0.08 , n=150
~
P _ P 0.15-0.8
Z=------------- = -------------------------------
√ p(1-p)/n √ 0.08(1-0.08)/ 150
0.07
=------------ =
3.18
P (Z
3.18
)
= 0.9993
0.022
P=
1- 0.9993=
0.0007

DISTRIBUTION OF DIFFERENCE
BETWEEN TWO SAMPLE
PROPRTIONS
~
~
(P
1
_P
2
) _ ( P
1
_P
2
)
Z=----------------------------
√ p
1
(1-p
1
)/n
1 +
p
2
(1-p
2
)/n
2
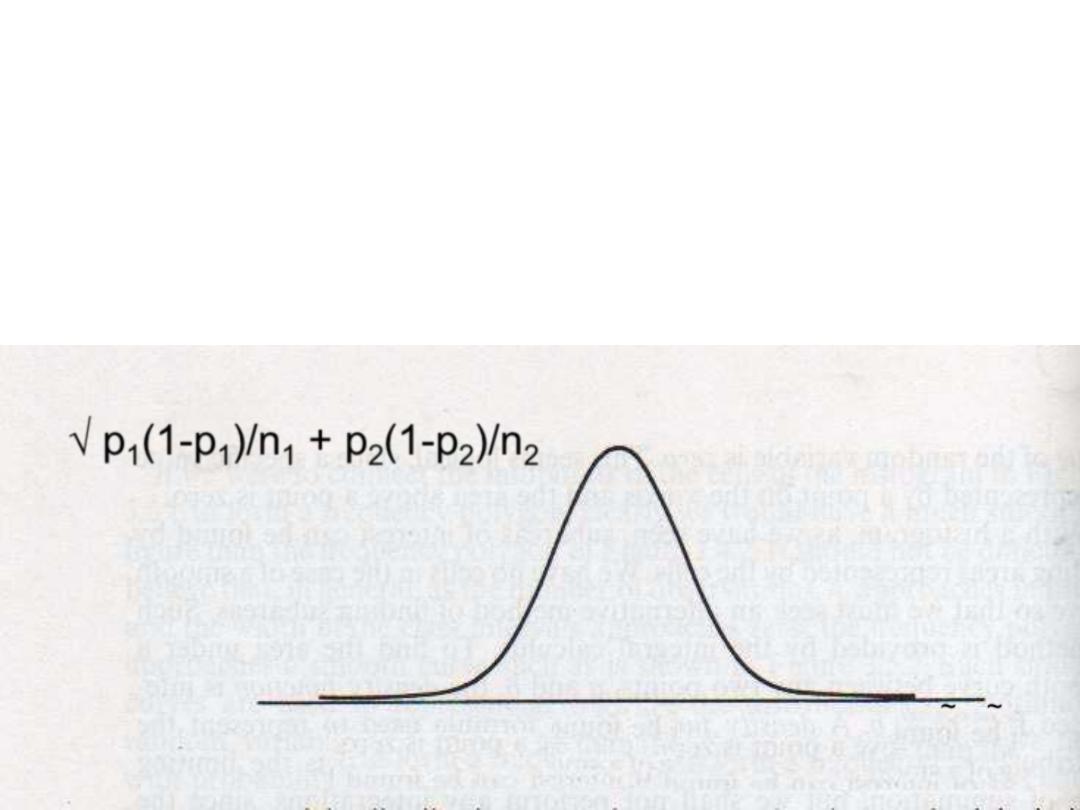
DISTRIBUTION OF DIFFERENCE BETWEEN
TWO SAMPLE PROPRTIONS
~ ~
(P
1
-P
2
) _ ( P
1
-P
2
)
Z=----------------------------
√ p
1
(1-p
1
)/n
1 +
p
2
(1-p
2
)/n
2
√ p
1
(1-p
1
)/n
1
+ p
2
(1-p
2
)/n
2
(P
1
-P
2
)
~ ~
(P
1
-P
2
)

EXERCISE
In a certain population of teenagers, it is
known that 10% of boys are obese. If the
same proportion of girls in the population
are obese, what is the probability that a
random sample of 250 boys and 200 girls
will yield a difference in prevalence of 6%.

~ ~
P
1
= 0.1 , P
2
= 0.1 , P
1
- P
2
= 0.06 , n1= 250 n2= 250
~
~
(P
1
_P
2
) _ ( P
1
_P
2
)
Z=---------------------------------
√
p
1
(1-p
1
)/n
1 +
p
2
(1-p
2
)/n
2

~ ~
(P
1
_ P
2
) _ ( P
1
_ P
2
)
Z=---------------------------------
√ p
1
(1-p
1
)/n
1 +
p
2
(1-p
2
)/n
2
(0.06) _ (0.1-0.1) 0.06-0.0
=-----------------------------------------------------------------
= -----------------------------------------------
√ 0.1(1-0.1)/250
+
0.1(1-0.1)/250
√ (0.1) (0.9) /250
+
(0.1) (0.9) /250
0.06
=--------- = 2.22
P(Z
2.22
)= 0.9864
0.027
P=
1-0.9864=
0.0136