
Mathematical presentation
Measures of Dispersion & Variability
1

By the end of this lecture you will be able to:
1.
Verify the concept of dispersion
2.
List & calculate the measures of dispersion;
range,
variance,
standard
deviation,
standard error & coefficient of variation.
2
Mean
Median
Mode
3

A quintile is a value below which a certain
proportion of observations occurred in the
ordered set of data values.
4

Those values, in a series of observations
arranged in ascending order of magnitude,
which divide the distribution into 100 equal
parts.
10th Percentile
:
it is the value below which
10% of the observations lie.
We also frequently used
3rd, 97th, and the
50th (median) percentile.
5

These are the observations in an array that
divide the distribution into four equal parts.
1st (lower Quartile):
the value below which
25% of observations lie in an ordered array
6

2nd quartile =
Median = 50th percentile
Upper Quartile =
75th percentile
Interquartile Range:
is the middle 50% of all
observations
7

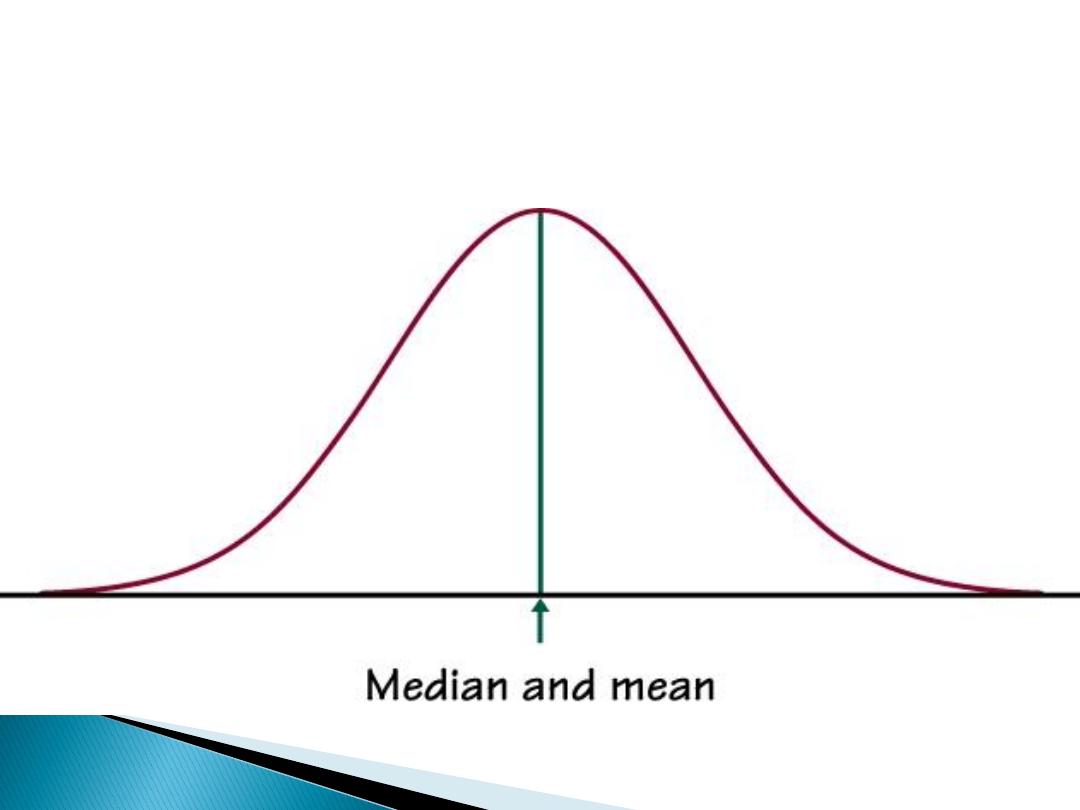
IF THE DISTRIBUTION IS NORMAL
Mean is the best measure of central
tendency
Most scores “bunched up” in middle
Extreme scores less frequent
don’t move mean around.
Central Tendency doesn’t tell us everything
Dispersion/Deviation/Spread tells us a lot
about how a variable is distributed.
We are most interested in Standard
Deviations (σ) and Variance (σ
2
)
Mean describes Central Tendency, what the
average outcome is.
We also want to know something about how
accurate the mean is when making predictions.
The question becomes how good a
representation of the distribution is the mean?
How good is the mean as a description of
central tendency -- or how good is the mean
as a predictor?
Answer -- it depends on the shape of the
distribution. Is the distribution normal or
skewed?
Once you determine that the variable of interest
is normally distributed, ideally by producing a
histogram of the scores,
the next question to be asked about the NDC is
its dispersion: how spread out are the scores
around the mean.
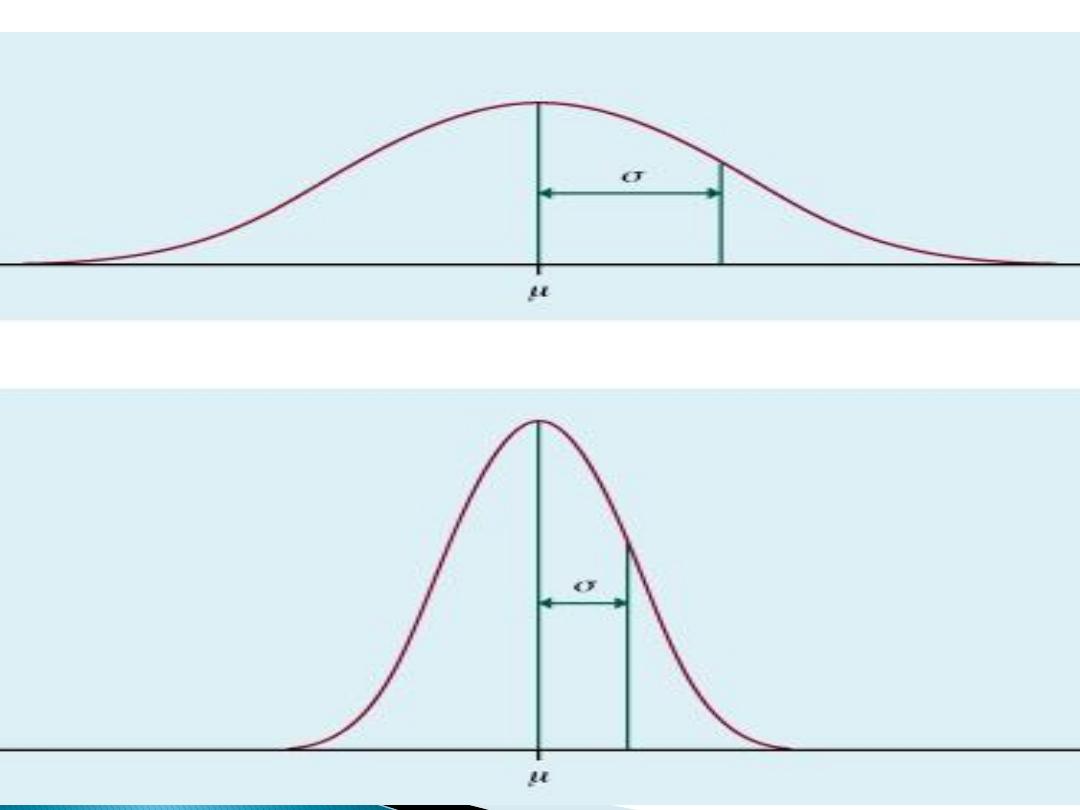
Dispersion is a key concept in statistical
thinking.
The basic question being asked is how much
do the scores deviate around the Mean? The
more “bunched up” around the mean the better
your ability to make accurate predictions.

Consider these means for weekly candy bar
consumption.
X = {7, 8, 6, 7, 7, 6, 8, 7}
X = (7+8+6+7+7+6+8+7)/8
X = 7
X = {12, 2, 0, 14, 10, 9, 5, 4}
X = (12+2+0+14+10+9+5+4)/8
X = 7
What is the difference?

How well does the mean represent the
scores in a distribution?
The logic here is to determine how much
spread is in the scores.
How much do the scores "deviate" from the
mean?
Think of the mean as the true score or as
your best guess.
If every X were very close to the Mean, the
mean would be a very good predictor.
If the distribution is very sharply peaked
then the mean is a good measure of central
tendency and if you were to use the mean to
make predictions you would be right or
close much of the time.

They measure the variability in the values of
observations in the set.
They also called measures of variation,
spread and scatter.
16
If all values are the same the dispersion is
zero.
If the values are homogenous and close to
each other the dispersion is small.
If the value are so different the dispersion is
large.
17
Range: Is the difference between the largest
and smallest value
R=X
L
- X
S
R=Range
X
L
= largest value,
X
S
= smallest value
18

Simple to calculate
Easy to understand
It neglect all values in the center and depend
on the extreme value, extreme value are
dependent on sample size
19
It is not based on all observations
It is not amenable for further mathematic
treatment
should be used in conjunction with other
measures of variability
20

The mean sum of squares of the deviation from the
mean.
e.g. if the data is: 1,2,3,4,5.
The mean for these data=3
the difference of each value in the set from the mean:
1-3= -2
2-3= -1
3-3= 0
4-3= 1
5-3= 2
The summation of the differences =zero
Summation of square of the differences is not zero
21
Population Variance
(sigma squared)
∑(X- μ)
2
α
2
=------------
N
OR
α
2
=[N∑x
2
– (∑ X)
2
] / N.N
α
2
= sigma
squared(pop.var)
X=observation value
μ= population mean
N=population size
∑x
2
=summation of
squared (∑ X)
2
=squared of
summation
22

Sample Variance
_
∑ (X- X )
2
S
2
= -----------
n-1
OR
[ n∑X
2
– (∑X)
2
]
s
2
= ----------------
n(n-1)
S
2
= sample variance
n= sample size
23

Variance can never be a negative value
All observations are considered
The problem with the variance is the squared
unit
24
It is the square root of the variance
SD=√sigma square= ± sigma(α)---- for
population
Sd= √S
2
= ± S----for sample
25

The standard deviation measured the
variability between observations in the
sample or the population from the mean of
that sample or that population.
The unit is not squared
SD is the most widely used measure of
dispersion
26

It measures the variability or dispersion of
the sample mean from population mean
It is used to estimate the population mean,
and to estimate differences between
populations means
SE=SD/√ n
27
It expresses the SD as a percentage of the
mean
CV= S /mean X100
(mean of the sample)
It has no unit
It is used to compare dispersion in two sets
of data especially when the units are
different
28

It measures relative rather than absolute
variation
It takes in consideration all values in the set
29