Electricity Within the Body
Electricity plays an important role in medicine .
There are two aspects of electricity and magnetism in medicine :1.electrical and magnetic effects generated inside the body ,
2.applications of electricity and magnetism to the surface of the body.
The electricity generated inside the body serves for the control and operation of the nerves , muscles ,and organs .
The forces of muscles are caused by the attraction and repulsion of electrical charges.
The action of the brain is basically electrical. All nerve signals to and from the brain involve the flow of electrical currents.
Potential difference between inside and outside the cell
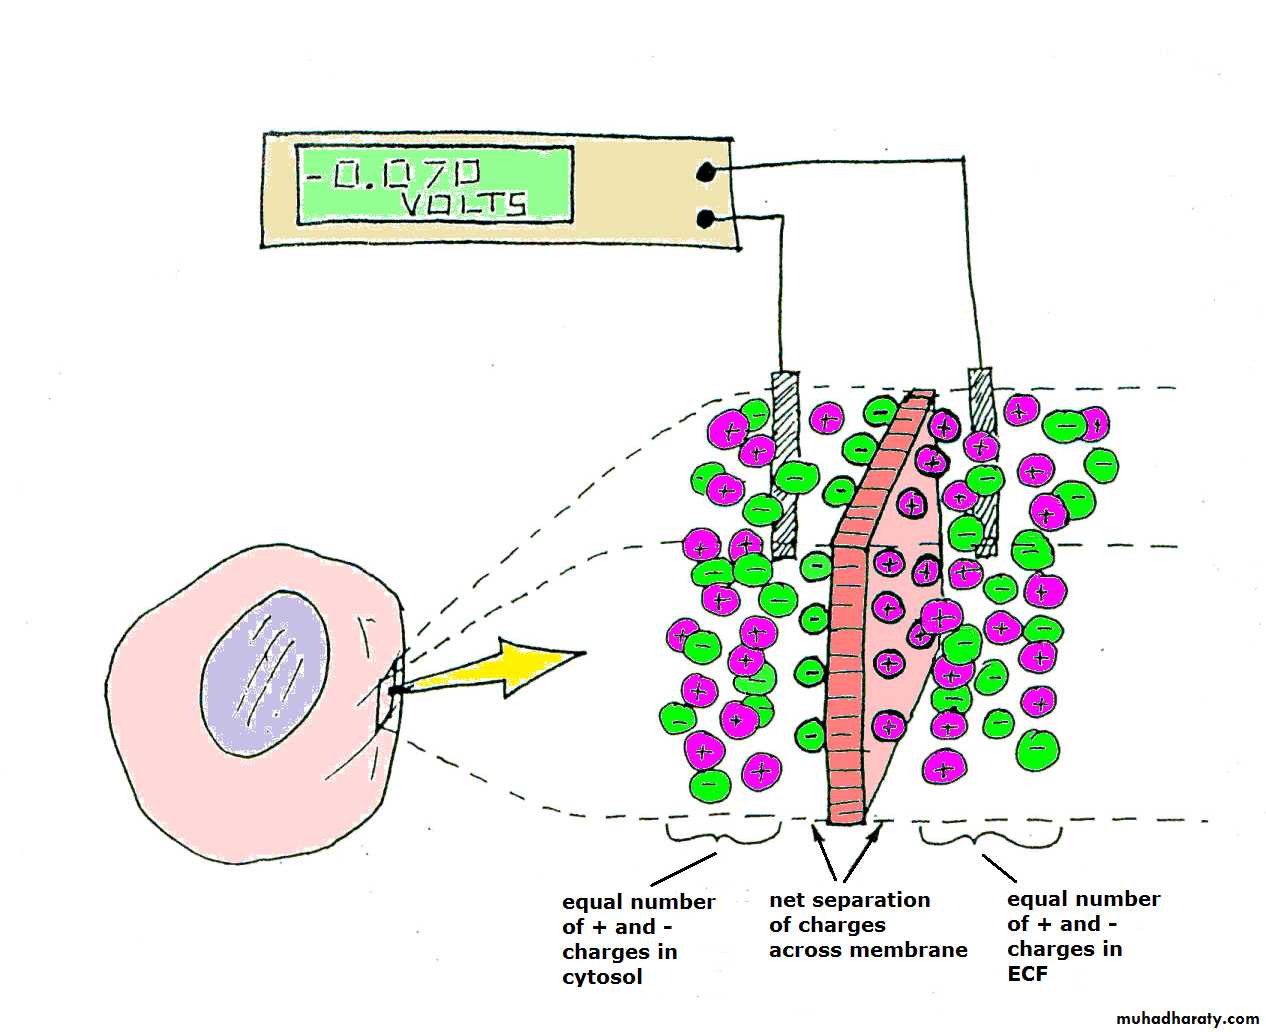
Membrane potential
Membrane potential
Membrane potential
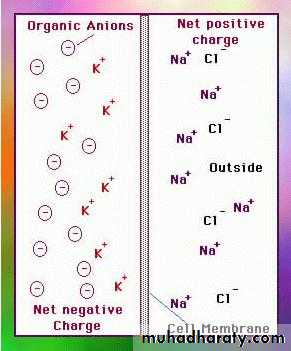
When inside the cell being negative with respect to outside
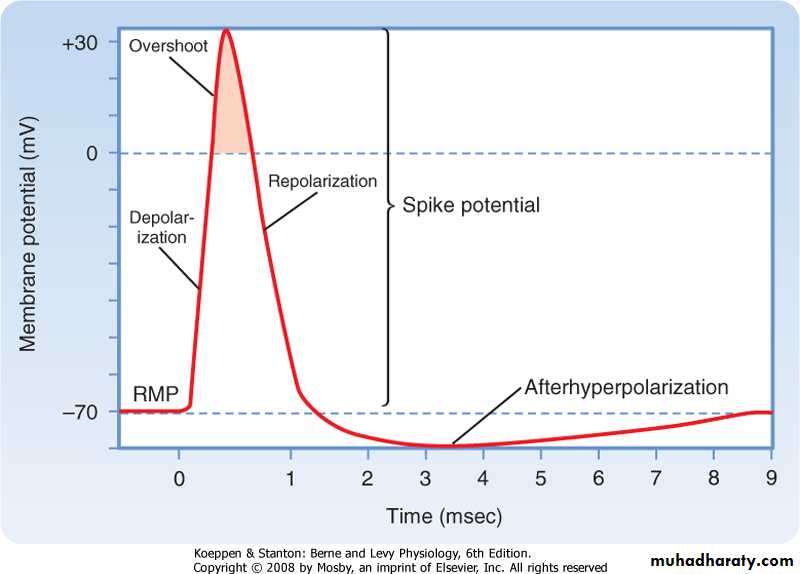
Action potential:
When inside the cell being positive with respect to outside the cell .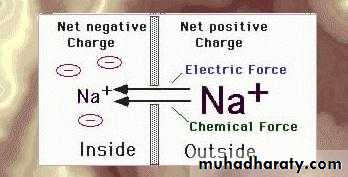
Membrane potential
Electrical Signals from Muscle
One means of obtaining diagnostic information about muscles is to measure their electrical activity .The transition of the action potential from the axon into the muscle causes muscle contraction.
Electromyography
Electromyography is a technique of recording electric activity produced by the muscles at rest and during contraction as shown in figure 1a and figure 1bThis technique is used for investigation of various neurological conditions and determinate the site and duration of action potential of muscle relaxants .

Figure 1a :Electromyography
Figure 1b:electromyograhy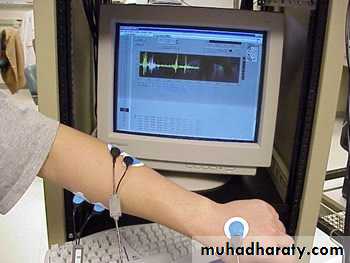

Surface electrode
Muscle action potential picked up by electrodes placed near the surface of interest . There are different types of electrodes ; surface , needle, and disc electrodes
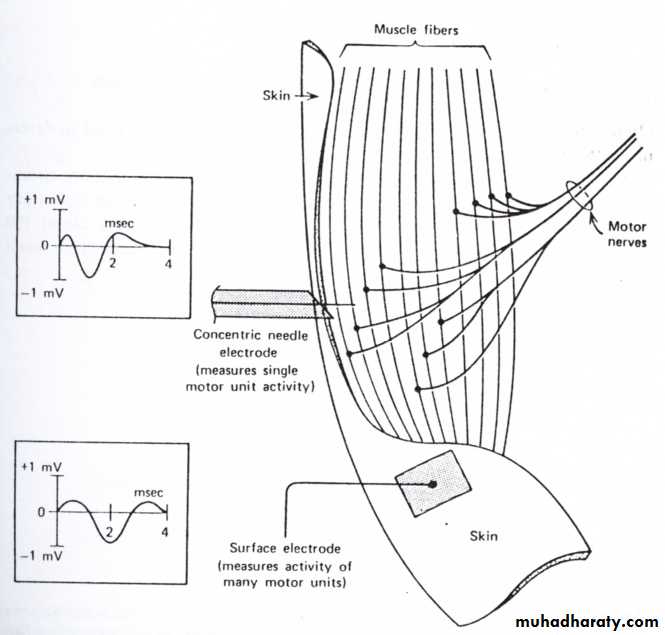
Figure 2:
Type of electrodes , surface ,needle, and disc electrodes .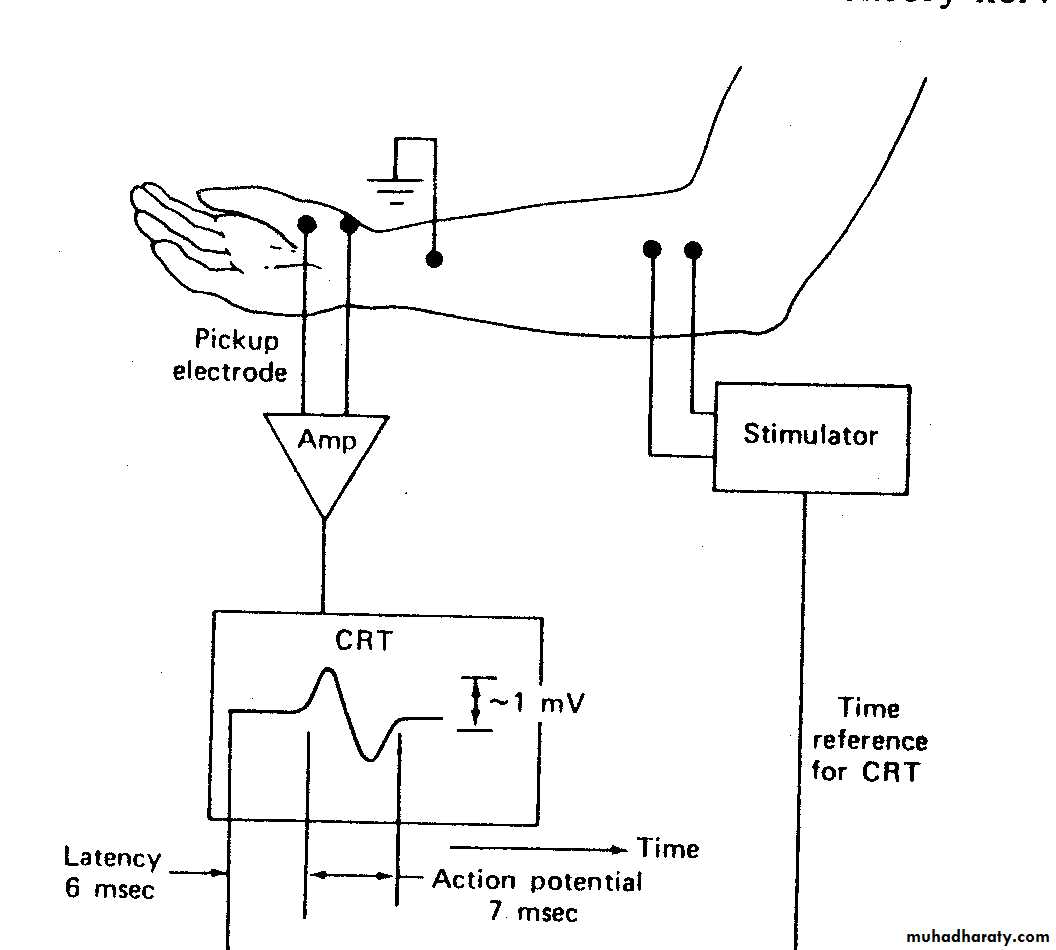
Figure 3:
EMG signal can be recorded by applying stimuli to ulnar nerve with surface electrodes and observing the contraction of muscles.One nerve supply 100 –300 muscle fibers which make up a motor unit ;
so when a nerve is stimulated a large of muscle fibers are activated .EMG electrodes record the electrical activity from several fibers , so single muscle cell are usually not monitored in an EMG examination,
because it is difficult to isolate a single fiber.
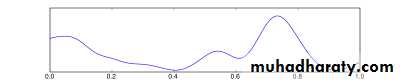
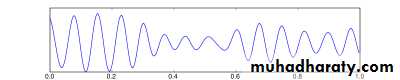
Figure 4:To record the action potential of a single muscle cell a very tiny electrode ( microelectrode ) is used which inserted in the muscle membrane .The reference electrode is immersed in the fluid surrounding the cell
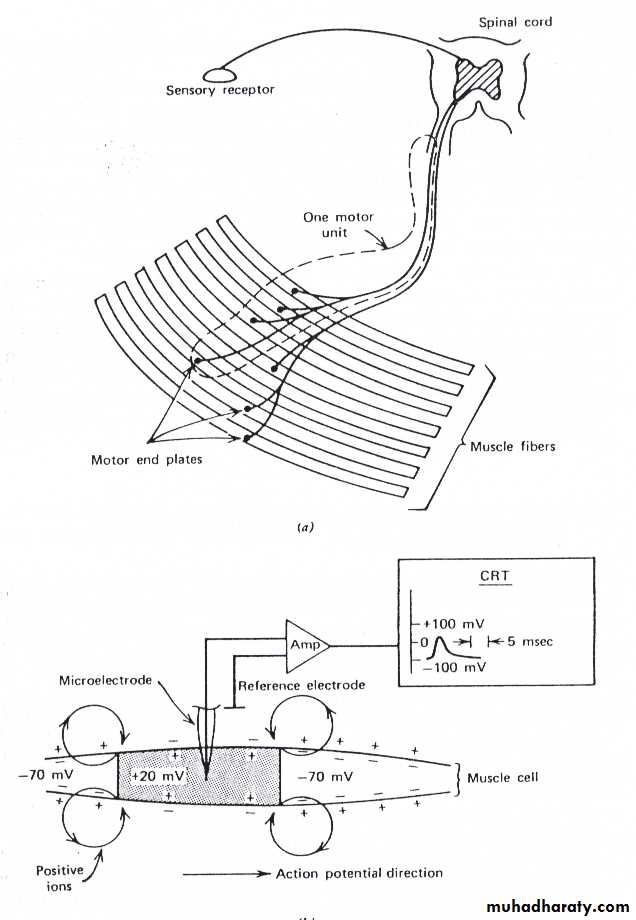
Figure 4
The amplitude of the response from a motor unit varies between 100 µ V and 1.5 mV , depending on the size of the unit and the position of the electrodes.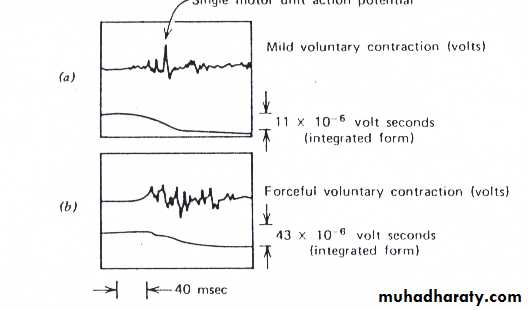
Figure 5:
The response from single muscle fiber is last about 1 ms while the response from motor unit is more complex has a duration of 6 – 12 m sec .If there is a disease in muscle the amplitude of the signal decreased and there is a cut off in signal .
EMG signals are small in amplitude and can be amplified by an amplifier
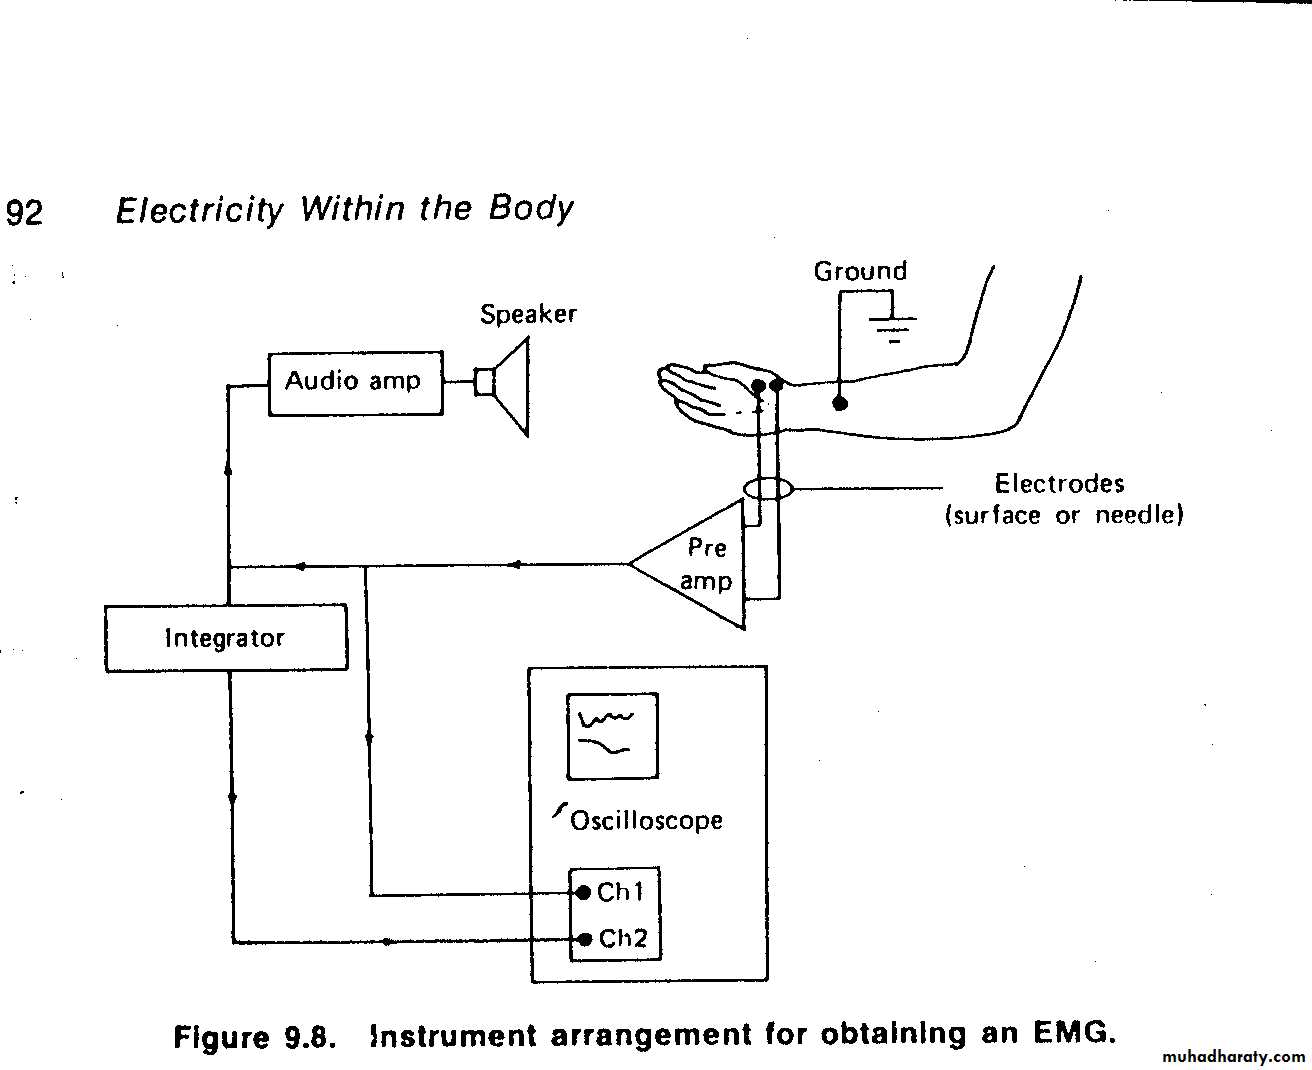
Figure 6 a:
Instrument arrangement forobtaining an EMG .
Figure 6b

The electrodes being the input of the amplifier , and the output of amplifier is connected to different monitoring
(figure 6 ) :
1 . Oscilloscope to visual the signal and
display it .
2 . Audio - speaker to allow acoustic
monitoring of the potentials .
3 . Recorder to record the signal and
storage.
an EMG obtained during electrical stimulation of a motor unit, as shown in figure 3.
Figure 3:
The action potential appear in the EMG after a latency period , figure7.latency is defined as the time between the stimulation and beginning response .
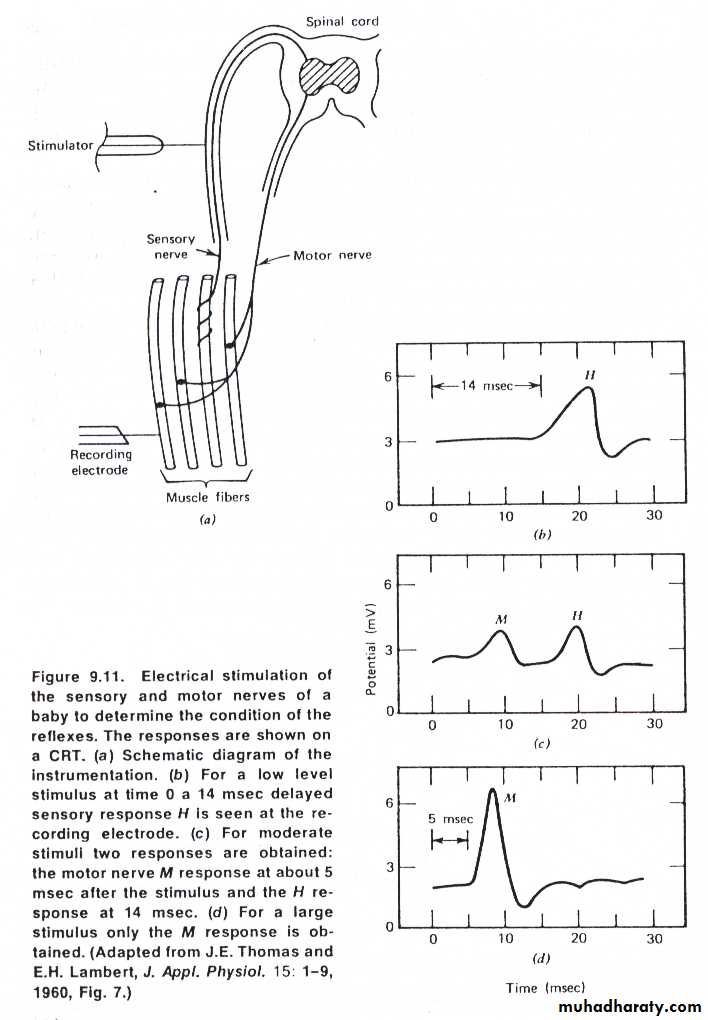
Figure 7 :
nerve conduction velocityThe velocity of the action potential in motor nerves can be determined using
EMG machine .
stimuli are applied at two locations ,
and the latency period for eachresponse is measured , as shown in
figure 8..Figure 8:measurement of motor nerve conduction velocity
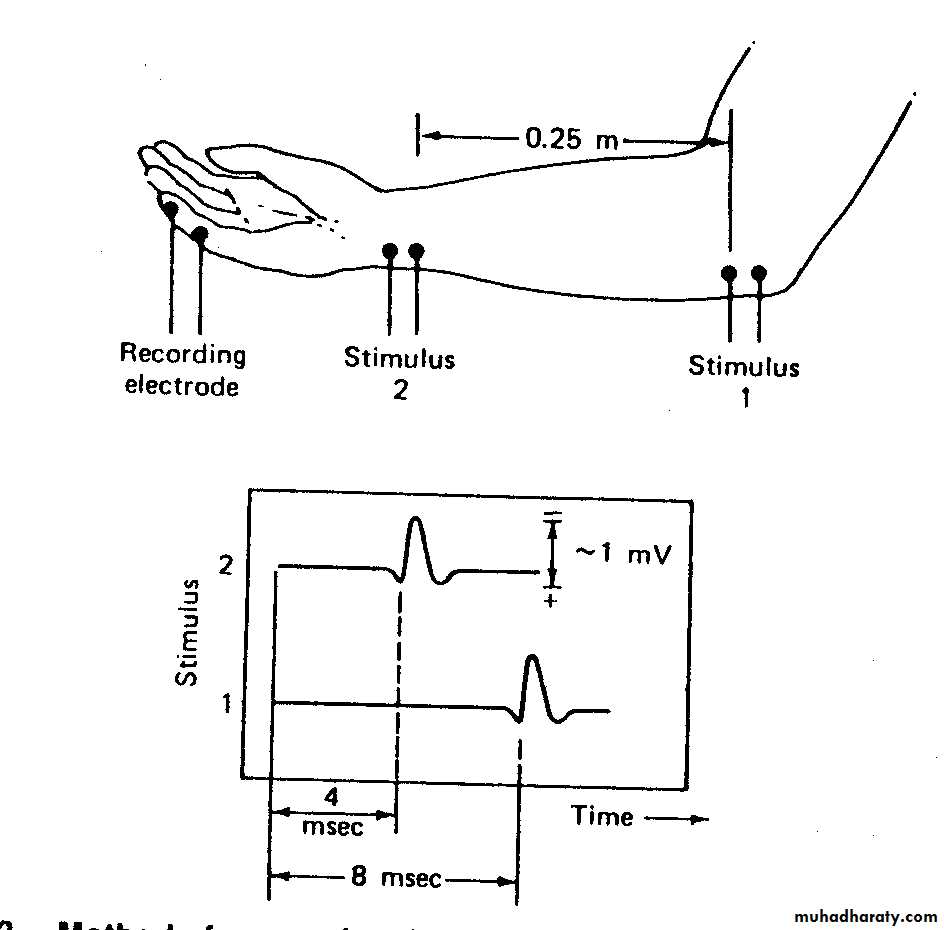
the difference between the two latency periods is the time required for the action potential to travel the distance between them ;
the velocity of the action potential is this distance divided by this time, as shown in figure 8.
Nerve conduction velocity
Nerve conduction velocity =
distance between two stimuli
Latency 1 – latency 2
typical velocities are 40 to 60 m /sec ;
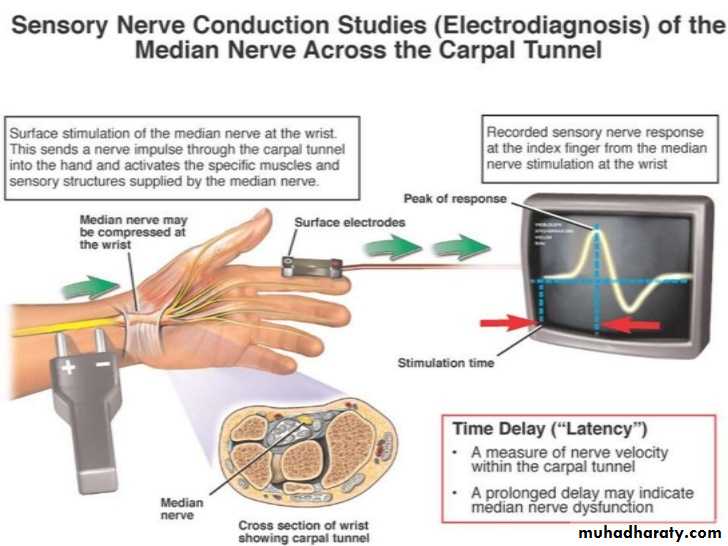
a velocity below 10 m /sec would indicate a problem .The conduction velocity for
sensory nerves can be measured by stimulating at one site and recording at several locations that are known distances from the point of stimulation , as shown in figure 9.Figure 9: Sensory nerve conduction velocity
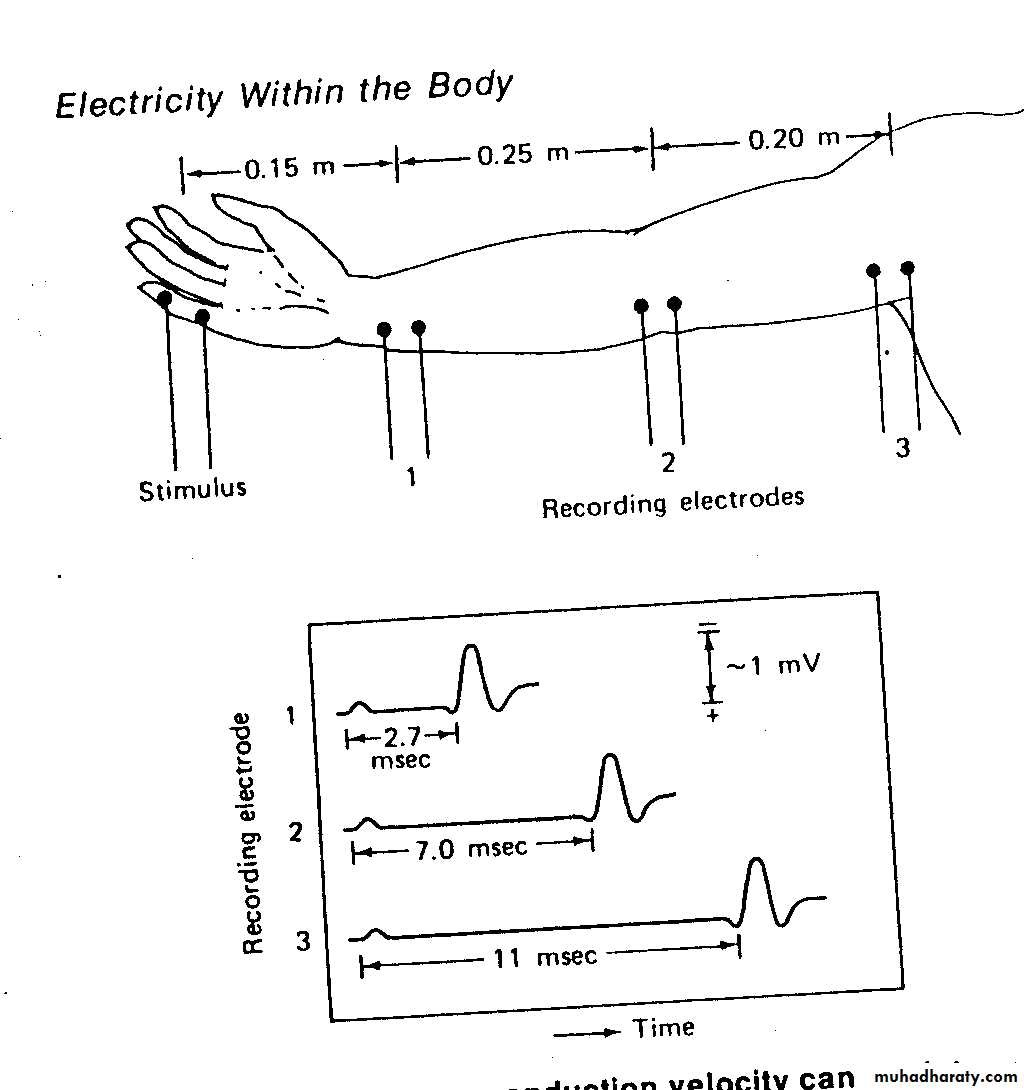
Many times nerve damage results
in
a decreased conduction velocity
Electrical signals from the heart
The rhythmical action of the heartis controlled by an electrical signal initiated by spontaneous stimulation of special muscle cells located in the right atrium .These cells make up the senatorial (SA) node , or pacemaker (figure 1). The SA node fires at regular intervals
Figure 1 :The spread of cardiac impulse .
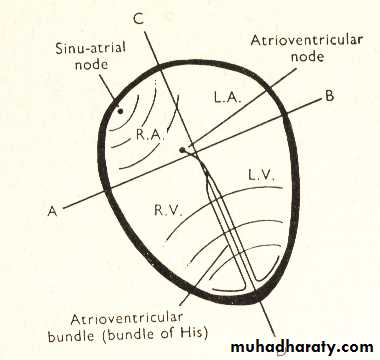
The electrical signal from the SA node initiates the depolarization of the nerves and muscles of both atria causing the atria to contract and pump blood into the ventricles.
Re -polarization of the atria follows
The electrical signal then passes into the atrioventricullar node ( AV ) node , which initiates the depolarization of the right and left ventricles , causing them to contract and force blood into the pulmonary and general circulation's .The ventricle nerves and muscles then repolarize and the sequence begins again .
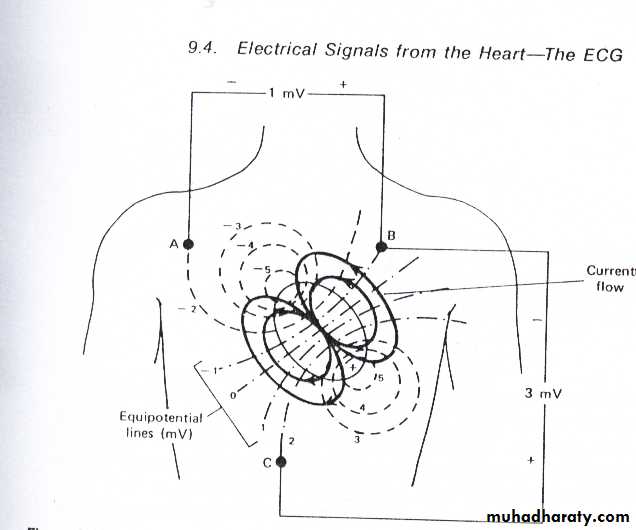
The nerves and muscles of the heart can be regarded as sources of electricity enclosed in an electrical conductor .
Figure 2 The potential distribution on the chest at the moment when the ventricles are one half depolarized . Electrodes located at A, B, and C would indicate the potentials at that moment
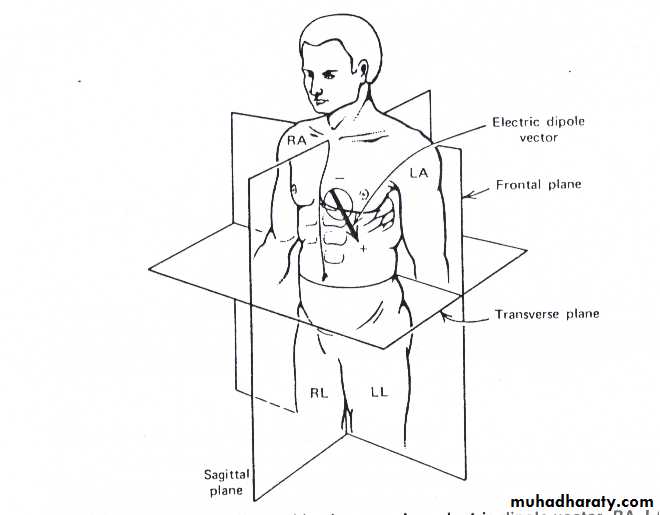
An electric dipole is produced when equal positive and negative charges are separated from each other . It can be represented by a vector .
The electrical (cardiac ) potential that we measure on the surfaces of the body is merely the instantaneous projection of the electric dipole vector in a particular direction .As the vector changes with time , so does the projected potential .
Figure 3 shows an electric dipole vector along with the three electrocardiography body planes .
Figure 3 :electrocadiographic planes and an electric dipole vector RA, LA , RL an LL indicate electrode locations on the right and left arms and legs .
The wave form of ECG is some time positive and in other cases it is negative . The sign of the waveform depends upon the direction of the electric dipole vector and the polarity and position of the electrodes.
Electrocardiograph (ECG)
The potentials produced by the heart spread to the surface of the and detected by electrodes placed there . The process of recording these potentials is known as ECG . The potentials are small so that they require to be electrically amplified before they are recorded (figure 4) . .Figure 4: Typical ECG . P represents the atrial depolarization and contraction, The QRS complex indicates the ventricular depolarization,The ventricular contraction between S and T T represents the ventricular repolarization
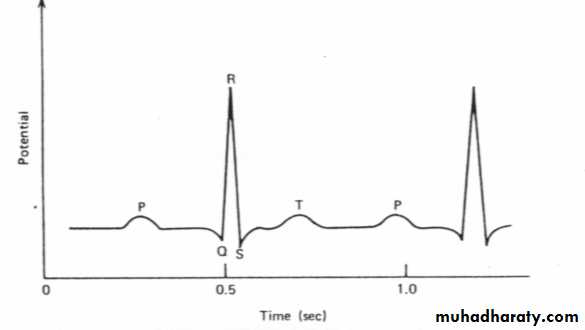
Figure 4: Typical ECG .
P represents the atrial depolarization and contraction,The QRS complex indicates the ventricular depolarization,
The ventricular contraction between S and T
T represents the ventricular repolarization .
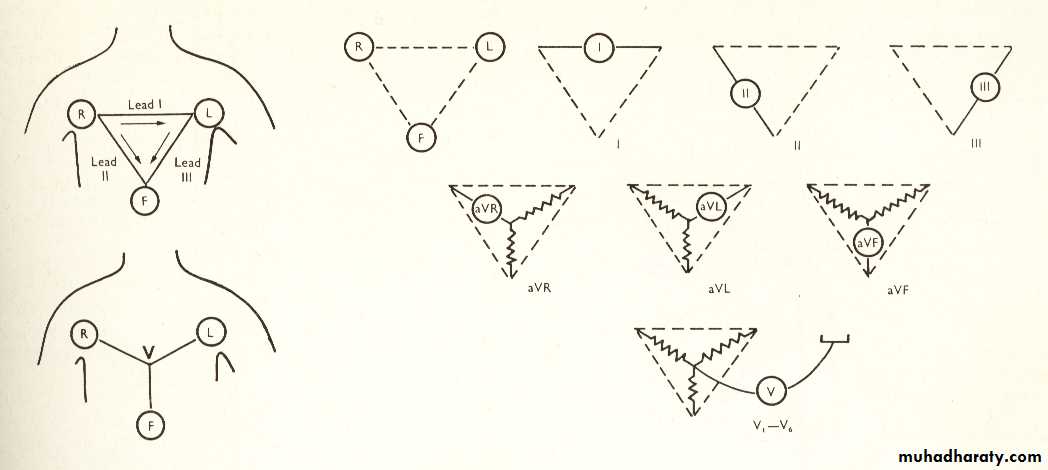
To record the standard limb leads
electrodes are applied to the left arm , right arm and left leg(figure 5,and figure 6 ) .
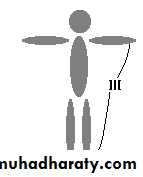
Figure 5 :The position of lead I , lead II, and Lead II .
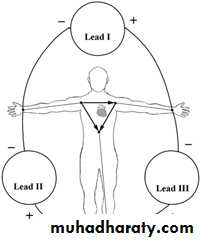
Figure 6 : Schematic of the electric dipole of the heart projected on the frontal plane . For electrical purposes the three electrodes (RA,LA, and LL) can be thought of as the points of a triangle ,the Einthoven triangle .
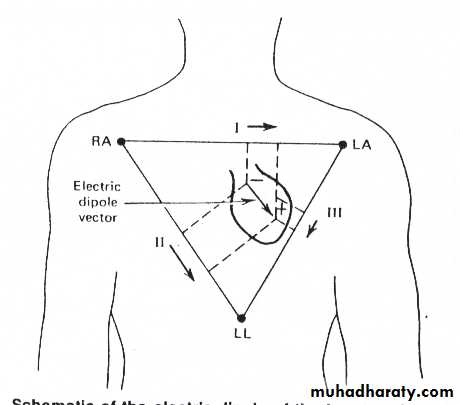
Figure 6 : Schematic of the electric dipole of the heart projected on the frontal plane . For electrical purposes the three electrodes (RA,LA, and LL) can be thought of as the points of a triangle ,the Einthoven triangle . The potential in lead I at any moment is proportional to the projection of the dipole vector on the line RA –LA ; the potentials in Leads II and Lead III are proportional to the projections on the other sides of the triangle .
Figure 7 : The electrical connections for Lead I , II ,and III . The usual polarities of the recording instrument are indicated for each lead .
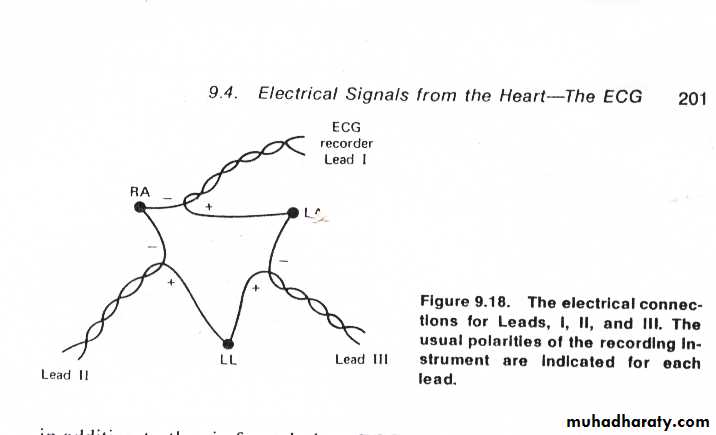
When the switch of ECG apparatus is at lead I the electrodes on the R and L arms are connected to the amplifier (figure 8 ) .
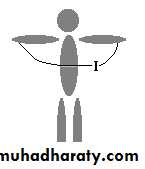
Figure 8 :Lead I
The amplifier then records record the potential difference between the right and left arm
,
,
Lead I measure the potential difference between the RA and LA , (figure 8).
Lead II measure the potential difference between RA and LF . (Figure 9)
Lead III measure the potential difference between LA and LF . (figure 10 )
.
Figure 9: Lead II .
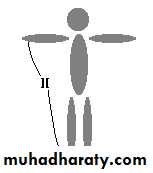
Figure 10 : Lead III
1.Bipolar leads
Lead I , Lead II , and Lead III are referred to as bipolar leads , because the measured signal is the difference in potential between two electrodes .2. Unipolar measurements.
are made by recording the potential at one electrode with respect to the average of the other two potentials .These are referred as
aVR , aVL and aVF leads .
Figure12 An augmented lead is obtained by placing a pair of resistors between two of the electrodes . The center of the resistor pair is used as one of the connection .
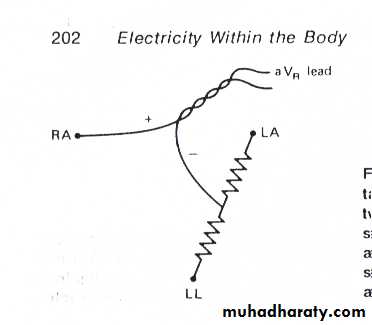
These leads are recorded by connecting the amplifier between one limb and the junction of two resistance which are connected to the other two limbs
As shown in figure 12.
aVR measure the P.d between
RA and ( LA + LF ) /2(figure 13)
aVL measure the P.d between
LA and (RA+LF )/2 (figure 14)
aVF measure the P.d between
LF and (RA +LA )/2 (figure15 )
figure 13: Lead aVR
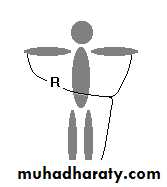
Figure 14 : Lead aVL.

Figure 15 :Lead aVF.

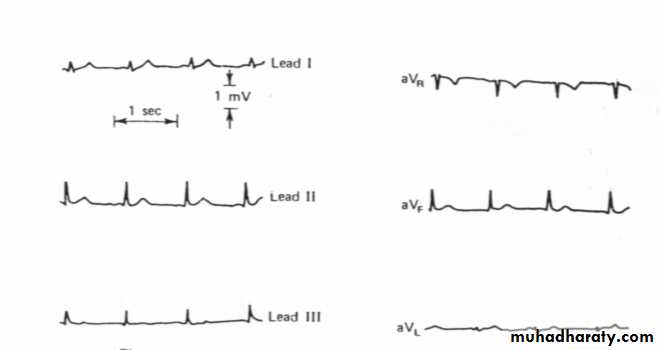
Figure 11: Six frontal plane ECG s for a normal subject .
3. Chest leadsAre recorded by connecting the amplifier between the chest electrode and resistance connected to all three limbs (RA+LA+LF)
as shown in figure 16. .
Figure 1 6 :Transverse plane ECG positions . (a ) Frontal view (b) Top view .
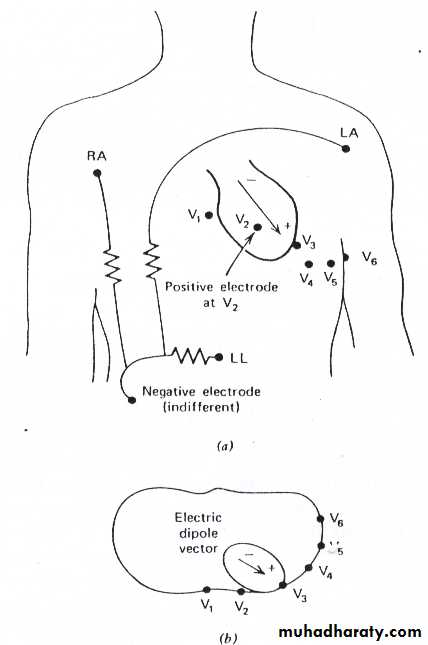
So , the chest electrode is being one input of the amplifier and the other input is connected to an electrically neutral point V which is obtained by joining the three limb leads together through a resistance's .
Such a recording is designed V1 , V2, V3 , V4 , V5, and V6 according to the position of the electrode on the chest , as shown in figure 17 .
Figure 18 shows six transverse plane ECGs for a normal subject .
Figure 19 shows the routine ECG .
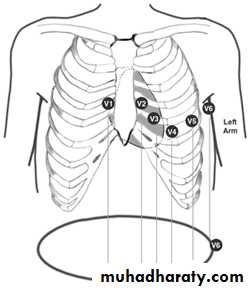
Figure 17 :Chest electrodes
Figure 18: Six transverse plane ECGs for a normal subject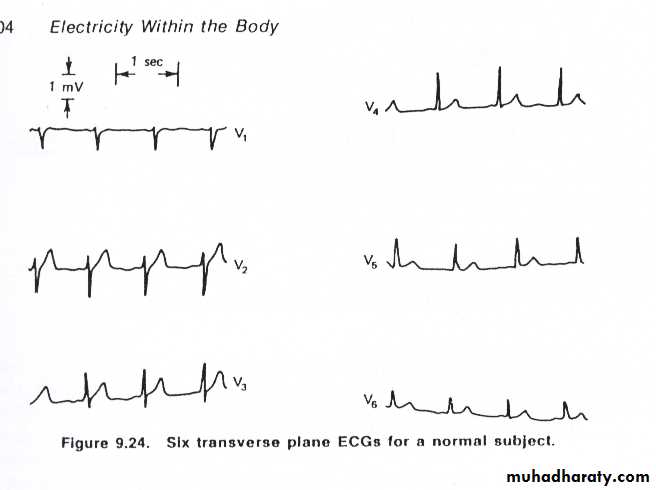
.
Figure 19: The standard electrocardiogram leads
(Electroencephalograph) (EEG)
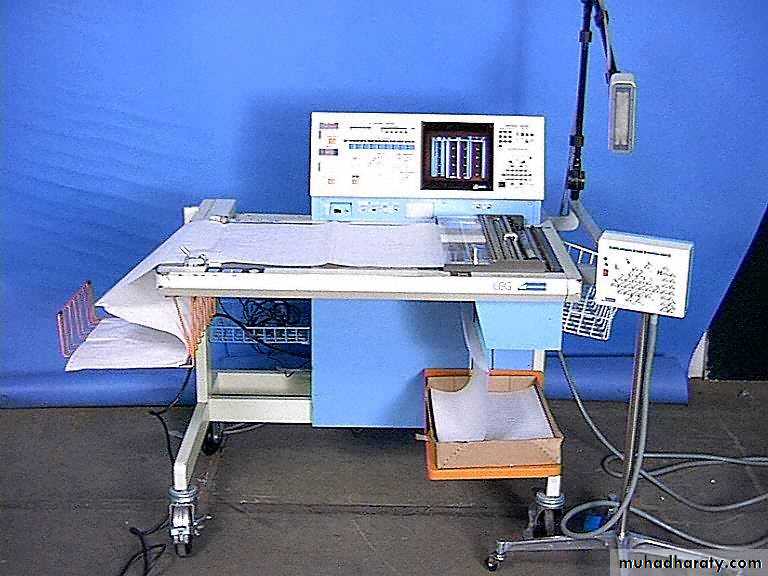
EEG is a technique of recording electrical activity of the brain through the intact skull ,figure 1.Figure 1 : EEG machine.
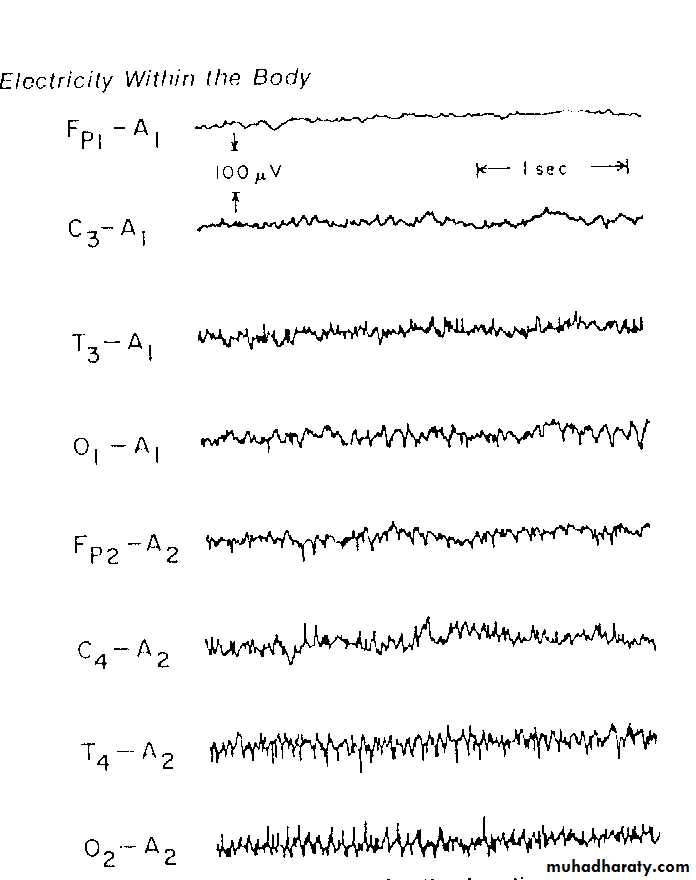
Electrodes are applied on the scalp (figure 2 )and potential difference recorded and amplified and present for interpretation as an inked tracing on moving paper (figure 3).
Figure 2

Figure 2
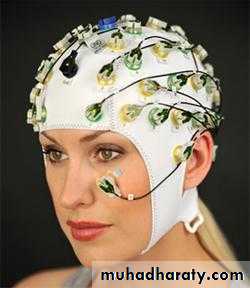
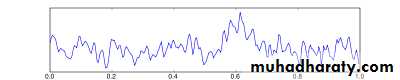
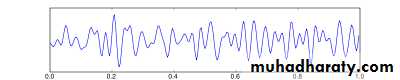
Figure 3: EEG signal
Machines in common use have
eight or sixteen or more channels so that it is possible to record the activity from different areas of the head simultaneously. .The technique is relatively simple
and entirely harmless andmay give information
which is of great important
in neurological diagnosis.
The frequency of the EEG signals
depend on the mental activity
of the subject .
Figure 4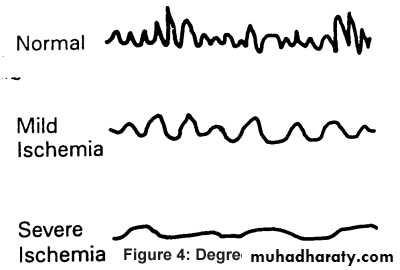
For example
a relaxed person usually (figure 4)has an EEG signal composed
primarily of frequencies
from 8 to 13 Hz, or alpha waves
When a person is more alert a higher frequency range , the beta wave range (above13Hz), dominates the EEG signal.
The frequencies of the EEG signals(Wave types )
Delta wave(δ) 0.5 to 3.5 Hz(associated with deep sleep )
Theta wave(θ) 4 to 7 Hz
(appears as consciousness slips into drowsiness)
Delta wave(δ) 0.5 to 3.5 Hz
(associated with deep sleep and for very young people, or, for underling lesion)
Theta wave(θ) 4 to 7 Hz (appears as Consciousness slips to drowsiness)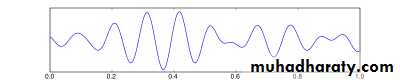
Alpha wave (α) 8 to 13 Hz
indicate a relaxed awareness and
inattention).Indicate a relaxed awareness and in attention
Beta( β) 14 to 50 Hz
Walking rhythm associated with active thinking
EEG wave types
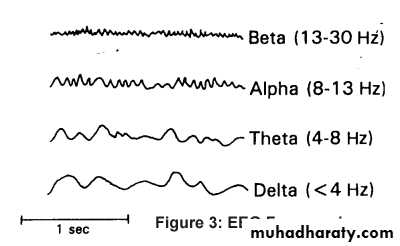
Figure 5: EEG waveform.
The amplitude of the EEG signals
is low (about 50μv), as shown in figure 5 ,and interference from external electrical signals often causes problems in EEG signals processing . Even if external noise is controlled ,the potentials of muscle activity such as eye movement can cause artifacts in the recordEEG recording
EEG as investigation method of brain activity
The main present clinical application of EEG are the following:1 . to investigate lesion in the brain ,
because lesion can provided abnormal activity of the brain . Abnormality in the signals could be in its amplitude , width or its sequence. .
2. Abnormality in EEG output occurs
with people having epilepsy .
EEG may be help to distinguish
between different type of epilepsy .
3. Many medically conditions produce
cerebral complications that can besimply detected .
4 . Spinal cord abnormality can be
detected and investigated using
EEG technique .
Types of Electrodes
(There are different types of electrodes used in EEG technique ,such as pad, disc , needle, and
silver chloride electrodes .)
Pad electrode

Disc electrode
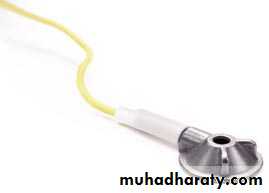
Needle electrode

Silver to silver chloride electrode

Electrode Placement
How to apply electrodes on thesubject head ?
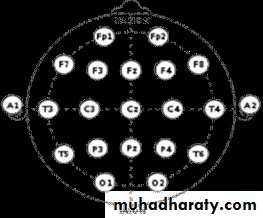
The 10 –20 system is used in applying the 19 electrodes on the scalp (figure 6 ) .Thus , measure the head distance from Nasion to Inion along the middle line and mark the point C at the midpoint and divided this distance by20% and 10%, figure 7 .
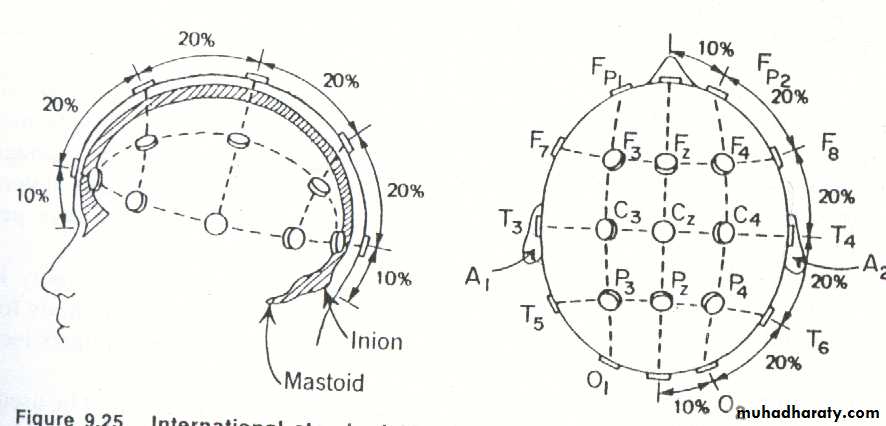
Figure 6
International 10 -20 system of location electrodes for EEG sF- frontal , P – parietal , O – occipital , and T – tempral .
:
Figure 7: measure the distance between nasion and inion

Then , measure the distance from right to left and divided by 20% of this distance, as shown in figure 7 .
Thus all electrodes are applied on the head according to 20 % of the head distances .
When all electrodes are fixed on the head , each is injected with electrode jelly . The 19 electrodes are hold in the head by head cap . Then , all electrodes are connected to the head box in which it connected to the amplifiers , as shown in figure 8.

Figure 8 electrodes placement on the scalp.
EEG Head box
The 10 – 20 system is used to ensure that the inter electrodes spacing are equal along longitudinal or transverse line ,and to determine the distribution of electrical potential over the scalp completely and accurately .
Electrodes used , type , and characteristics
Electrodes used in EEG are of special design , and must have the following characteristics:1.Electrode impedance must be less than5 kΩ, between 2-5 kΩ , to avoid drop in the signal potential .
2 . Electrodes used must be very high
purity , because impurityincreased the signal artifacts .
3 . All electrodes used should have the
same input impedance to avoid the
recording unbalance due to the
phase shift.
4 . All electrodes should be stable potential, because unstable potential will produce artifacts very much larger than EEg signal.
5 . Electrodes must be cheap , easy to
apply , easy to prepare , and to
maintain , and it should be
without hazard to patient .
How to connect electrodes with the amplifier
• There are three basic methods of deriving electrical signals from electrodes :
• 1. Bipolar
• 2 . Common reference derivation
• 3. average reference derivation
1. Bipolar :
For bipolar each channel is connected between two electrodes both of which are likely to be affected by appreciable EEG potential ,as shown in figure 9 .Each amplifier measures the potential difference between the electrodes to which it is connected.
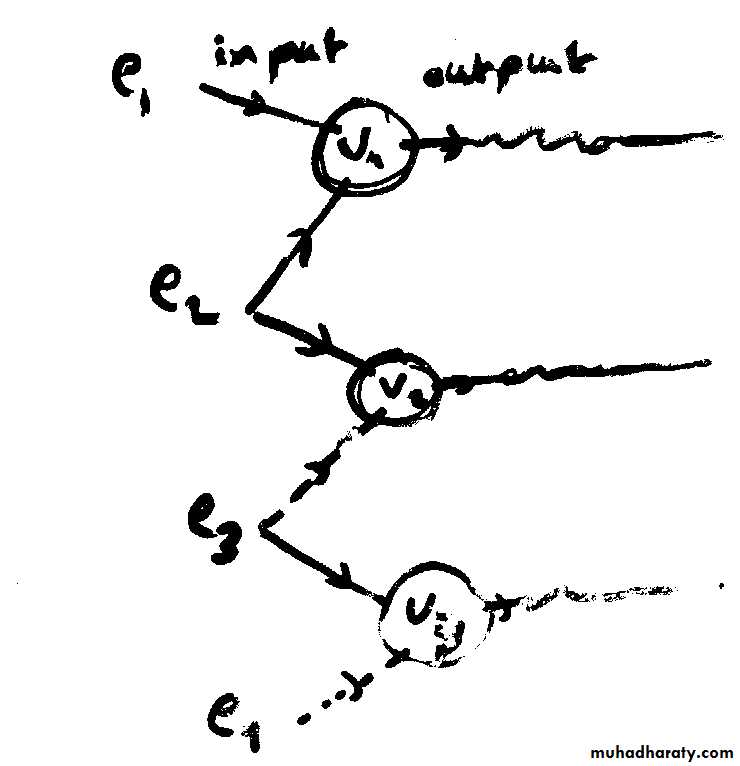
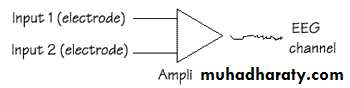
Bipolar connection : each channel is connected between two electrode
The input signal to the amplifier isV1 = e1 – e2
V2 = e2 – e3
V3 = e3 – e4
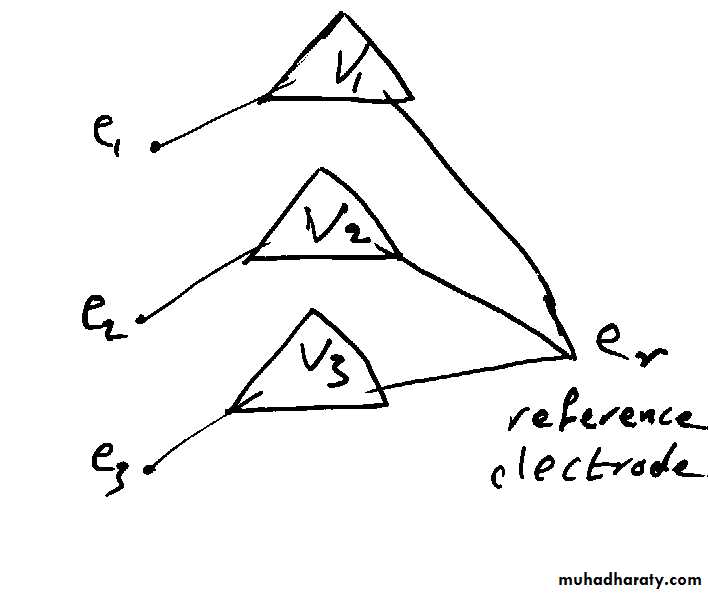
2. Common reference derivation
In this method one electrode is common to all group of channels . Each amplifier is connected between an active electrode and reference electrode .
Amplifier input signal is: V1 = e1 – er
V2 = e2 – er
V3 = e3 – er
In common reference , there is no phase reversal .
3 . average reference derivation
The electrodes on the scalp are connected through equal resistance to single point which is used as a common reference, as shown in figure 11. The potential at this point is the average of the potential of the scalp electrodes .Each amplifier is connected
between an active electrode andaverage reference electrode through
equal resistance.
average reference derivation connection of electrodes with amplifier
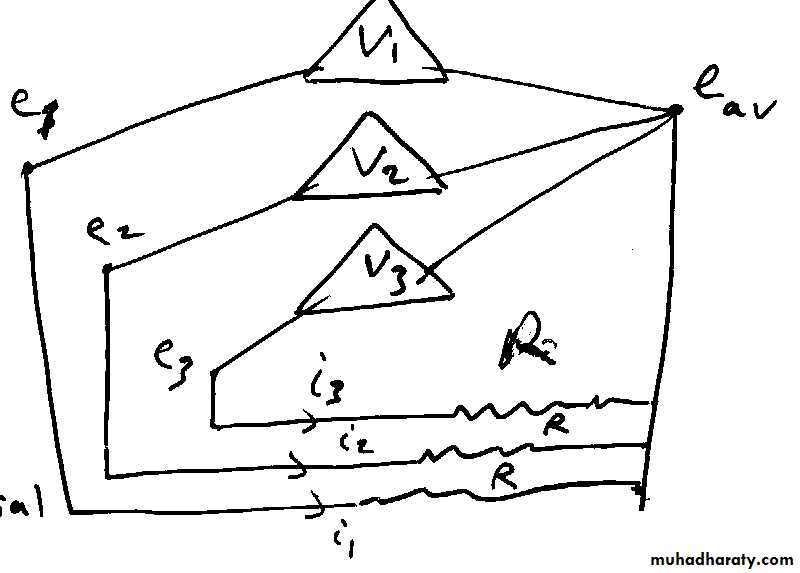
Figure 9
Figure 9 :Figure 11
average reference derivation connection of electrodes with amplifier
Amplifier input signal isV1 = e1 – eav
V2 = e2 – eav
V3 = e3 – eav