I
NTERACTIVE
ECG
MADE SIMPLE
AMMAR SAMEER
1
AMMAR SAMEER
Senior Medical Student
Baghdad Medical College
I
NTERACTIVE
ECG
MADE SIMPLE
AMMAR SAMEER
2
MODULE 1
BASIC THEORY & ANALYSIS
T
HEORETICAL BASIS
L
EAD PLACEMENT
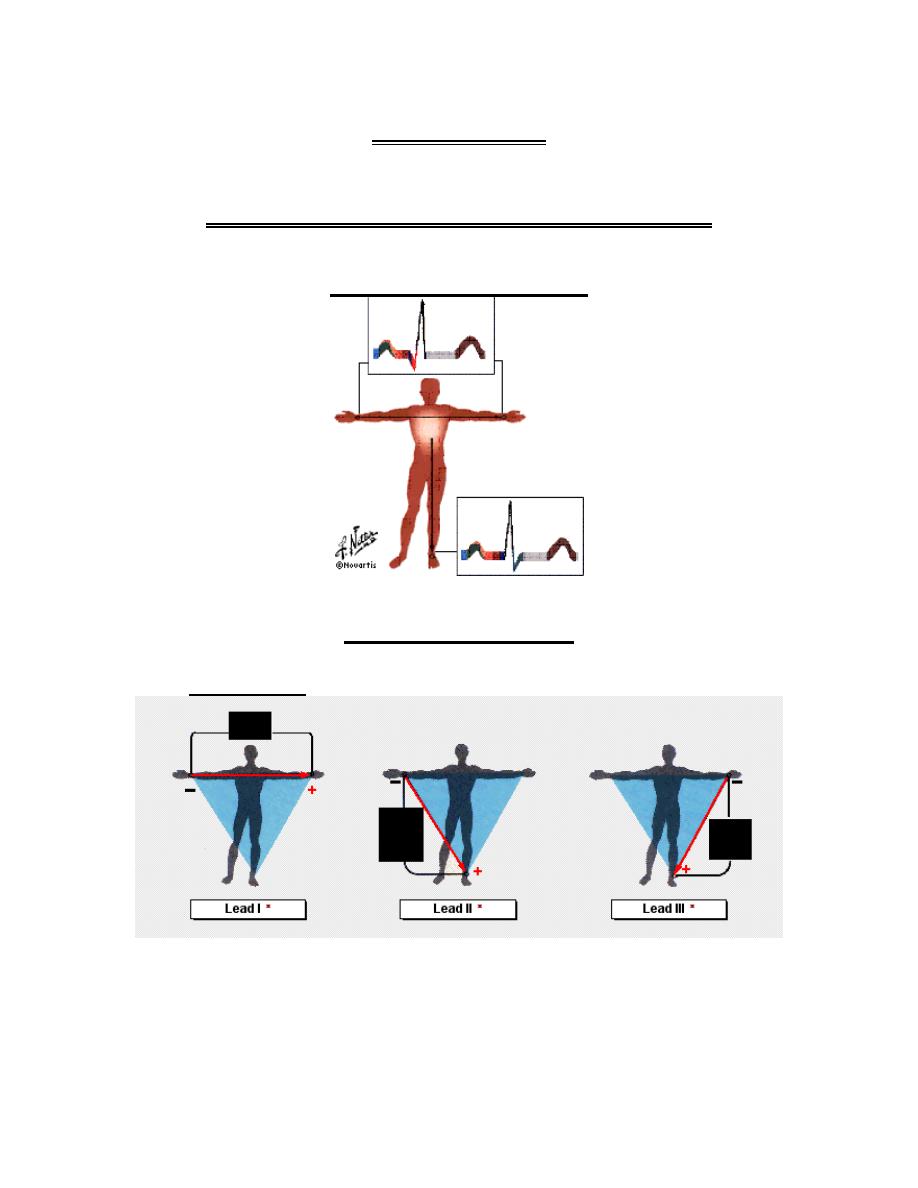
1. Limb leads:
These are bipolar limb leads, i.e. two electrodes are used to record
the electrical potential difference in the frontal plane.
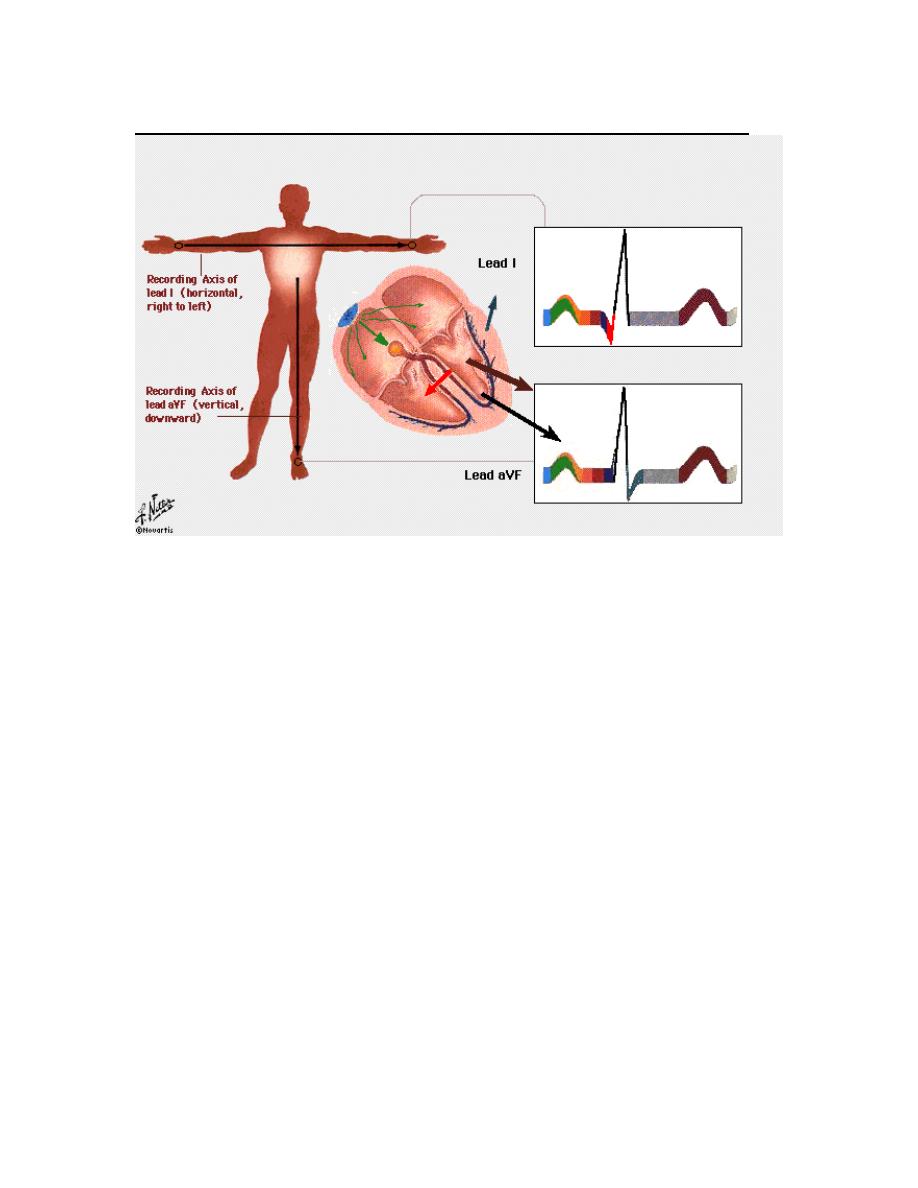
a. In limb LEAD I, the positive electrode is placed at the left arm
and the negative electrode at the right arm; its axis is directed
from right to left.
I
NTERACTIVE
ECG
MADE SIMPLE
AMMAR SAMEER
3
b. In limb LEAD II, the positive terminal is placed at the left leg
and negative terminal at the right arm; its axis is directed
inferiorly from right to left, 60 degrees clockwise from
horizontal.
c. In limb LEAD III, the positive lead is placed at the left leg and
the negative lead at the left arm; its axis is directed inferiorly
from left to right, 120 degrees clockwise from horizontal.
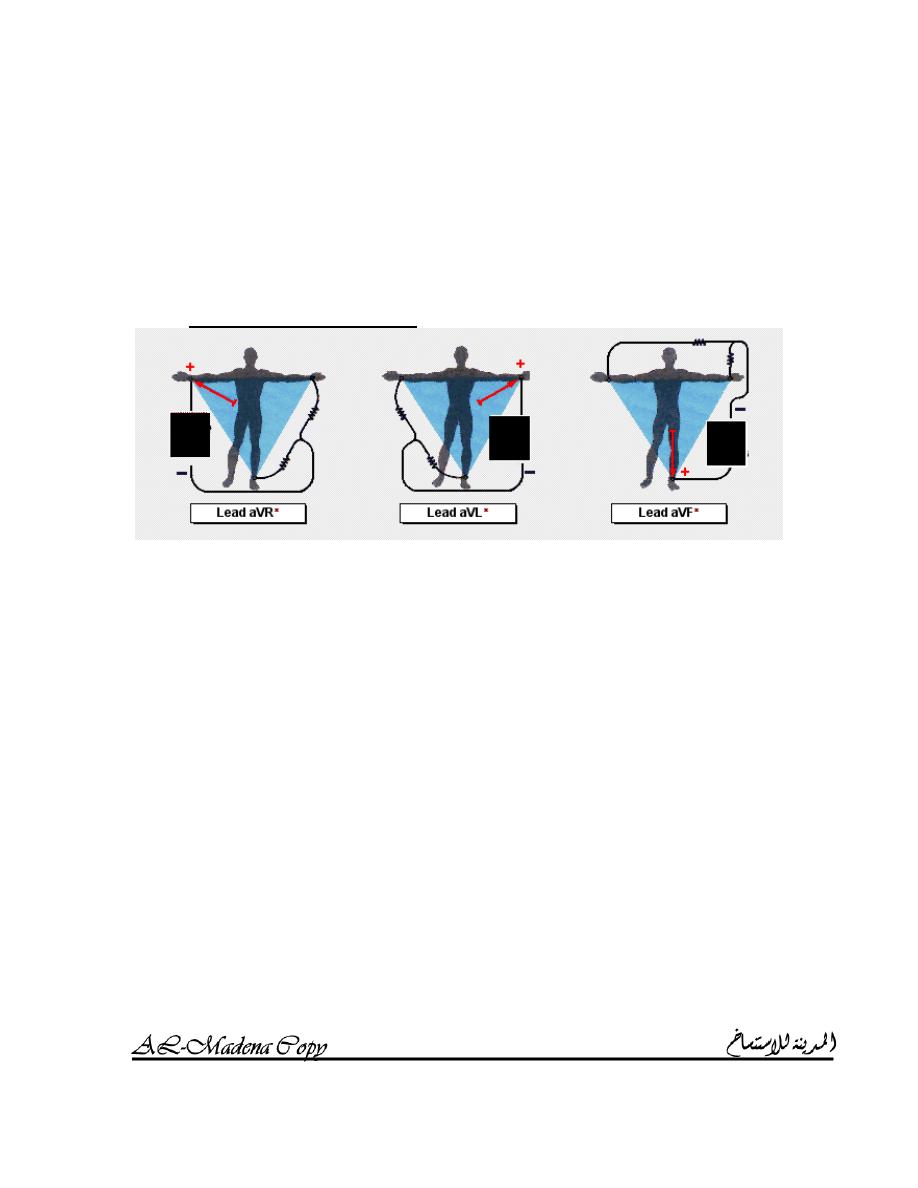
2. Augmented limb leads:
These are unipolar leads because the center of the heart is used as a
reference point and the electrode is placed on the limb.
a. LEAD aVR is a unipolar limb lead with a positive terminal on
the right arm; its axis is directed upward and right,
perpendicular to the lead III axis.
b. LEAD aVL is a unipolar limb lead with a positive terminal on
the left arm; its axis is directed upward and left, perpendicular
to the lead II axis.
c. LEAD aVF is a unipolar limb lead with a positive terminal on
the left leg; its axis is directly vertical downward (90 degrees
from horizontal), perpendicular to lead I axis.
I
NTERACTIVE
ECG
MADE SIMPLE
AMMAR SAMEER
4
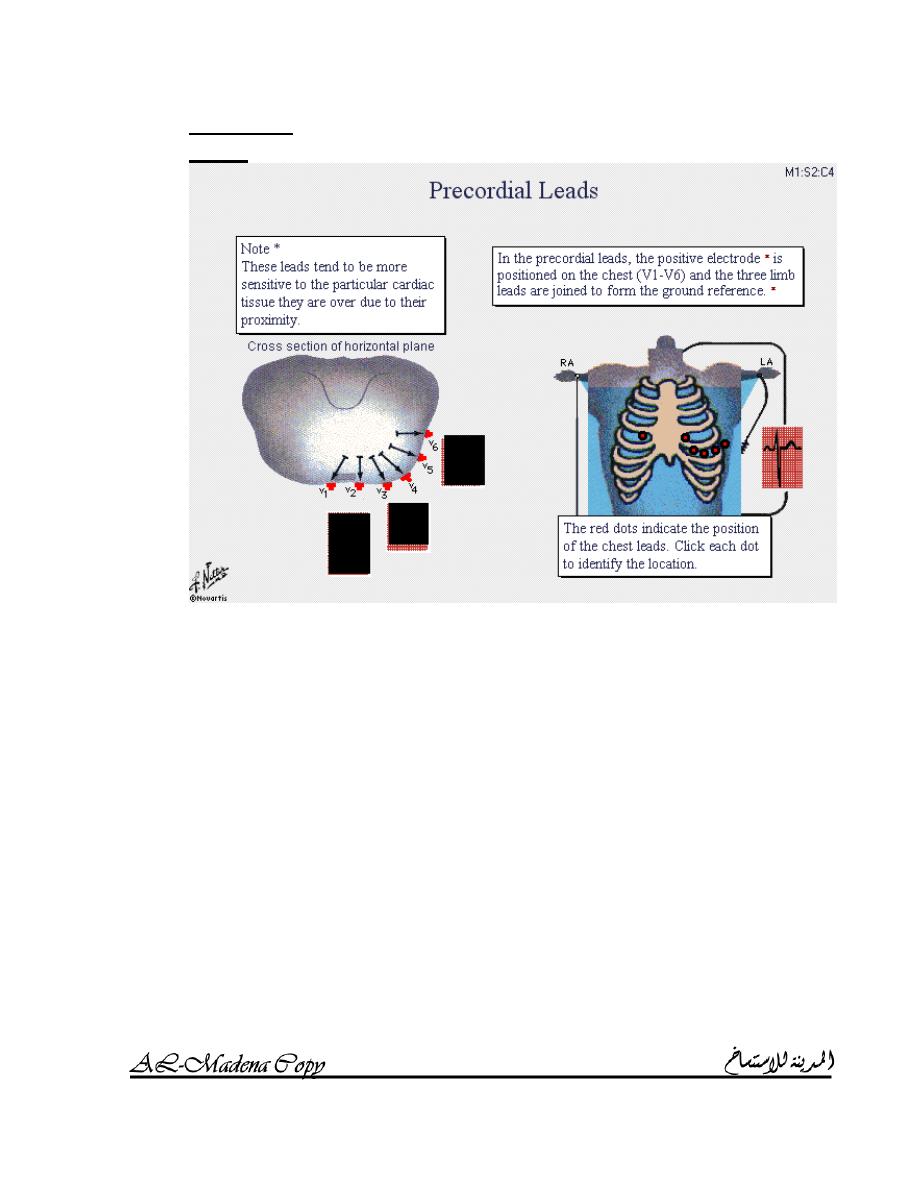
3. Precordial
leads:
The positive electrode is positioned on the chest (V
1
– V
6
) and the
three limb leads are joined to form the ground reference.
These leads tend to be more sensitive to the particular cardiac
tissue they are over due to their proximity.
a. V
1
is the forth intercostals space to the right of the sternum.
b. V
2
is the forth intercostals space to the left of the sternum.
c. V
3
is halfway between V
2
and V
4
.
d. V
4
is at the left midcalvicular line in the fifth intercostal space.
e. V
5
is at the left anterior axillary line in the fifth intercostal
space.
f. V
6
is at the left midaxillary line in the fifth intercostal space.
I
NTERACTIVE
ECG
MADE SIMPLE
AMMAR SAMEER
5
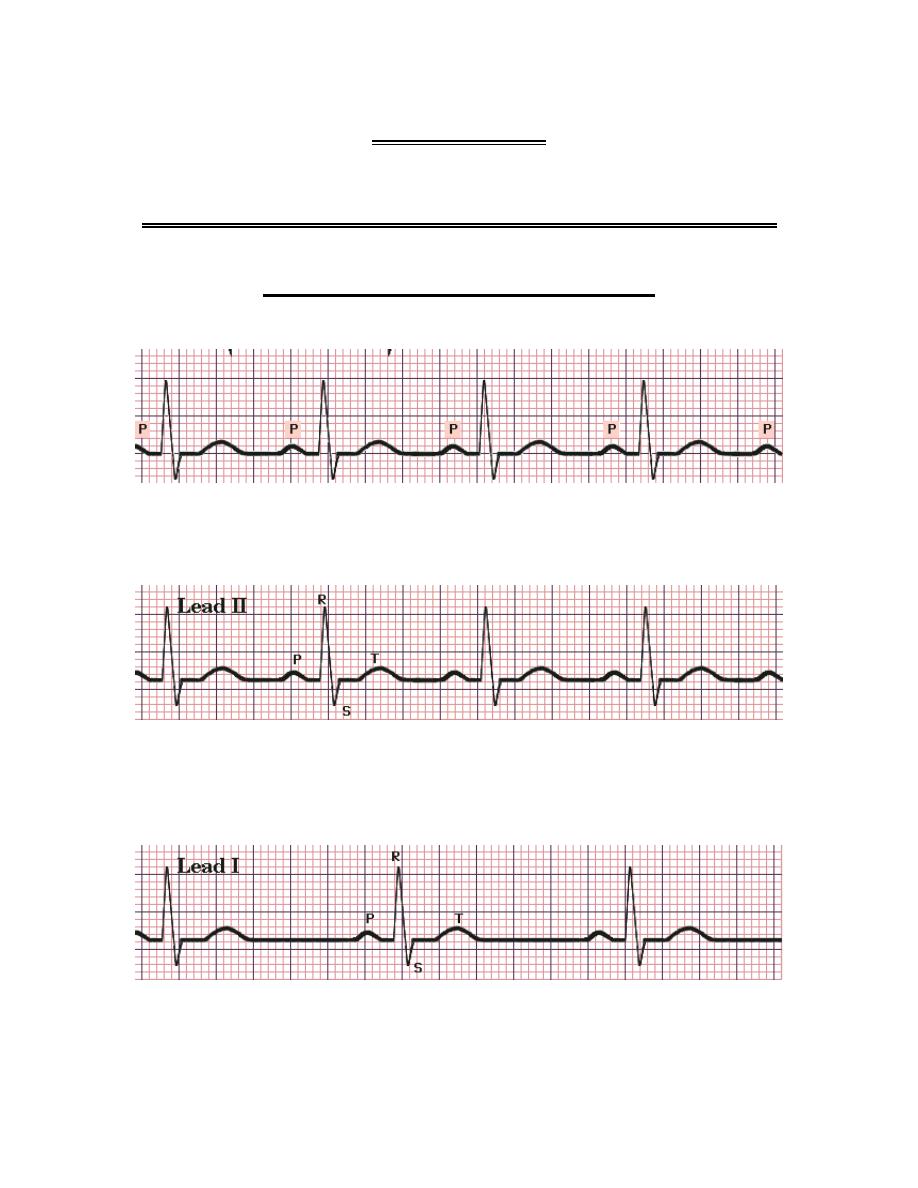
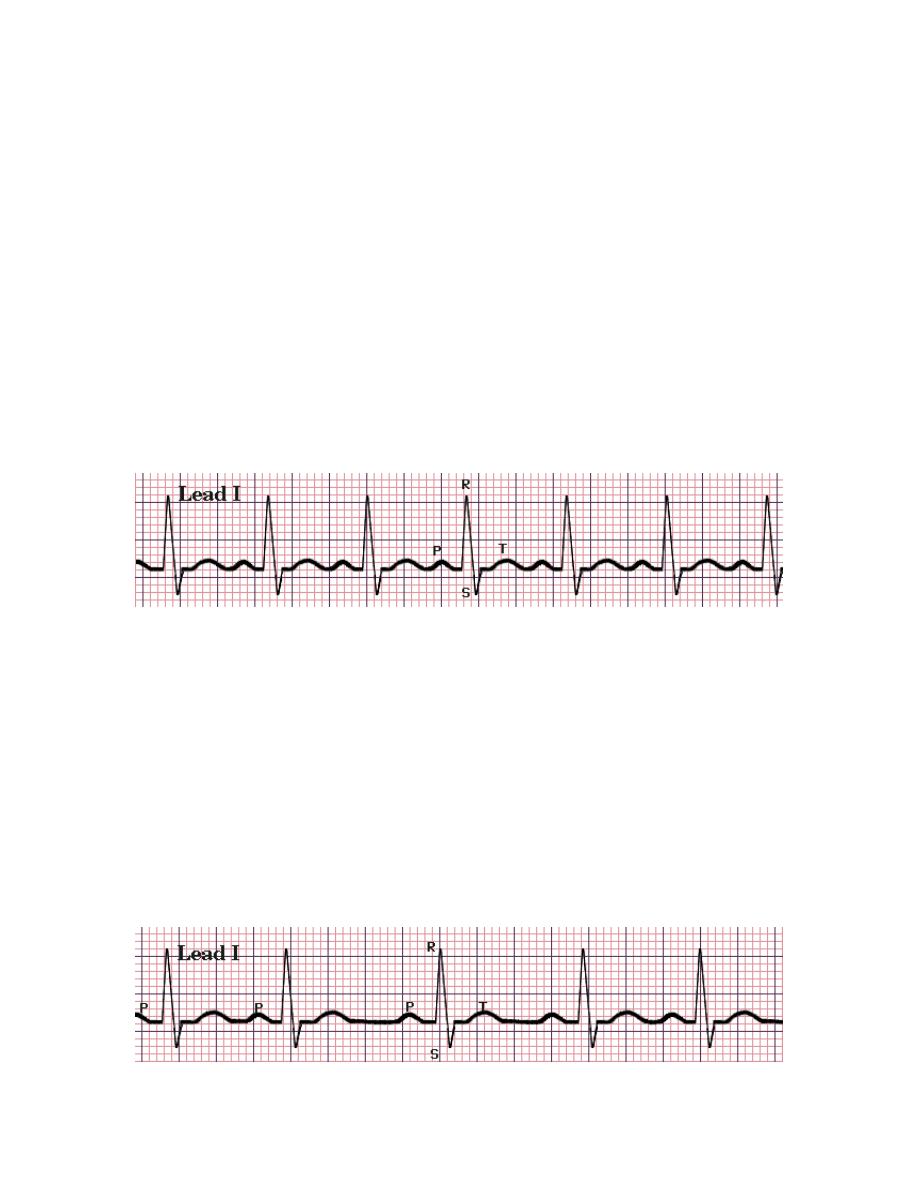
Normal sequence of cardiac depolarization and repolarization
A. Impulse origin and atrial depolarization:
Impulse originates at SA node and wave of depolarization spreads
over atria.
This cause upward positive deflection in leads I and aVF (P wave).
B. AV node stimulation:
The dense conduction fibers of the AV node introduce a delay so that
ventricular depolarization will not occur too early.
There is no deflection during this period.
The period from the beginning of P wave to the end of this delay is
known as the PR interval.
C. Septal depolarization:
Myocardial depolarization of the interventricular septum results in a
small negative downward deflection in lead I (Q wave) and positive
upward deflection in lead aVF (R wave) (no Q wave).
D. Apical and early ventricular depolarization:
This result in large positive upward deflection (R wave) in lead I and
extend R wave in lead aVF.
E. Late ventricular depolarization:
I
NTERACTIVE
ECG
MADE SIMPLE
AMMAR SAMEER
6
This extends R wave in lead I and causes negative downward
deflection (S wave) in lead aVF.
F. QRS complex:
The QRS complex reflects complete depolarization of the ventricles.
Because of lead placement, the Q wave is present in lead I but not in
lead aVF and the S wave is present in lead aVF but not in lead I.
G. Repolarization:
When the heart is fully depolarized, there is no electrical activity for a
brief period (ST segment).
Repolarization produces upward positive deflection in both leads I
and aVF (T waves).
I
NTERVAL MEASUREMENT
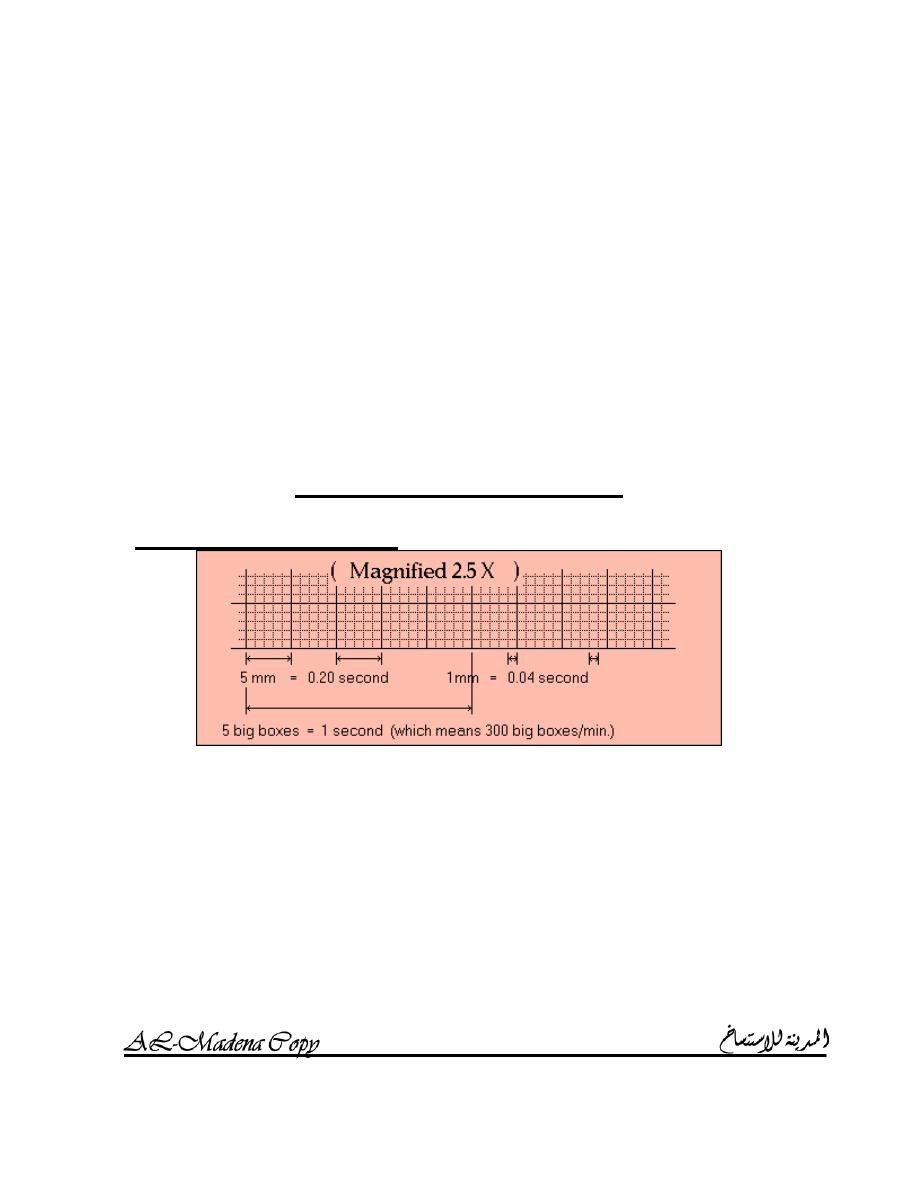
Horizontal measurements:
The horizontal axis on paper represents time.
ECG paper moves through the machine at a constant speed of 25mm /
sec.
A small box of 1mm represents 0.04 sec.
A large box of 5mm (5 small boxes) represents 0.2 sec.
5 large boxes equal 25mm or 1 sec.
I
NTERACTIVE
ECG
MADE SIMPLE
AMMAR SAMEER
7
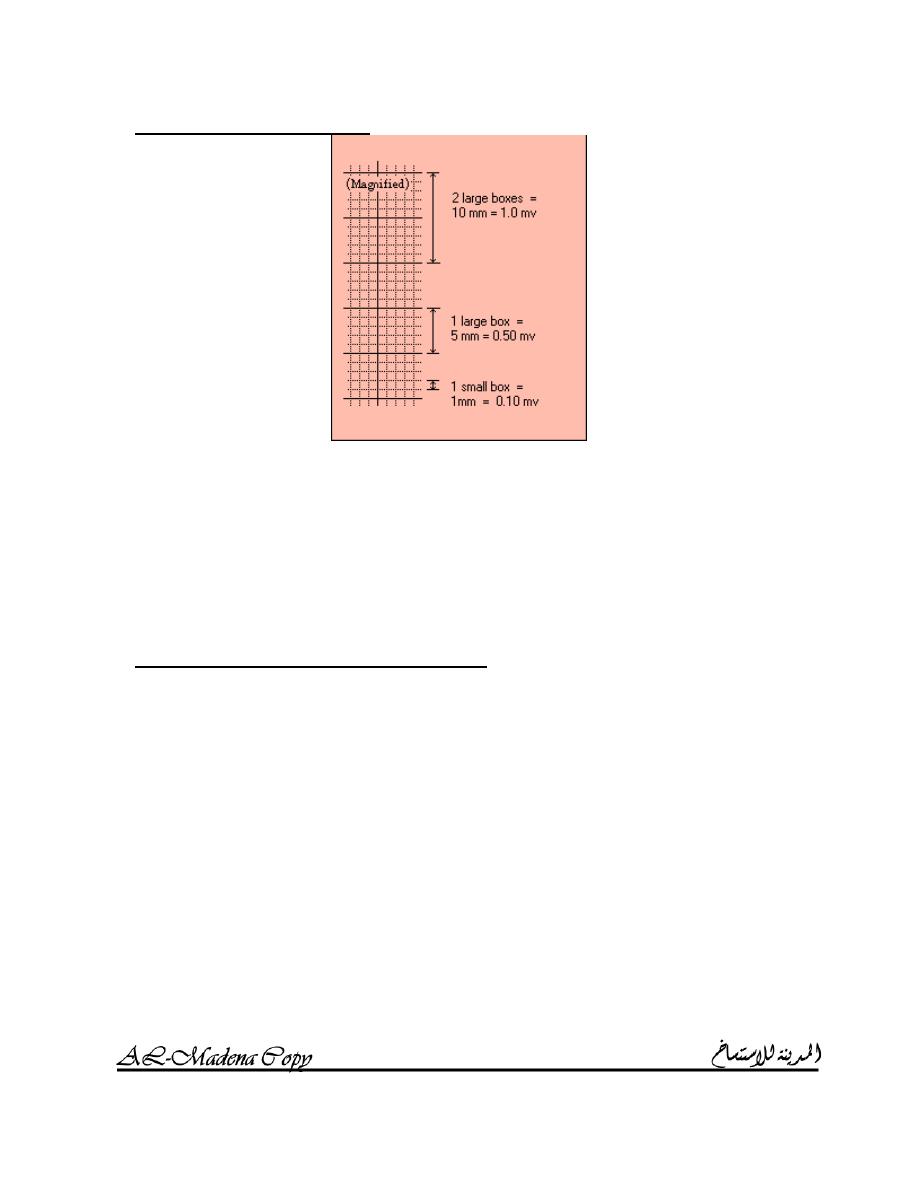
Vertical measurements:
The vertical axis on paper represents voltage.
Each ECG machine must be calibrated so that a 1mv standardization
signal produces a deflection of exactly 10mm; this should be checked
and recorded before every ECG is taken.
A small box of 1mm represents 0.1mv on vertical direction.
A large box of 5mm (5 small boxes) represents 0.5mv.
2 large boxes represent 1mv.
ECG waves, intervals and segments
1. P wave:
a. The normal P wave measure less than 0.11 sec.
b. It is upright except in lead aVR.
c. Abnormalities:
i.
Absent P wave with the presence of fibrillation waves
in Atrial fibrillation (page 15).
ii.
Peaked and tall P wave in Right atrial enlargement
(page 25).
iii.
Notched P wave in Left atrial enlargement (page 26).
iv.
Inverted P wave in lead I plus an upright direction of P
wave in lead aVR means
W
RONG CONNECTION
or
D
EXTROCARDIA
.

I
NTERACTIVE
ECG
MADE SIMPLE
AMMAR SAMEER
8
2. PR interval:
a. The PR interval is measured from the first upward deflection of
the P wave to the first deflection of the QRS complex from the
baseline, whether negative (Q wave) or positive (R wave).
b. The PR interval ranges from 0.12 to 0.2 sec or from 3 to 5 small
boxes.
c. Abnormalities:
i.
Long PR interval is seen in First degree AV block (page
20).
ii.
Short PR interval is seen in WPW syndrome (page 19).
3. PR segment:
4. QRS interval:
a. The QRS interval is measured from the first deflection of the
QRS complex from the baseline, whether negative or positive,
to the eventual return of the QRS complex to the baseline.
b. The QRS interval should be less than 0.10 sec or 2.5 small
boxes.
c. Abnormalities:
i.
Long QRS interval is seen in RBBB (page 29) and
LBBB (page 30).
ii.
High voltage QRS complex is seen in LVH (page 28).
iii.
Low voltage QRS complex is seen in obesity,
pericardial effusion, COPD, heart failure and
hypothyroidism.
5. ST segment:
a. The ST segment runs from the return of the QRS complex to
the baseline to until the first upward or downward deflection of
the T wave.
b. The duration of SR segment is not generally of clinical
significance.
c. The ST segment is an exceedingly important portion of the
ECG because of shifts up or down from the baseline; these
shifts are generally measured at a point 0.08 sec or 2 small
boxes after the end of the QRS complex.
d. Abnormalities:
i.
ST segment elevation:
1. Acute myocardial infarction.
I
NTERACTIVE
ECG
MADE SIMPLE
AMMAR SAMEER
9
2. Ventricular aneurysm.
3.
A
CUTE PERICARDITIS
(concave ST segment
elevation).
ii.
ST segment depression is seen in ischemic heart
disease.
6. T wave:
a. T wave shows the wave of repolarization.
b. T wave has an upright direction except in lead aVR.
c. T wave amplitude is normally less than 2/3 that of R wave.
d. Abnormalities:
i.
Tall, peaked and tented T wave is seen in
H
YPERKALEMIA
.
ii.
T inversion is seen in acute myocardial infarction.
iii.
U wave (broad low amplitude deflection) may be seen
in normal people but prominent U wave and T wave
flattening indicate
H
YPOKALEMIA
.
I
NTERACTIVE
ECG
MADE SIMPLE
AMMAR SAMEER
10
7. QT interval:
a. The QT interval is measured from the beginning of the QRS
complex to the final return of the T wave to the baseline.
b. The QT interval is markedly affected by the heart rate; with
normal heart rates i.e. 60 – 100 beats / minute, QT intervals are
in the range of 0.30 to 0.40 sec.
c. Prolonged QT interval (
T
ORSADES DE
POINTES
(
TWISTING POINTS
)
is a bradycardia with a long
QT interval followed by ventricular tachycardia):
i.
Bradycardia:
1. SA node disease (sick sinus syndrome).
2. Complete heart block.
ii.
Electrolytes disturbance:
1. Hypokalemia.
2. Hypomagnesemia.
3. Hypocalcemia.
iii.
Drugs:
1. Disopyramide and other class Ia antiarrhythmic
drugs.
2. Sotalol, Amiodarone and other class III
antiarrhythmic drugs.
3. Amitriptyline and other tricyclic antidepressants.
4. Chlorpromazine and other phenthiazines.
5. Erythromycin.
H
EART RATE
Regular rhythms:
(Heart rate = 300 / # of large boxes for 1 complete cycle).
(Heart rate = 1500 / # of small boxes for 1 complete cycle).
Irregular rhythms:
count the # of complexes over a period of time, e.g. if you have 4
complexes over 10 large boxes and knowing that 10 large boxes
represent 2 sec, heart rate can be obtained by multiplying 4 by 30 so
we will have 120 complexes per 60 sec.
I
NTERACTIVE
ECG
MADE SIMPLE
AMMAR SAMEER
11
E
LECTRICAL AXIS
The P wave or atrial electrical axis is rarely determined.
The T wave or ventricular depolarization axis is significant in
localizing an ischemic or infracted area of the myocardium.
There is a general correlation between the electrical axis of the QRS
complex and the anatomy of the heart.
Normal electrical axis
The normal axis of the QRS complex is from +105 degrees to -30
degrees.
Greater than +105 degrees constitutes right axis deviation.
Less than -30 degrees constitutes left axis deviation.
R
IGHT AXIS DEVIATION
Right axis deviation is evident when the electrical axis is more than
+105.
It is an indication of right ventricular hypertrophy (RVH); RVH is
caused by:
1. Chronic obstructive pulmonary disease (COPD).
2. Pulmonary emboli.
3. Certain congenital heart diseases.
4. Other disorders which cause severe pulmonary hypertension
and cor pulmonale.
L
EFT AXIS DEVIATION
Left axis deviation is evident when the electrical axis is less than -30
degrees.
Causes:
1. Hypertension.
2. Aortic valvular disease.
3. Ischemic heart disease.
4. Other diseases affecting the left ventricle.
5. Certain defects of intraventricular conduction.
I
NTERACTIVE
ECG
MADE SIMPLE
AMMAR SAMEER
12
Three methods of estimating electrical axis
1. Triaxial method for calculating the axis:
2. Hexaxial method for approximating the axis:
3. Practical method for approximating the axis:
If the QRS complex is not negative in leads I, II, III and aVF
then the electrical axis is within Normal.
Otherwise, examine lead I:
o If the QRS complex is negative in lead I then the axis is
to the right of +90 degrees:
A positive QRS complex in lead aVR confirms the
diagnosis of Right axis deviation.
o If the QRS complex is positive in lead I then right axis
deviation is excluded.
Otherwise, examine lead III:
o If the QRS is negative in lead III then the axis is to the
left of +30 degrees:
If the QRS complex is negative in lead aVF then
the axis is to the left of +0 degrees:
If the QRS is negative in lead II then this is
Left axis deviation.
I
NTERACTIVE
ECG
MADE SIMPLE
AMMAR SAMEER
13
MODULE 2
DIAGNOSIS OF CARDIAC RHYTHMS
S
UPRAVENTRICULAR RHYTHMS
L
OOKING AT
P
WAVES
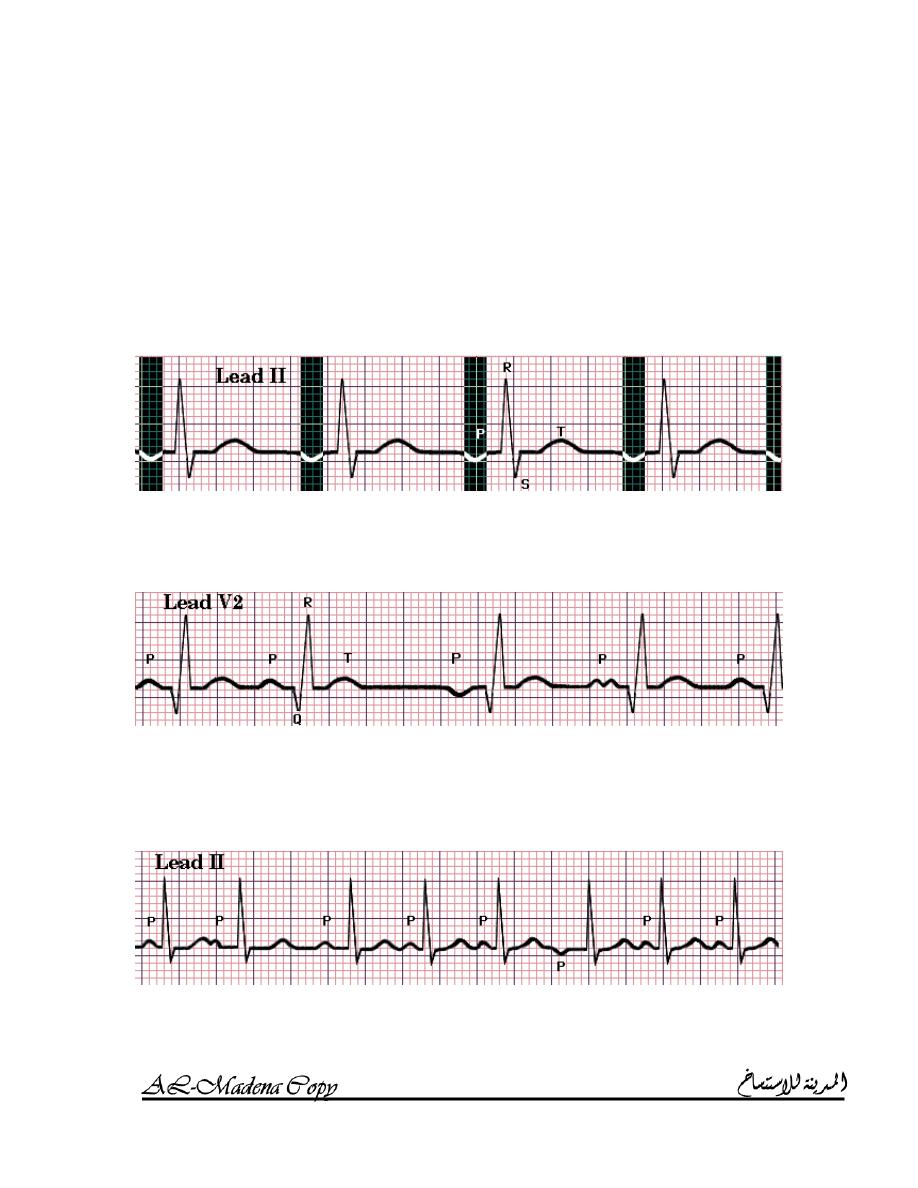
To determine the atrial rhythm, look at the P waves.
Look at the P waves in leads II, aVF and V
1
.
N
ORMAL SINUS RHYTHM
A sinus origin is assumed if the P waves are regular in leads II, aVF
and III; if the heart rate is between 60 and 100 beats / minute, normal
sinus rhythm is present.
S
INUS BRADYCARDIA
Definition: the heart rate is less than 60 beats / minute.
Causes:
o Increased vagal or parasympathetic tone.
I
NTERACTIVE
ECG
MADE SIMPLE
AMMAR SAMEER
14
o Acute myocardial infarction especially diaphragmatic (inferior)
myocardial infarction.
o Sick sinus syndrome.
o Hypothermia.
o Hypothyroidism.
o Cholestatic jaundice.
o Raised intracranial pressure.
o Drugs:
B – blockers.
Digoxin.
Verapamil.
o Sleep.
o Athletes.
S
INUS TACHYCARDIA
Definition: the heart rate is more than 100 beats / minute.
Causes:
o Physiological response to exercise.
o Fever.
o Pain.
o Stress.
o Occult congestive heart failure.
o Anemia.
o Thyrotoxicosis.
o Pheochromocytoma.
o Drugs as B – adrenoceptor agonists (bronchodilators).
S
INUS ARRHYTHMIA
I
NTERACTIVE
ECG
MADE SIMPLE
AMMAR SAMEER
15
Definition: all the P waves are identical and upright in leads II, III and
aVF but they are rhythmically irregular i.e. the longest PP or RR
interval exceeds the shortest such interval by 0.16 sec or four small
boxes (complexes are identical).
Phasic alteration of the heart rate during respiration (the sinus rate
increases during inspiration and decreases during expiration) is a
manifestation of normal autonomic nervous activity. A complete
absence of this variation may be a feature of autonomic neuropathy.
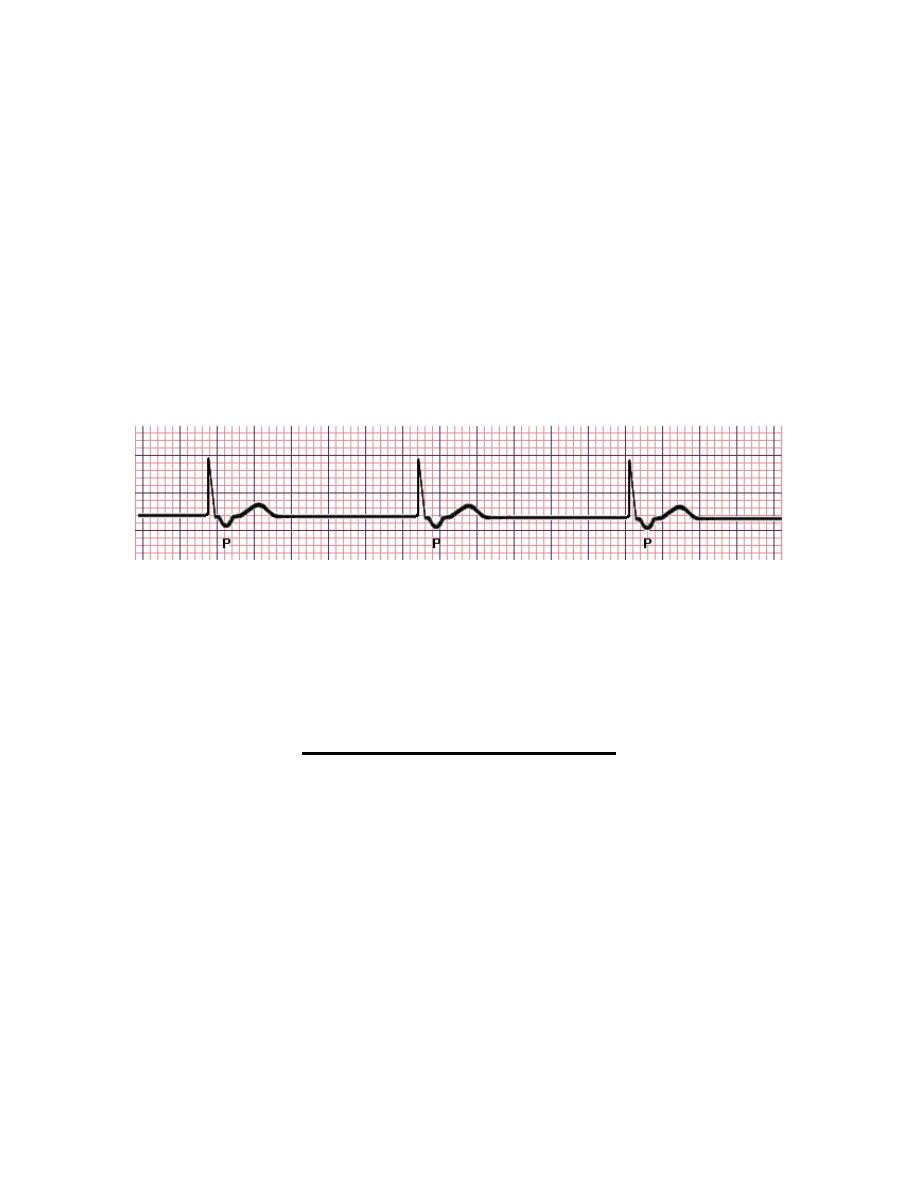
N
ON SINUS ATRIAL
(
CORONARY SINUS
)
RHYTHM
Definition: all P waves are identical and regular but inverted in leads
II, III and aVF.
W
ANDERING ATRIAL PACEMAKER
(WAP)
Definition: the contour or shape of P waves varies from beat to beat in
a single lead, often associated with variation of the PR interval and the
PP, and thus the RR intervals.
M
ULTIFOCAL ATRIAL TACHYCARDIA
(MAT)
Definition: it is like WAP but with increased heart rate to more than
100 beats / minute.
Cause: severe pulmonary disease.
I
NTERACTIVE
ECG
MADE SIMPLE
AMMAR SAMEER
16
P
AROXYSMAL SUPRAVENTRICULAR TACHYCARDIA
(PSVT)
Atrial rate is between 160 and 220 beats / minute.
P waves are regular and often inverted.
QRS complexes are normal or abnormal.
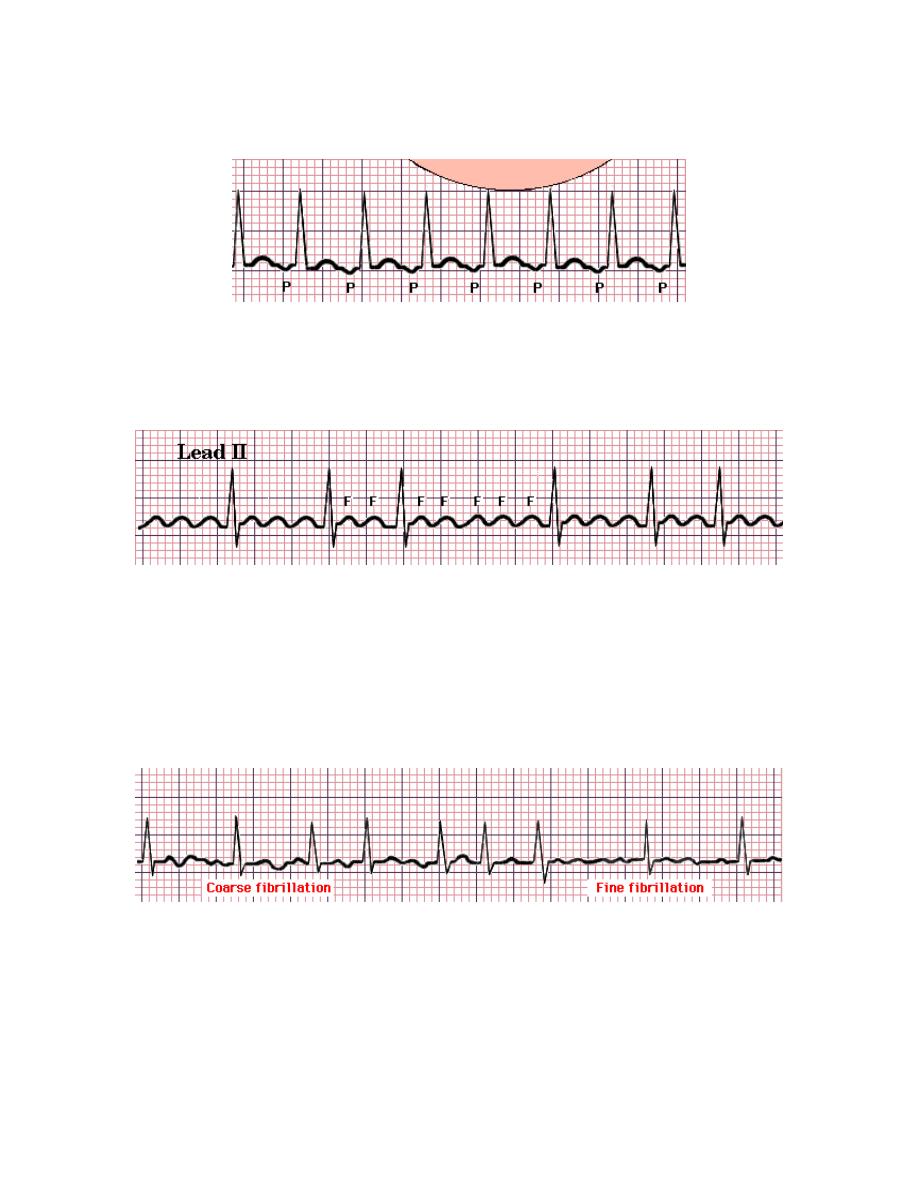
A
TRIAL FLUTTER
The atrial rate is approximately 300 beats / minute.
It is usually associated with 2:1, 3:1 and 4:1 atrioventricular block
(with corresponding heart rates of 150, 100, and 75).
Characteristics:
o Saw – toothed flutter waves.
o Atrioventricular block (see above).
A
TRIAL FIBRILLATION
Causes:
o Coronary artery disease (including acute myocardial infarction).
o Valvular heart disease, especially rheumatic mitral valve
disease.
o Hypertension.
o Sinoatrial disease (sick sinus syndrome).
o Hyperthyroidism.
I
NTERACTIVE
ECG
MADE SIMPLE
AMMAR SAMEER
17
o Alcohol.
o Cardiomyopathy.
o Congenital heart disease.
o Chest infection.
o Pulmonary embolism.
o Pericardial disease.
o Idiopathic (lone AF).
Characteristics:
o P waves are absent.
o Normal but irregular QRS complexes.
o The baseline may show irregular fibrillation waves.
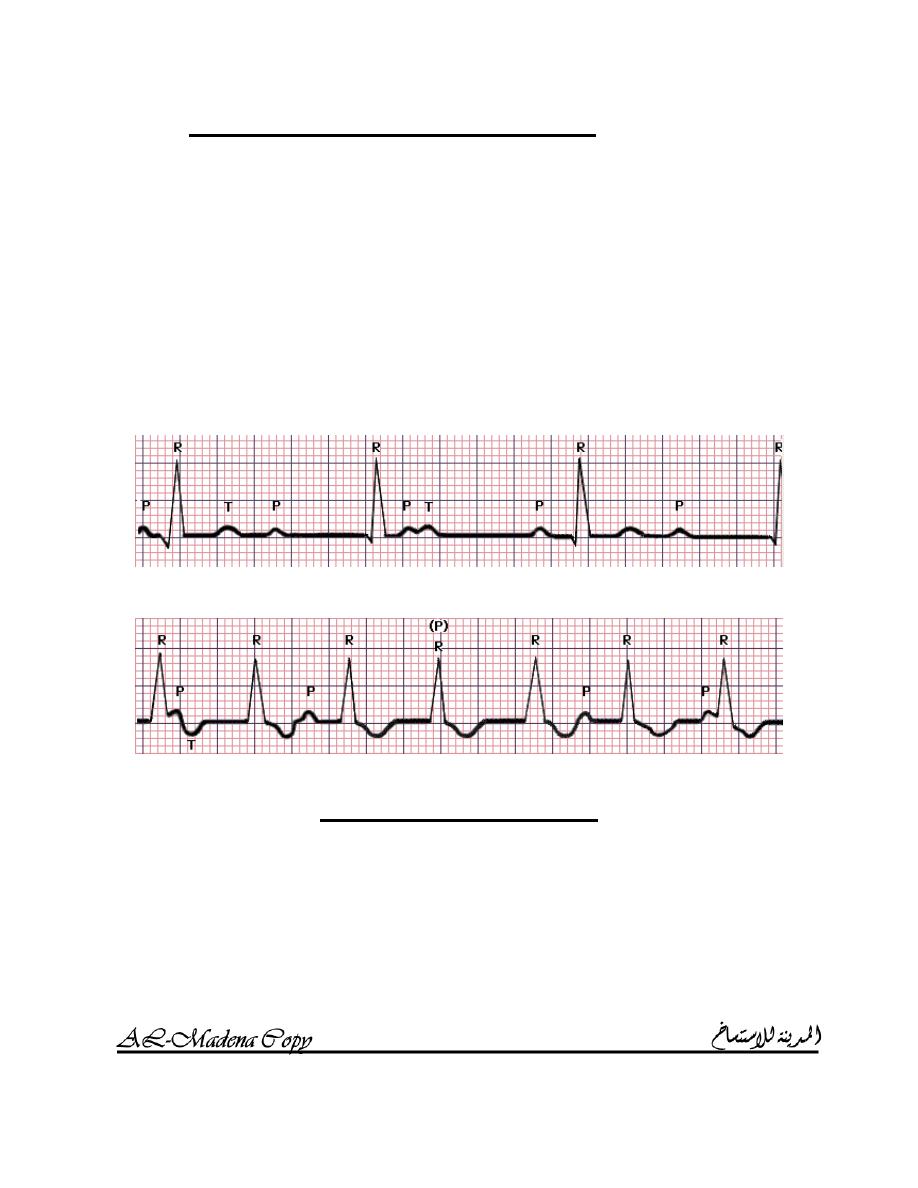
J
UNCTIONAL RHYTHM
Impulses originate in the AV node with antergrade and retrograde
transmission.
P waves, often inverted, may be buried in QRS or follow QRS.
Slow rate.
Narrow QRS complex.
V
ENTRICULAR RHYTHMS
S
UPRAVENTRICULAR VS
V
ENTRICULAR RHYTHM
The major differential consideration concerning ventricular
depolarization is whether the ventricle was activated from a sinoatrial,
atrial or atrioventricular source (all termed Supraventricular) or
whether the ventricle was activated from an automatic cells within the
ventricle (including the Purkingi system) itself.
Supraventricular rhythms tend to be much more stable than
Ventricular rhythms.
Differentiation between Supraventricular and Ventricular rhythms is
made on the basis of the duration (width) of the QRS complex.
A Supraventricular rhythm is characterized by narrow QRS complex
(less than .10 sec or 2.5 small boxes).
I
NTERACTIVE
ECG
MADE SIMPLE
AMMAR SAMEER
18
I
DIOVENTRICULAR RHYTHM
It is an example of ventricular rhythm with wide QRS complex (more
than 0.10 sec).
As the impulse is of ventricular origin, there is absence of normal
upright P wave.
The T wave is opposite in direction to that of the QRS complex.
The heart rate is less than 40 beats / minute.
A
CCELERATED IDIOVENTRICULAR RHYTHM
(AIVR)
It is idioventricular rhythm with heart rate of 40 – 120 beats / minute.
It can resemble, but less dangerous, than ventricular tachycardia.
V
ENTRICULAR TACHYCARDIA
(VT)
Characteristics:
o Wide QRS complex (more than 0.10 sec); QRS complexes are
bizarre in shape.
o Absence of P waves (ventricular origin impulse).
o Heart rate is more than 140 beats / minute.
Causes:
o Acute myocardial infarction.
o Myocarditis.
I
NTERACTIVE
ECG
MADE SIMPLE
AMMAR SAMEER
19
o Cardiomyopathy.
o Chronic ischemic heart disease.
V
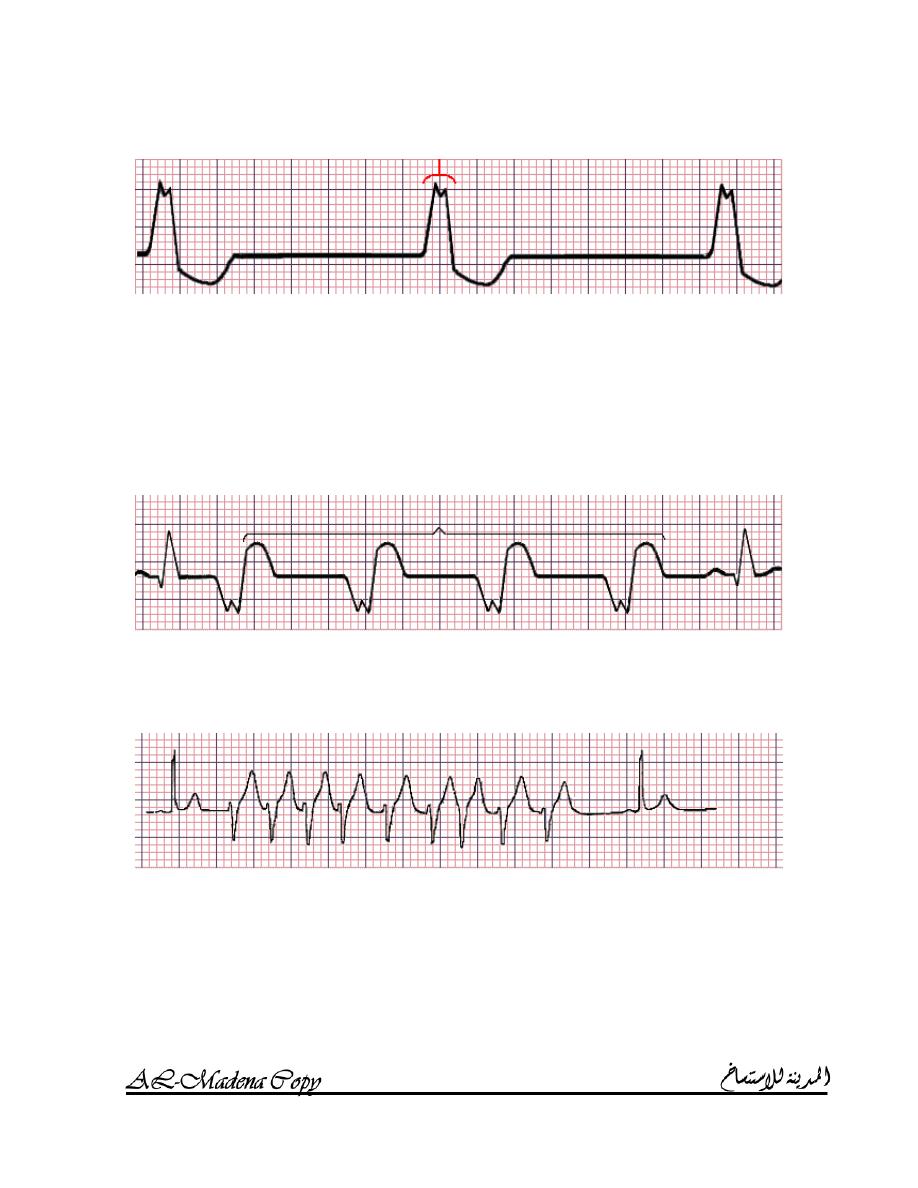
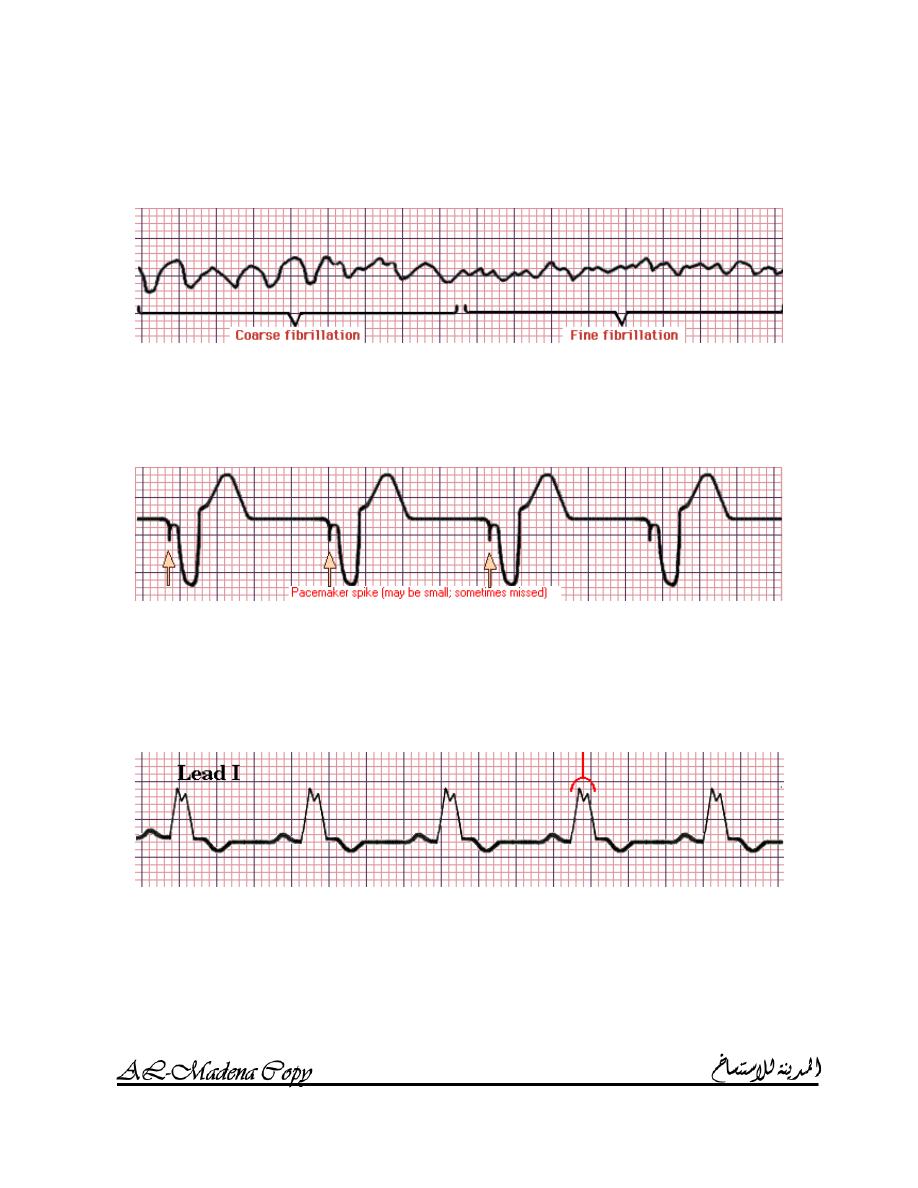
ENTRICULAR FIBRILLATION
(VF)
Characteristics:
o Broad abnormal QRS complexes.
o The heart rate is between 140 – 220 beats / minute.
P
ACER RHYTHM
Pacemaker spikes (transvenous pacemaker produces beats in the right
ventricle).
Wide QRS complexes.
No P waves.
I
NTRAVENTRICULAR CONDUCTION DEFECT
(IVCD)
IVCD, including left and right bundle branch block, is a
Supraventricular rhythm.
IVCD has a wide QRS complex which is characteristic of Ventricular
rhythm, but the impulse is of Supraventricular origin.
Characteristics:
o Wide notched QRS complex (more than 0.10 sec).
I
NTERACTIVE
ECG
MADE SIMPLE
AMMAR SAMEER
20
o The QRS complex is preceded by a P wave with normal PR
interval.
W
OLFF
–
P
ARKINSON
–
W
HITE
(P
REEXCITATON
)
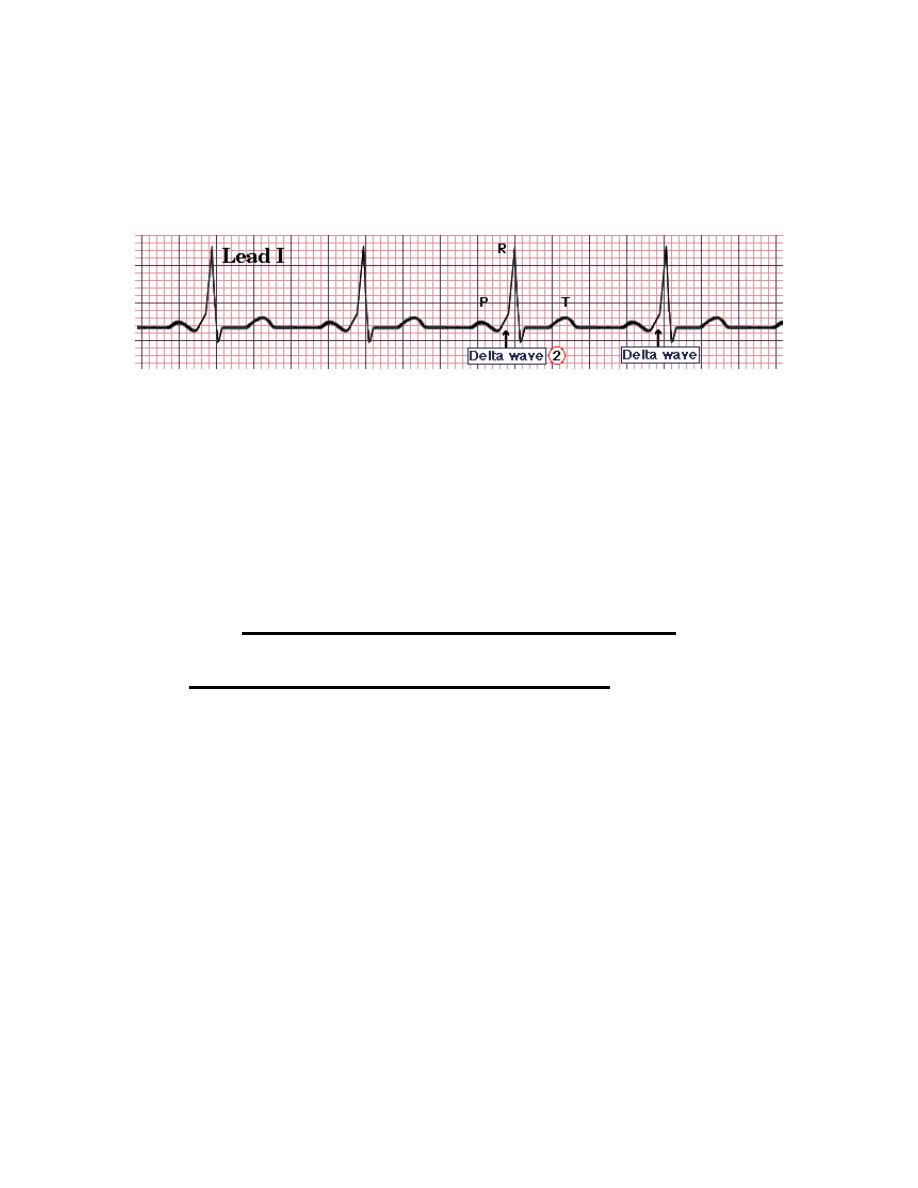
SYNDROME
(WPW
SYNDROME
)
(WPW syndrome is a Supraventricular rhythm which has a wide QRS
complex due to preexcitation.
Impulses originate at SA node and preexcite peripheral conduction
system and ventricular muscle via bundle of Kent without delay at AV
node, thus producing the early slurred upstroke (delta wave) of the
QRS complex.
P wave is immediately followed by short delta wave, producing
slurred upstroke on wide QRS with short or no PR interval.
A
TRIOVENTRICULAR CONDUCTION
P waves ALWAYS related to QRS complex
1. P
waves always precede QRS complexes by a fixed normal PR
interval
(N
ORMAL SINUS RHYTHM
).
2. P waves precede, follow or are buried in QRS complexes but
PR interval is short (<0.12 sec):
N
ON ATRIA
(
CORONARY SINUS
)
RHYTHM OR
J
UNCTIONAL RHYTHM
.
W
OLFF
–
P
ARKINSON
–
W
HITE
(P
REEXCITATON
)
SYNDROME
(WPW
SYNDROME
).
3. P waves always precede QRS complexes but the PR intervals
are variable
(WAP
OR
MAT).
I
NTERACTIVE
ECG
MADE SIMPLE
AMMAR SAMEER
21
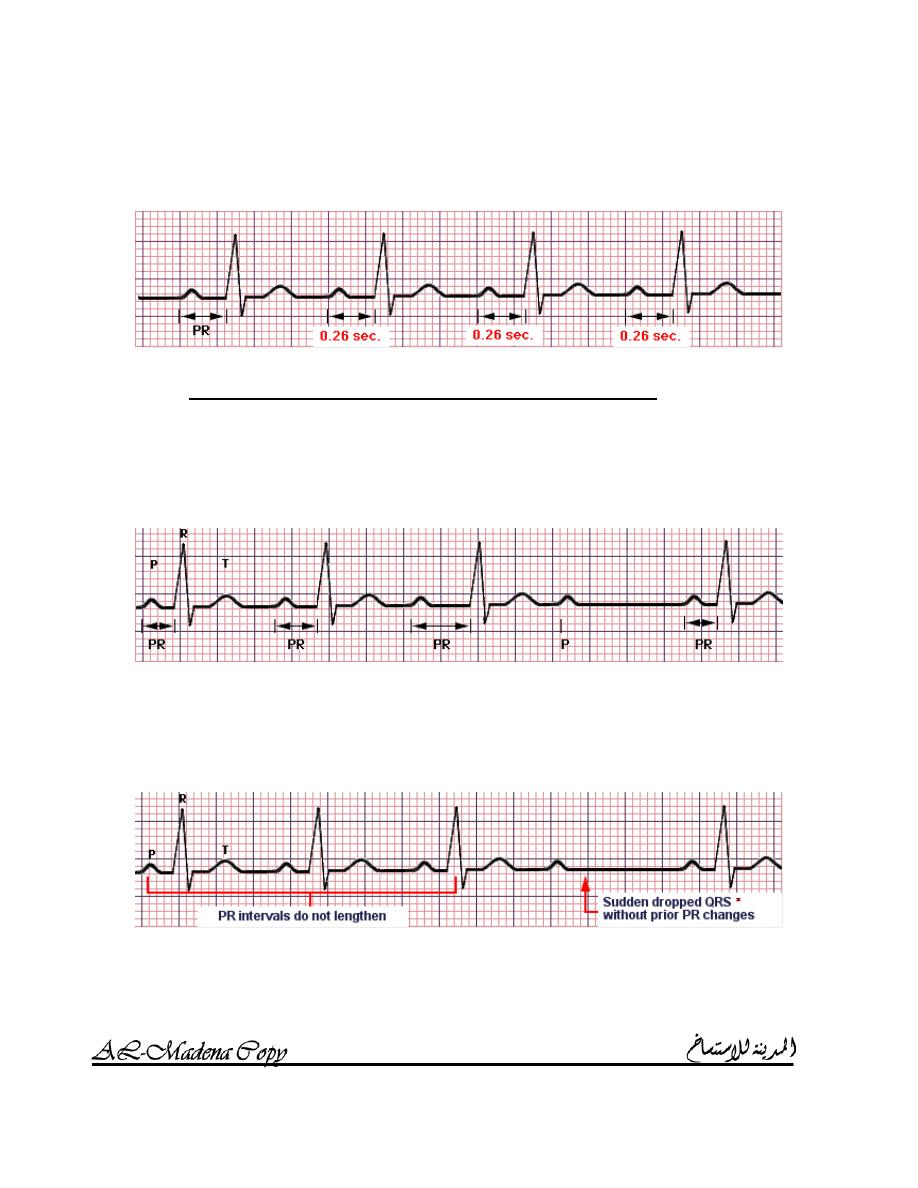
4. P waves always precede QRS complexes but PR interval is
fixed but prolonged (> 0.20 sec)
(F
IRST DEGREE
AV
BLOCK
).
P waves SOMETIMES related to QRS complex
1. Progressive lengthening of successive PR intervals culmination
into a dropped beat (
S
ECOND DEGREE
AV
BLOCK
:
M
OBITZ I
(W
ENCKEBACH
)).
It is due to impaired
conduction proximal to bundle of His.
2. Sudden dropped QRS without prior PR lengthening (
S
ECOND
DEGREE
AV
BLOCK
:
M
OBITZ II
(
NON
–
W
ENCKEBACH
)).
It is due to impaired conduction distal to
bundle of His.
I
NTERACTIVE
ECG
MADE SIMPLE
AMMAR SAMEER
22
P waves NEVER related to QRS complex
1. QRS
rate slower than P rate (
T
HIRD DEGREE
(
COMPLETE
)
AV
BLOCK
)).
Causes:
o Congenital.
o Acquired:
Idiopathic fibrosis.
Myocardial infarction / ischemia.
Inflammation (aortic root abscess in infective
endocarditis, Sarcoidosis and Chagas disease).
Trauma (cardiac surgery).
Drugs (Digoxin and B – blockers).
2. QRS rate faster than P rate (
AV
DISSOCIATION
)
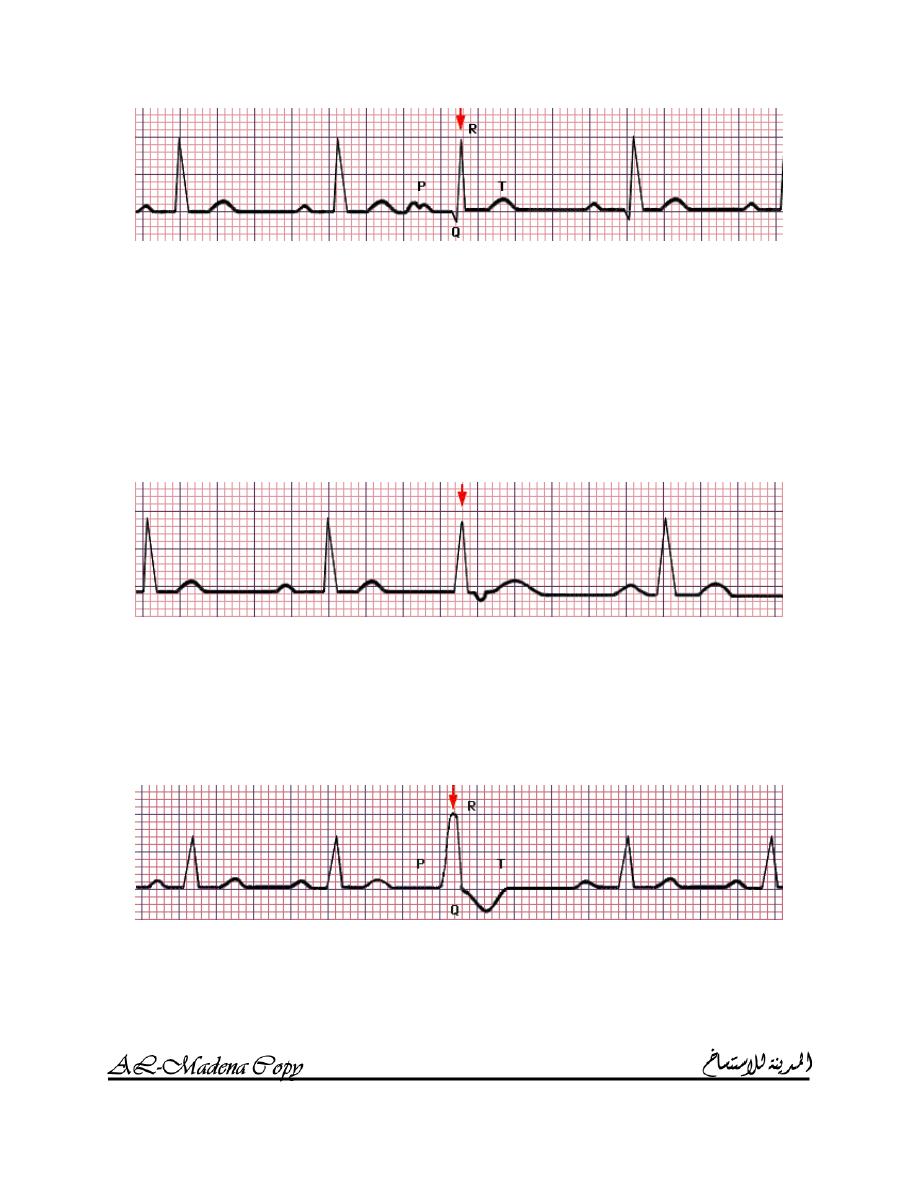
U
NUSUAL COMPLEXES
1. P
REMATURE CONTRACTIONS
:
They occur early, before next sinus beat is expected.
a. Atrial:
I
NTERACTIVE
ECG
MADE SIMPLE
AMMAR SAMEER
23
o An atrial premature contraction (APC) occurs early, before
next sinus beat is expected.
o P wave often has contour slightly different from sinus beats.
o PR interval is often long.
o QRS complex is narrow (> 0.10 sec) and similar to normal
beats except for timing.
b. Junctional:
o A junctional premature contraction (JPC) occurs early,
before next sinus beat is expected.
o QRS complex is narrow (> 0.10 sec).
o P wave is often inverted. It may precede, be incorporated in
or follow QRS complex.
c. Ventricular:
o A ventricular premature contraction (VPC) occurs early,
before next sinus beat is expected.
o QRS complex is wider than normal and is distorted in shape.
o Usually, there is no P wave
I
NTERACTIVE
ECG
MADE SIMPLE
AMMAR SAMEER
24
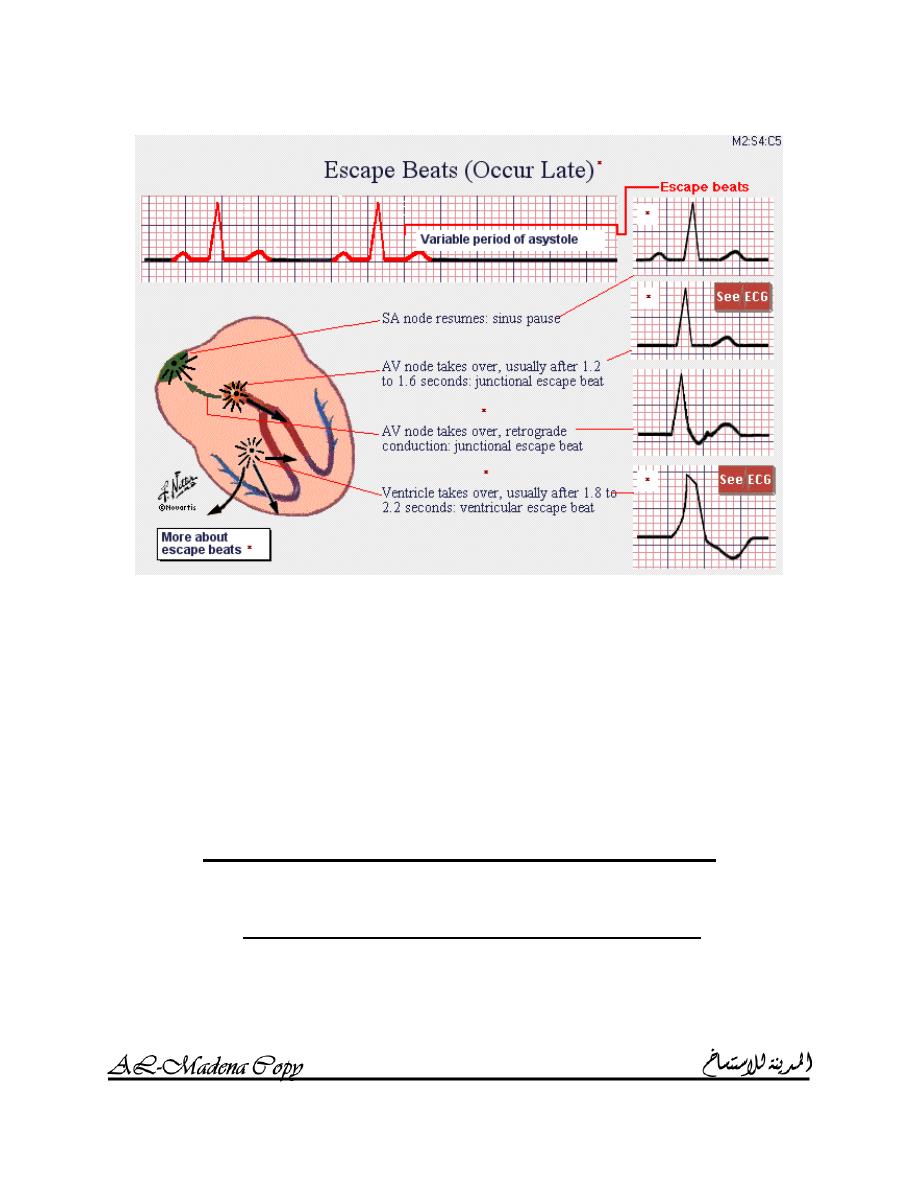
2. E
SCAPE BEATS
:
They occur late after variable period of asystole.
a. Sinus pause: the SA node resumes.
b. Junctional escape beat (JEB): AV node takes over.
c. Ventricular escape beat (VEB): ventricle takes over; wide slow
QRS complexes with a contour quite different from that of
normal sinus beats.
A
SSESSMENT OF CARDIAC ARRHYTHMIAS
Cardiac arrhythmias are dangerous for several reasons:
o The rhythm is too slow or potentially too slow:
Young athletes (a heart rate in the 40s is not only safe but
is a sign of excellent physical conditioning, since it
indicates a large stroke volume and a consequently a
slow heart rate).
I
NTERACTIVE
ECG
MADE SIMPLE
AMMAR SAMEER
25
Elderly or those with extensive myocardial infarction
(stroke volume can’t be increased and cardiac output can
fall as result of slow heart rate).
A heart rate below 50 beats / minute, except in young
people or athletes, is a cause for concern. Such slow
ventricular rates might occur with severe sinus
bradycardia, slow junctional rhythms and complete heart
block with ventricular escape rhythm (VER).
o the rhythm is too fast or potentially too fast:
Babies and children routinely have very high heart rates.
Any tachyarrhythmia is dangerous if it compromises
cardiac output to produce hypotension or cerebral
symptoms such as dizziness or fainting.
Any tachyarrhythmia is dangerous when associated with
chest pain or other signs of myocardial ischemia such as
ST depression or ventricular irritability.
A heart rate above 150 beats / minute, except in young
persons, is a cause for concern.
Atrial flutter (the atrial rate is usually around 300 /
minute; atrial flutter with 3:1 AV block and a ventricular
rate of 100 beats / minute is a potentially dangerous
arrhythmia if the AV block should decrease to 2:1 or 1:1,
in which case the ventricular rate would increase to 150
or even 300 beats / minute).
The same above concern applies to atrial fibrillation (AF)
or PAT with some degree of AV block.
o there is serious ventricular irritability:
In most cases, sudden cardiac death is caused by
ventricular fibrillation (VF) and some ventricular
arrhythmias may be harbingers of VF. These include
ventricular tachycardia (VT), two or three VPCs in a row
(couplets or triplets) and multifocal VPCs (R on T
VPCs).
Ventricular arrhythmias are most feared when associated
with major symptoms (hypotension and syncope) or
when they occur in the setting of acute ischemic heart
disease (myocardial infarction or unstable angina) or
decompensated congestive heart failure.
I
NTERACTIVE
ECG
MADE SIMPLE
AMMAR SAMEER
26
MODULE 3
CHAMBER ENLARGEMENT &
INTERVENTRICULAR CONDUCTION
DEFECTS
R
IGHT
&
LEFT ATRIAL ENLAREMENT
R
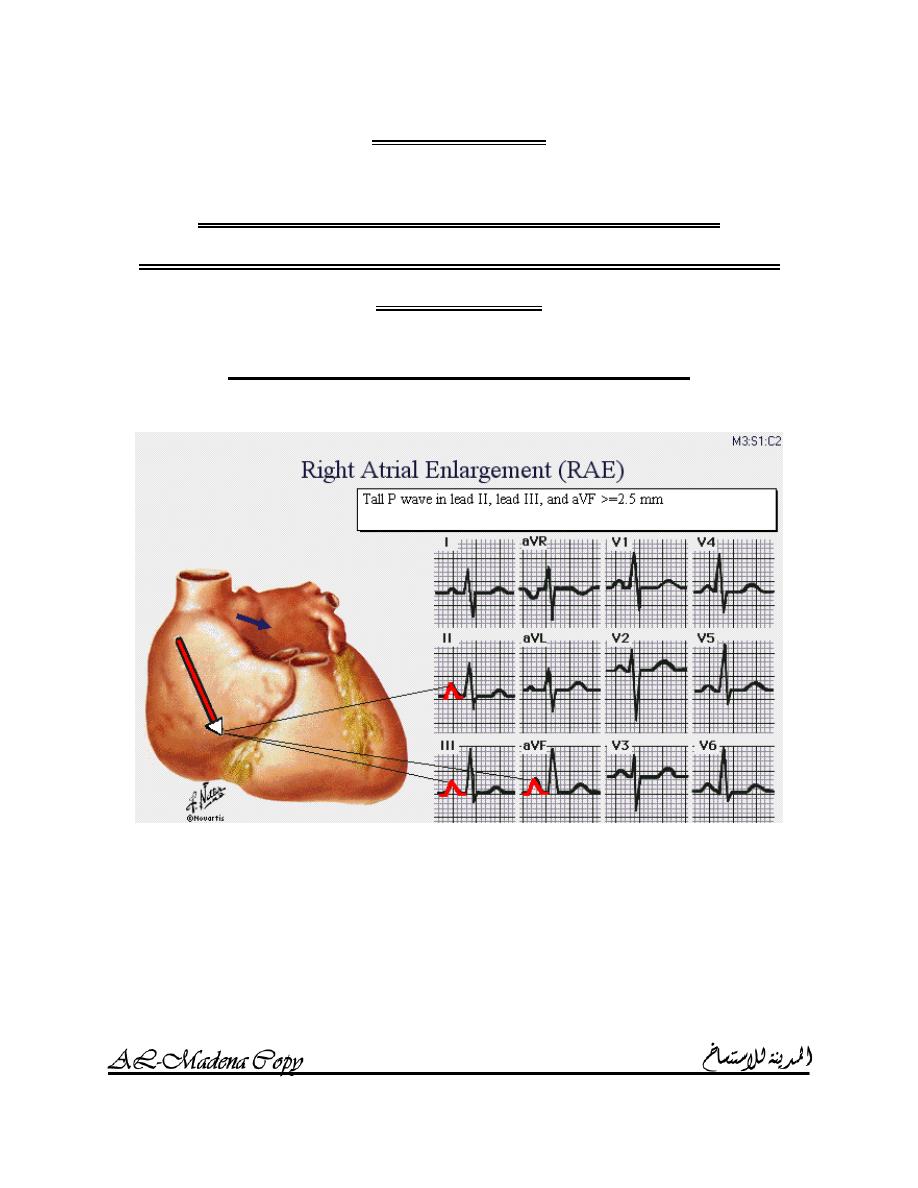
IGHT ATRIAL ENLARGEMENT
The P wave is characteristically tall and peaked particularly in leads
II, III and aVF; P wave amplitude is greater than or equal to 2.5 mm.
Causes (pressure or volume overload in the right atrium):
o Tricuspid valve disease (relatively rare).
o Conditions causing pulmonary hypertension:
COPD.
Pulmonary emboli.
Mitral valve stenosis or incompetence.
I
NTERACTIVE
ECG
MADE SIMPLE
AMMAR SAMEER
27
Since RAE is so frequently caused by pulmonary hypertension, the
characteristic tall and peaked P wave associated with RAE is often
termed “P pulmonale”.
L
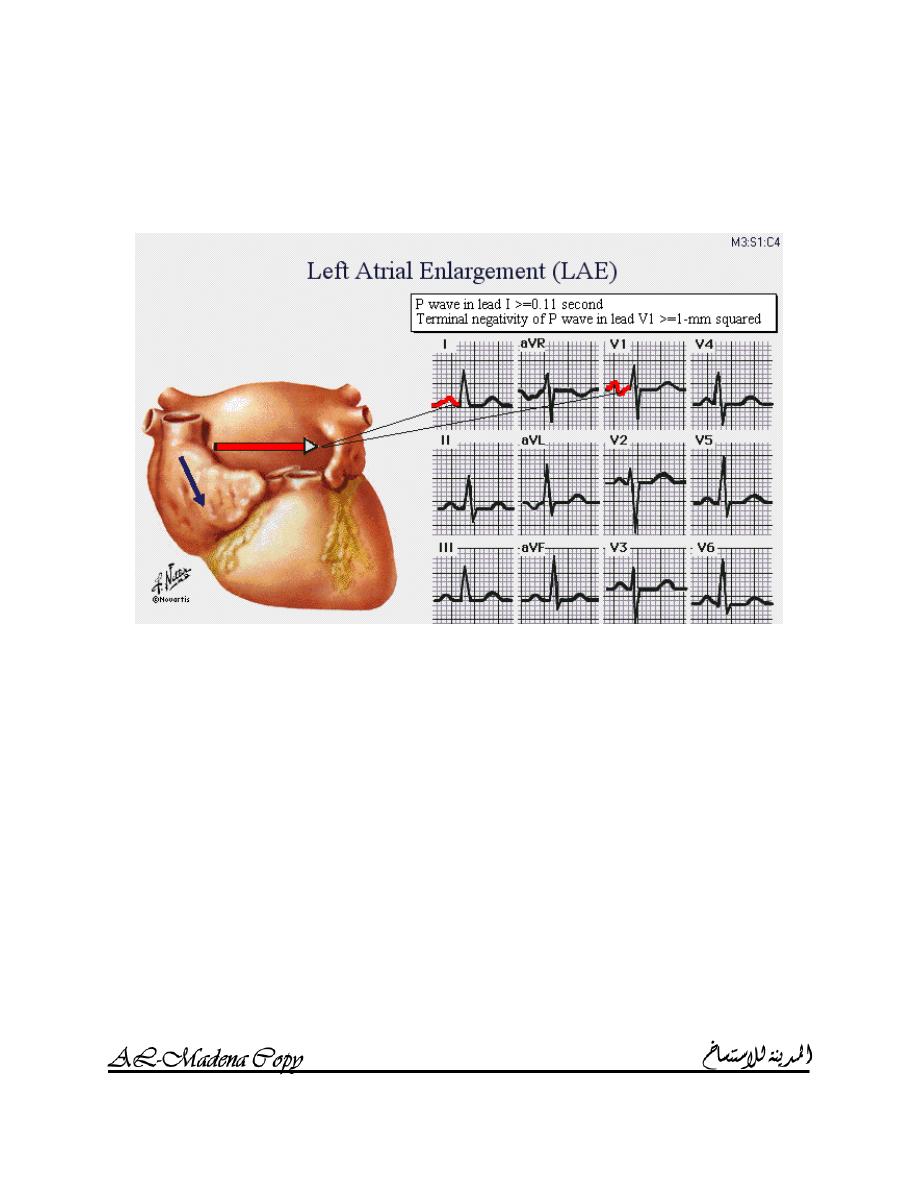
EFT ATRIAL ENLARGEMENT
A wide P wave in lead I (>= 0.11 sec).
Terminal negativity of P wave in lead V
1
>= 1mm
2
.
A notch or double hump in the P wave in any lead with two peaks >
0.04 sec apart.
Causes:
o Mitral valve stenosis or incompetence.
o Systemic hypertension.
o Aortic valve disease.
o Hypertrophy cardiomyopathy.
o Left ventricular failure.
Since LAE is commonly the result of mitral valve stenosis or
incompetence, the broad notched P wave of LAE is often termed “P
mitrale”.
I
NTERACTIVE
ECG
MADE SIMPLE
AMMAR SAMEER
28
R
IGHT
&
LEFT VENTRICULAR HYPERTROPHY
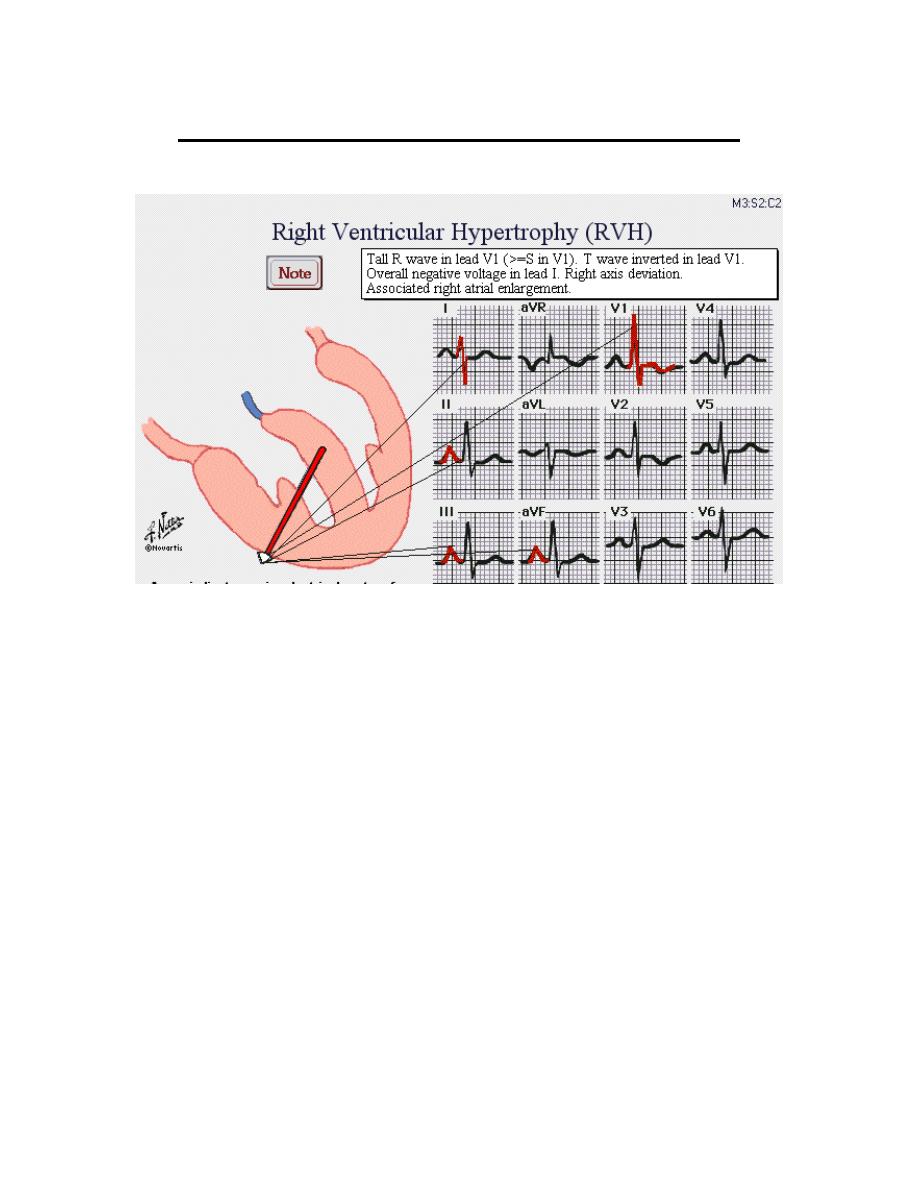
R
IGHT VENTRICULAR HYPERTROPHY
(RVH)
Criteria:
o Tall R wave in V
1
(>= S wave in V
1
).
o T wave is inverted in V
1
and sometimes in V
2
and V
3
.
o Overall negative voltage in lead I.
o Right axis deviation.
o Associated right atrial enlargement.
Differential diagnosis of tall R wave in V
1
:
o RVH.
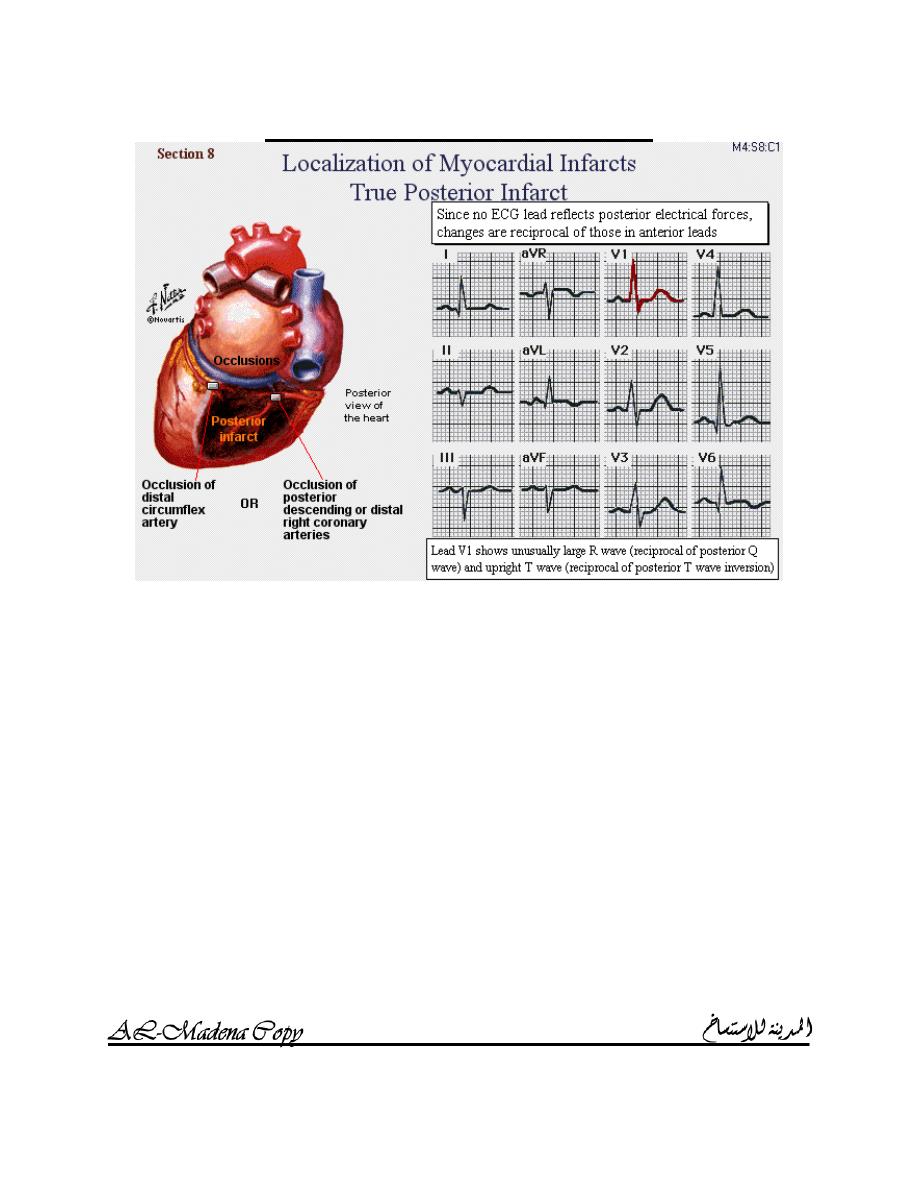
o Posterior myocardial infarction:
Upright T wave in V
1
.
It is generally accompanied by diaphragmatic myocardial
infarction (Q waves or T inversions or both in leads II, III
and aVF).
o Counter clock – wise rotation of the heart.
Causes (volume or pressure overload of the right ventricle):
o Abnormalities of the pulmonary valve.
o Conditions that cause pulmonary hypertension.
o ASD.
o VSD.
o Tricuspid regurgitation.
I
NTERACTIVE
ECG
MADE SIMPLE
AMMAR SAMEER
29
o Tricuspid stenosis is not a cause.
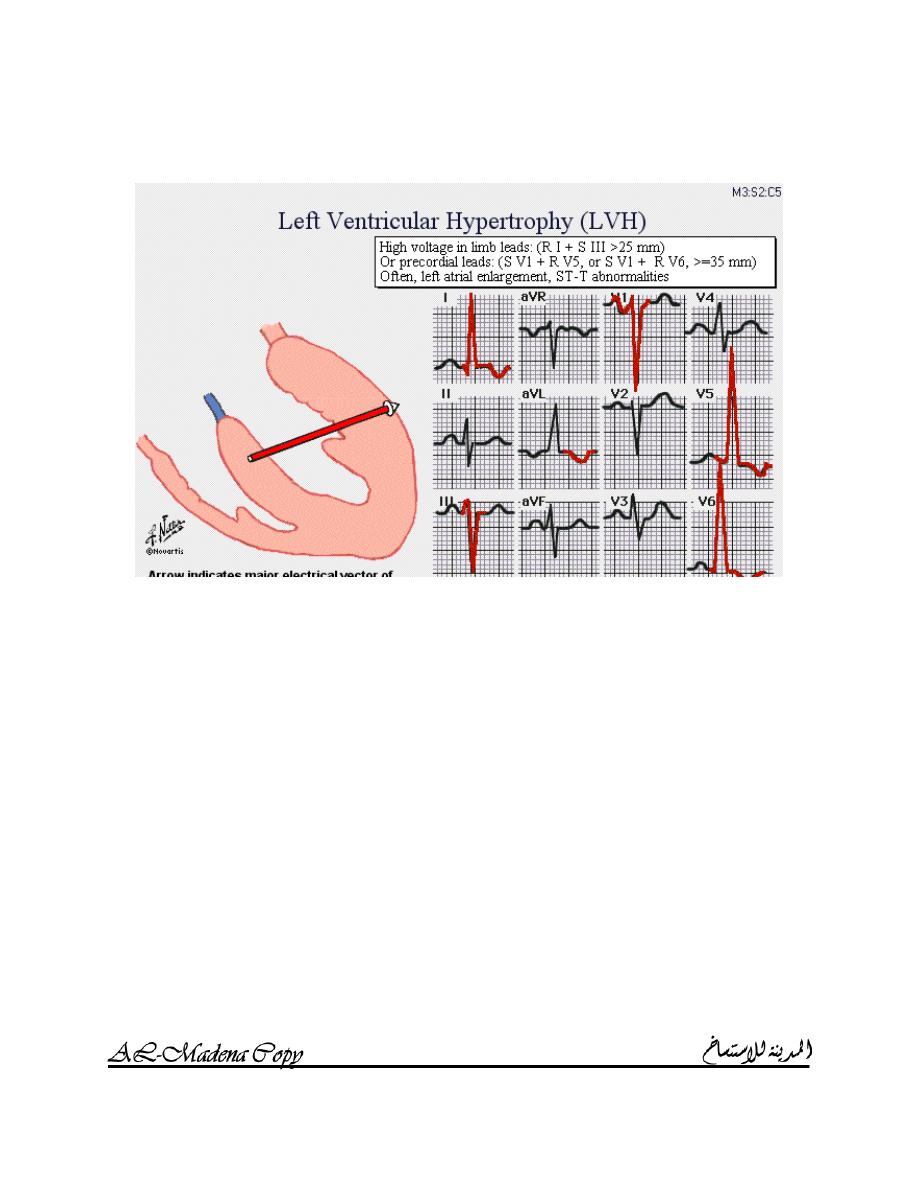
L
EFT VENTRICULAR HYPERTROPHY
(LVH)
Criteria:
o R I + S III > 25mm.
o S V
1
+ R V
5
or S V
1
+ R V
6
> 35mm.
o Left atrial enlargement.
o ST – T abnormalities.
o R aVL > 11mm.
“Possible LVH” is diagnosed if any of the first three criteria is
present; “Probable LVH” is diagnosed if two criteria are present;
“Definite LVH” is diagnosed if three criteria are present.
Causes (volume or pressure overload of the left ventricle):
o Systemic arterial hypertension.
o Aortic valve stenosis or incompetence.
o Mitral valve incompetence.
I
NTERACTIVE
ECG
MADE SIMPLE
AMMAR SAMEER
30
R
IGHT
&
LEFT BUNDLE BRANCH BLOCK
R
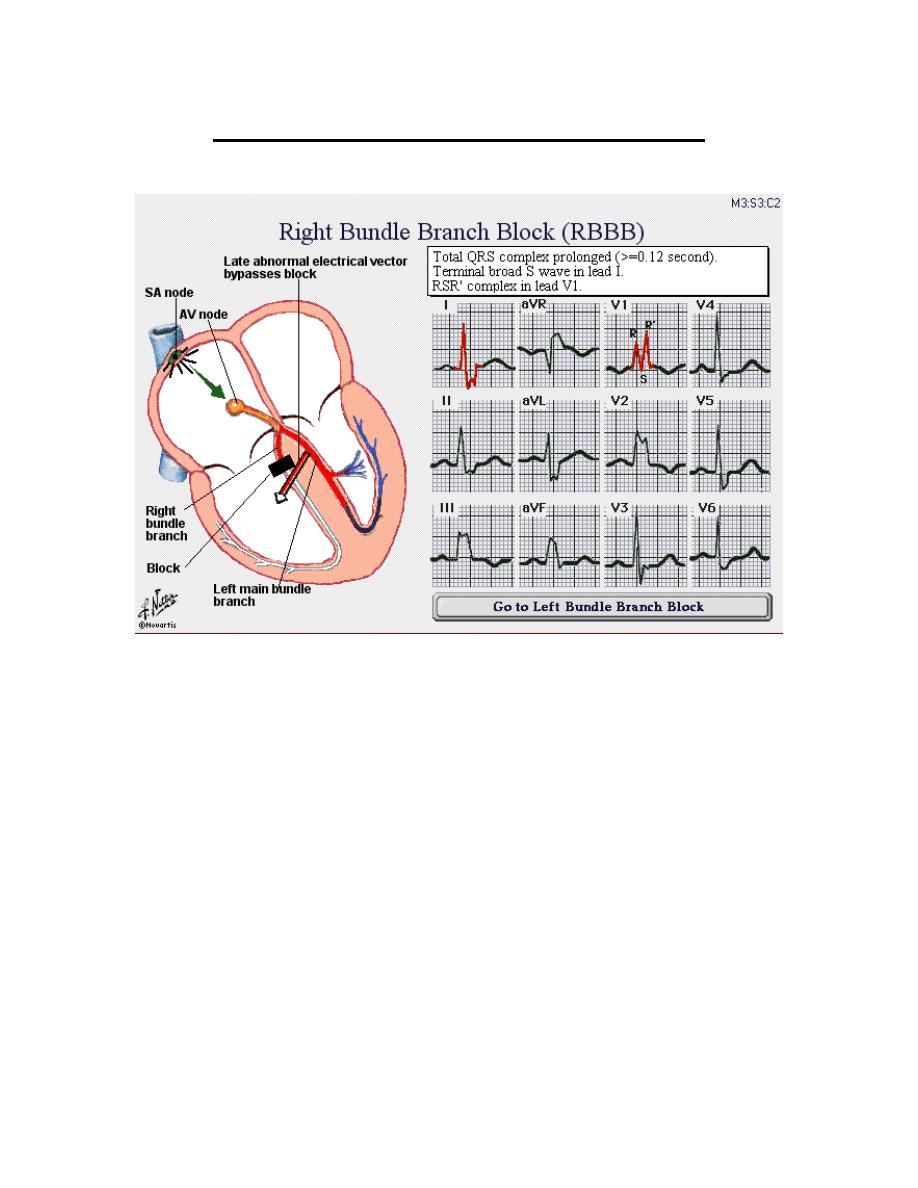
IGHT BUNDLE BRANCH BLOCK
(RBBB)
If the right bundle is blocked, conduction must proceed down the left
bundle and the right ventricle is depolarized by forces coming from
the left ventricle, traveling through the myocardial cells of the
interventricular septum, and then reaching the right ventricle;
consequently, depolarization of the right ventricle is delayed.
Criteria:
o QRS complex is prolonged (>= 0.12 sec).
o Terminal broad S wave in lead I and in other leads located over
the left precordium such as V
5
and V
6
.
o Terminal broad R wave in lead aVR.
o RSR complex in lead V
1
.
Causes:
o Idiopathic degenerative conduction system disease.
o Ischemic heart disease in the anterior septum.
o RVH.
o Congenital heart disease e.g. ASD.
RSR pattern and QRS complex duration from 0.10 to 0.11 sec is
designated as “incomplete” or “borderline” RBBB.
I
NTERACTIVE
ECG
MADE SIMPLE
AMMAR SAMEER
31
If RBBB is caused by anteroseptal infarction, the initial septal forces
disappear, so that R wave is absent and the complex in lead V
1
may be
simply an early Q wave and a late R wave; this produces a broad QRS
complex that has two notches and looks something like the letter “M”.
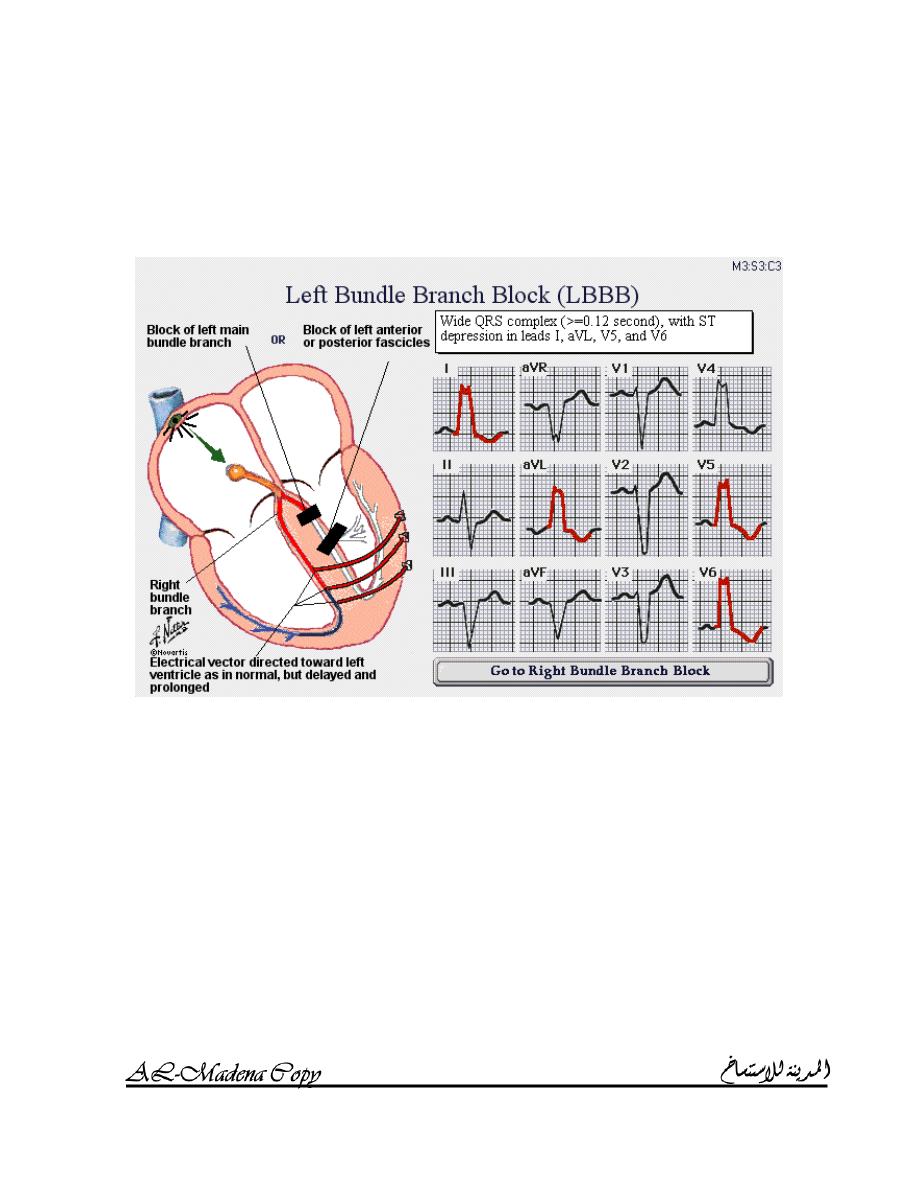
L
EFT BUNDLE BRANCH BLOCK
(LBBB)
The consequences of complete LBBB are similar but opposite to those
of RBBB.
Criteria:
o Wide QRS complex (>= 0.12 sec).
o Notches in the QRS complex.
o Either deep S waves in leads V
1
, V
2
and V
3
or tall R waves in
leads aVL, I, V
5
and V
6
.
o Left axis deviation.
o Very small R waves in leads V
1
, V
2
and V
3
; sometimes, they
are so small that QRS looks like a QS complex and anterior or
anteroseptal myocardial infarction may be erroneously
diagnosed.
o The small septal Q wave that is normally seen in leads I, aVL,
V
5
and V
6
disappears.
I
NTERACTIVE
ECG
MADE SIMPLE
AMMAR SAMEER
32
o Pronounce and often bizarre ST segment and T wave
abnormalities (ST depressions and T inversions in leads I, aVL,
V
5
and V
6
).
Causes (widespread myocardial diseases):
o Idiopathic degenerative conduction system disease.
o Ischemic heart disease.
o Conditions that produce major LVH:
Systemic arterial hypertension.
Aortic valve stenosis or incompetence.
Mitral valve incompetence.
o Cardiomyopathy.
L
EFT ANTERIOR
/
POSTERIOR FASCICULAR BLOCK
The left bundle branch divides into two major divisions: the left
anterior fascicle and the left posterior fascicle.
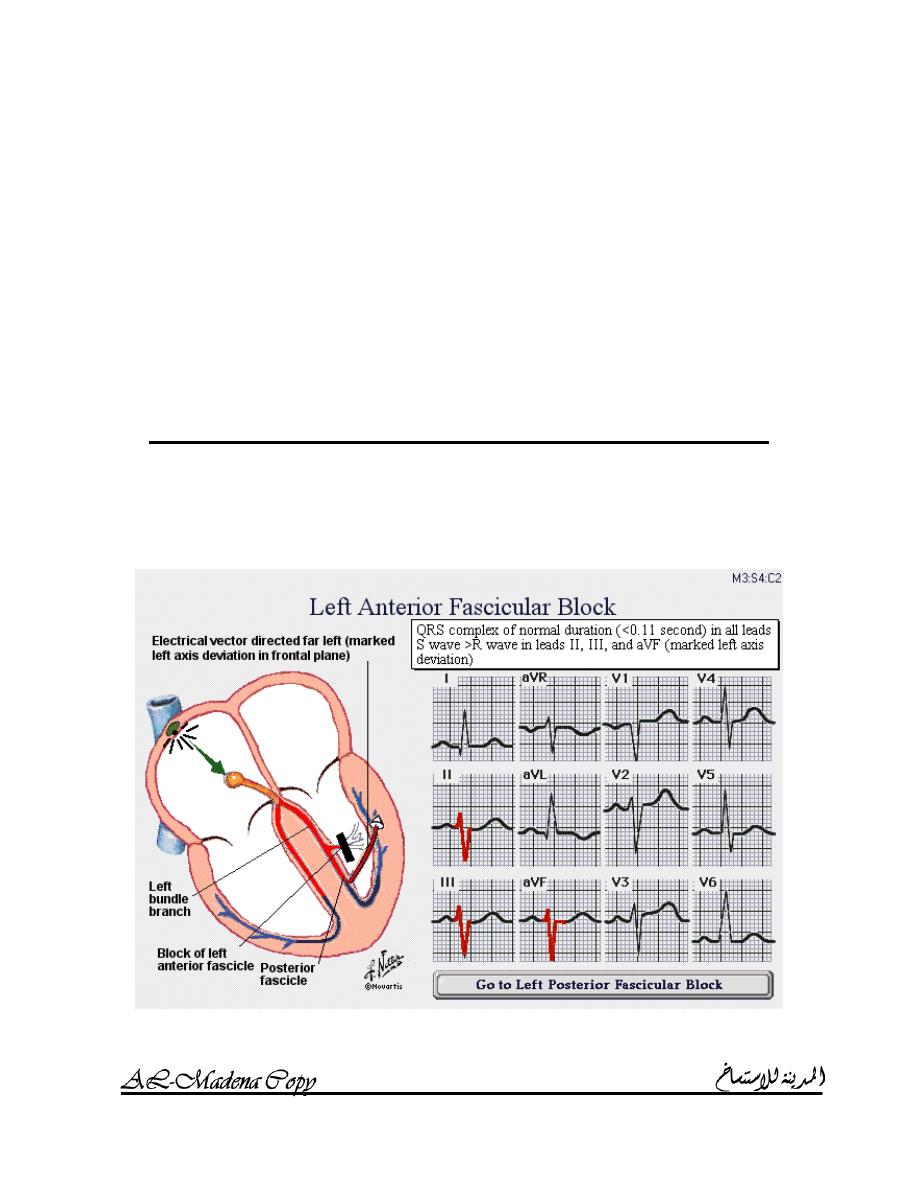
L
EFT ANTERIOR FASCICULAR BLOCK
It is relatively common; it is usually termed “Left anterior hemiblock”
(LAH).
I
NTERACTIVE
ECG
MADE SIMPLE
AMMAR SAMEER
33
Criteria:
o QRS complex is of normal duration (< 0.11 sec) in all leads.
o S wave > R wave in leads II, III and aVF (marked left axis
deviation).
Causes:
o Degenerative conduction system disease.
o Ischemic heart disease.
Unless it occurs in the context of acute myocardial infarction, it is
usually benign and is only rarely a precursor of complete LBBB in the
short term.
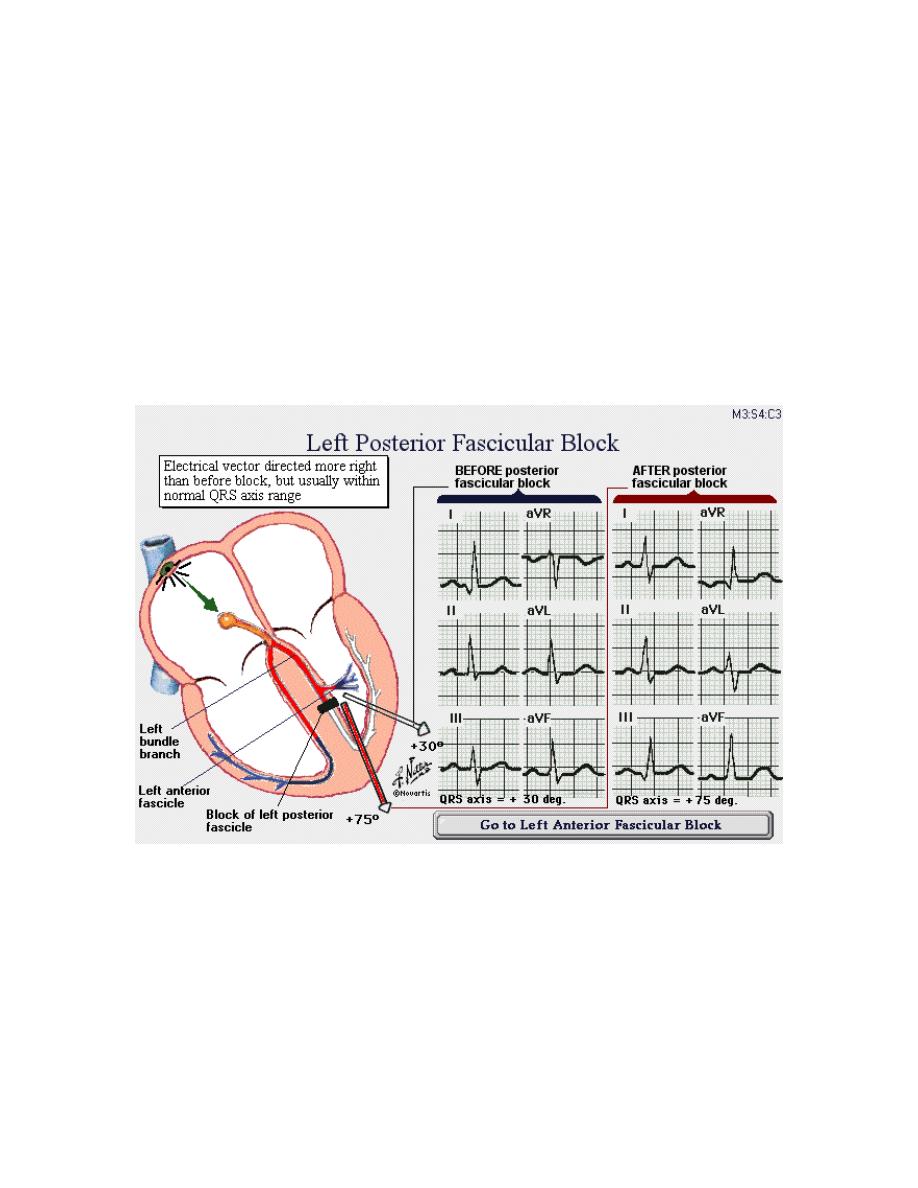
L
EFT POSTERIOR FASCICULAR BLOCK
It is often termed “Left posterior hemiblock” (LPH).
LPH is more difficult to diagnose than LAH, since the rightward shift
of the QRS axis is often not very striking and the final axis often
remains within the normal range.
Causes:
o Degenerative conduction system disease.
o Ischemic heart disease.
Unless it occurs in the context of acute myocardial infarction, it is
usually benign.
I
NTERACTIVE
ECG
MADE SIMPLE
AMMAR SAMEER
34
Abnormalities of conduction
The left bundle branch has two major divisions; the right bundle
branch provides a third pathway for AV conduction; the concept of
three fascicles is now commonly used in describing AV conduction:
1. Abnormalities of conduction in one fascicle (LAH, LPH and
RBBB).
2. Abnormalities of conduction in two fascicles (LAH or LPH plus
RBBB) or ((LAH plus LPH) or LBBB); it is frequently referred to
as
“
BIFASCICULAR BLOCK
”
.
3. Abnormalities of conduction in all three fascicles (LAH plus
RBBB plus prolonged PR interval > 0.20 sec (first degree AV
block)) or (LBBB plus PR interval > 0.20 sec (first degree AV
block)); it is frequently referred to as
“
TRIFASCICULAR
BLOCK
”
.
I
NTRAVENTRICULAR CONDUCTION DEFECTS
(IVCD)
QRS complex with a duration of >= 0.10 sec but without a specific
features of either RBBB or LBBB.
I
NTERACTIVE
ECG
MADE SIMPLE
AMMAR SAMEER
35
MODULE 4
MYOCARDIAL INFARCTION &
ISCHEMIA
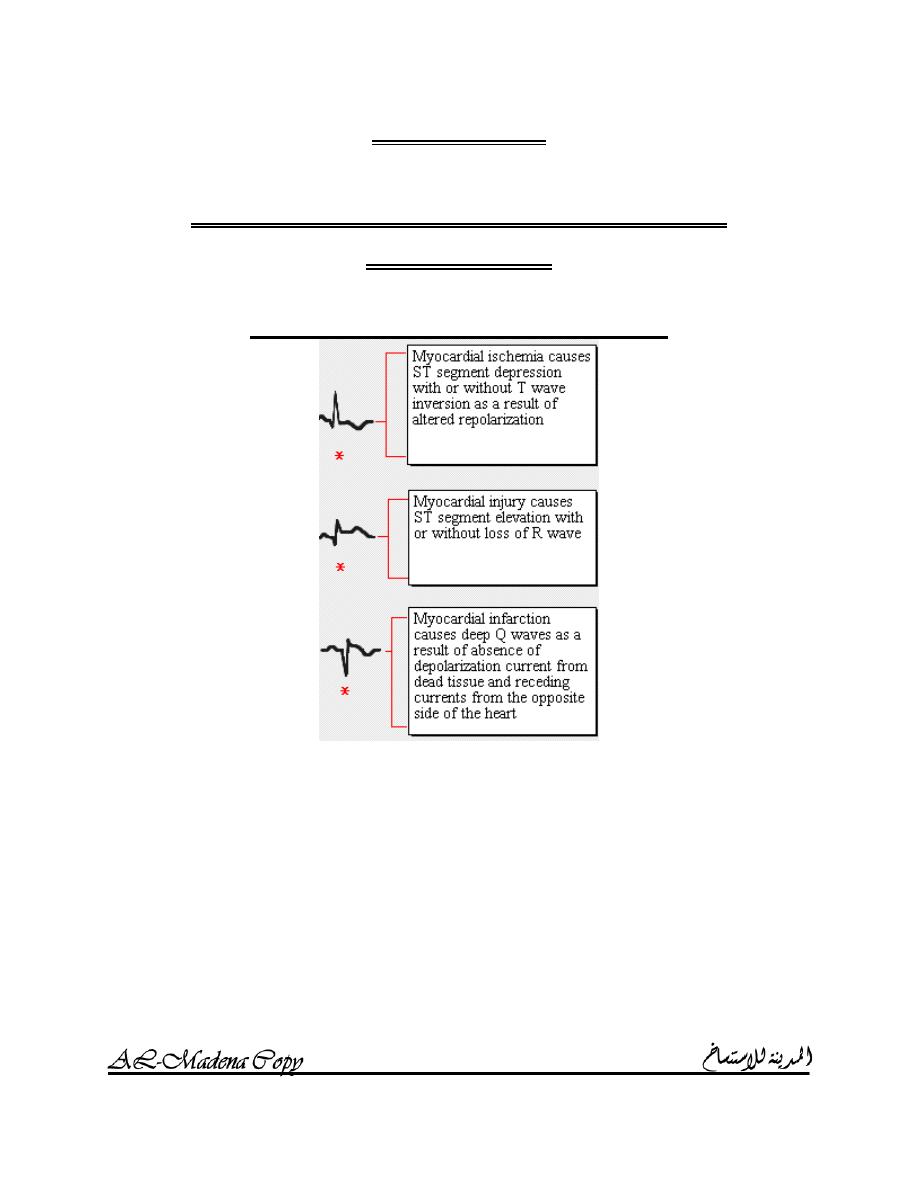
E
FFECTS OF INJURY ON THE
ECG
I
NTERACTIVE
ECG
MADE SIMPLE
AMMAR SAMEER
36
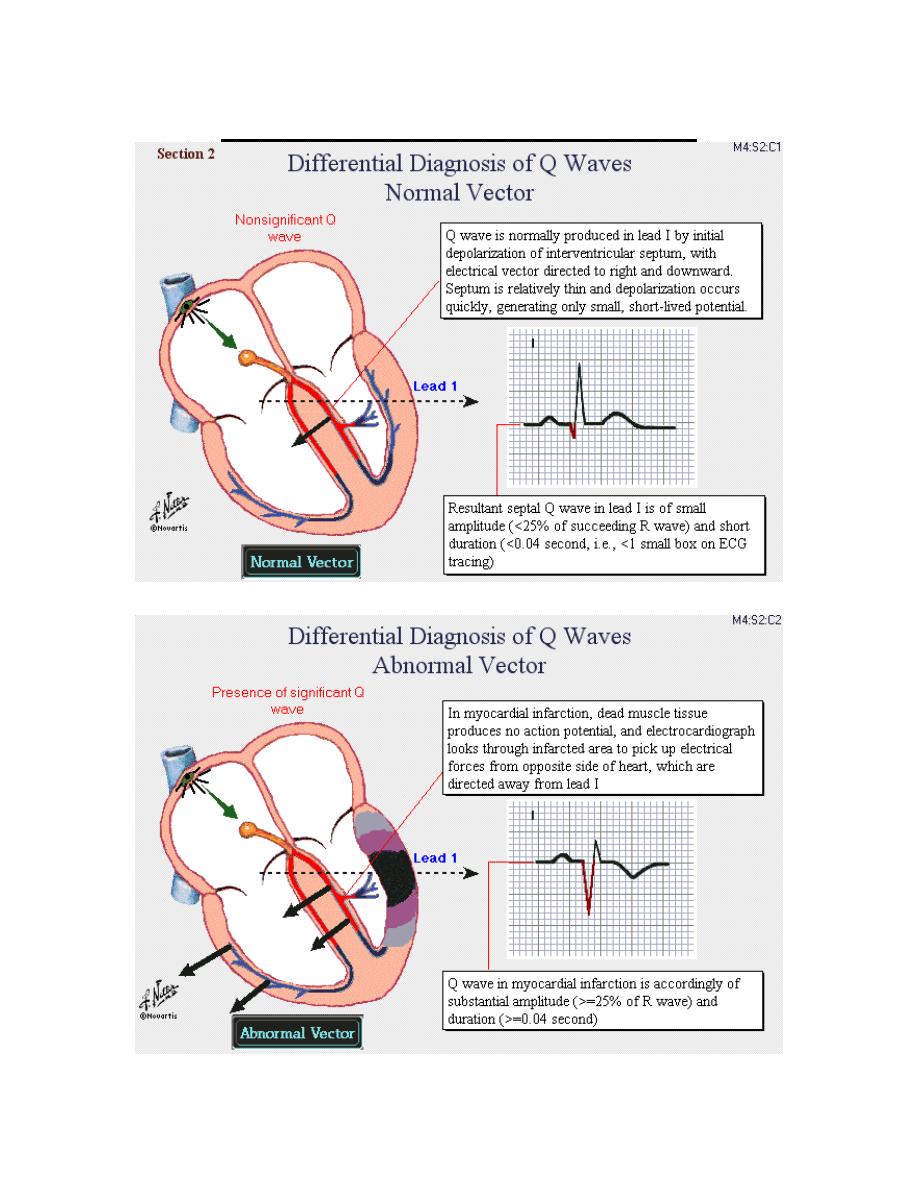
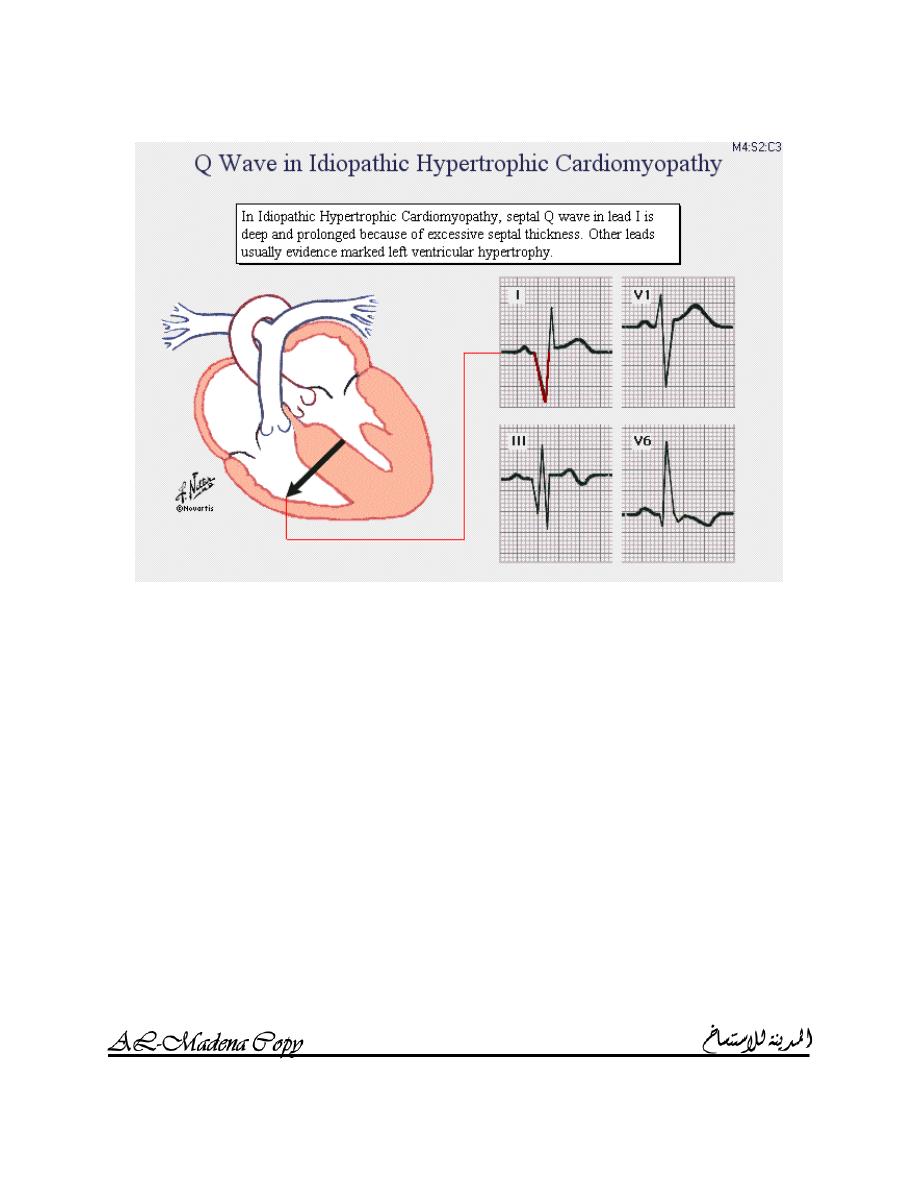
D
IFFERENTIAL DIAGNOSIS OF
Q
WAVE
I
NTERACTIVE
ECG
MADE SIMPLE
AMMAR SAMEER
37
I
NTERACTIVE
ECG
MADE SIMPLE
AMMAR SAMEER
38
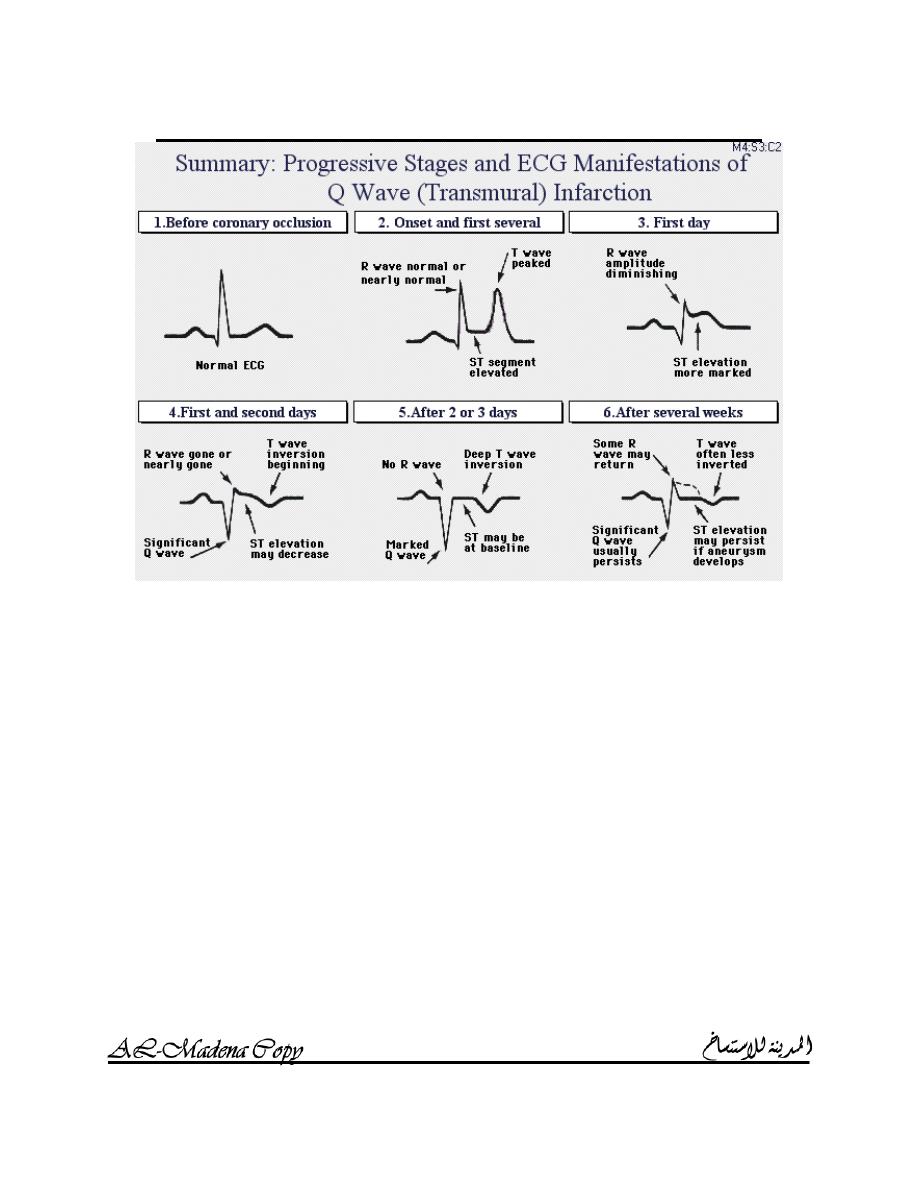
S
TAGES OF
Q
WAVE
(
TRANSMURAL
)
INFARCTION
I
NTERACTIVE
ECG
MADE SIMPLE
AMMAR SAMEER
39
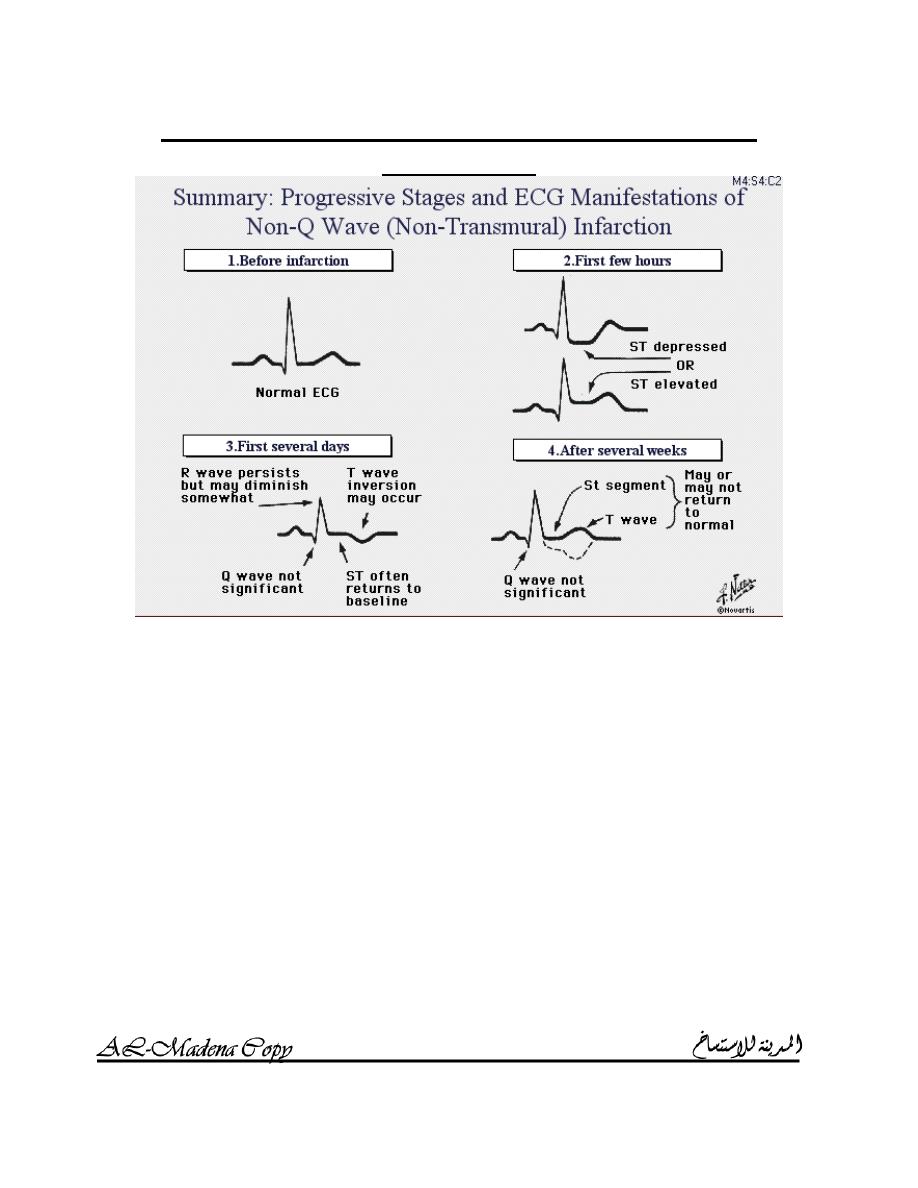
S
TAGES OF NON
-
Q
WAVE
(
NON
-
TRANSMURAL
)
INFARCTION

I
NTERACTIVE
ECG
MADE SIMPLE
AMMAR SAMEER
40
A
NTERIOR INFARCTION
I
NTERACTIVE
ECG
MADE SIMPLE
AMMAR SAMEER
41
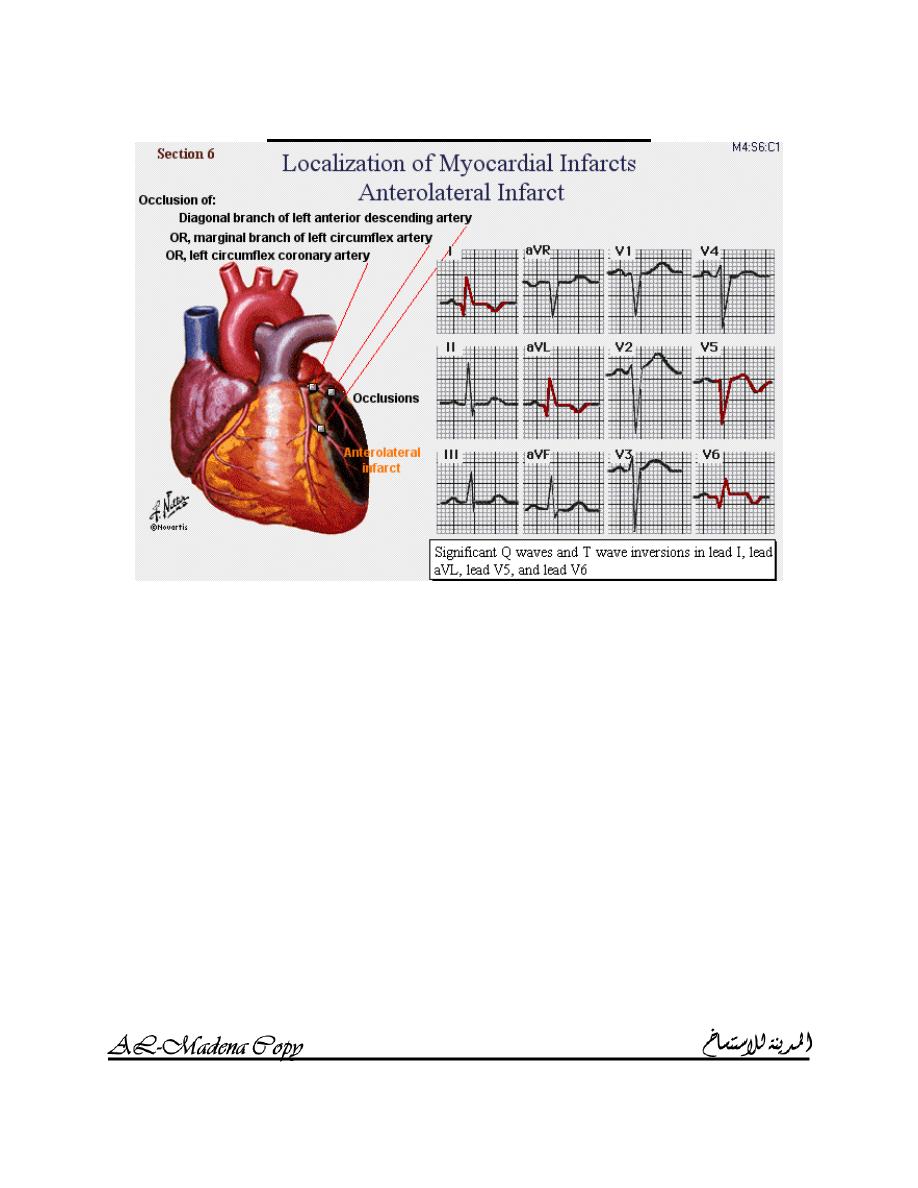
A
NTEROLATERAL INFARCTION

I
NTERACTIVE
ECG
MADE SIMPLE
AMMAR SAMEER
42
D
IAPHRAGMATIC OR INFERIOR INFARCTION
I
NTERACTIVE
ECG
MADE SIMPLE
AMMAR SAMEER
43
T
RUE POSTERIOR INFARCITION
AMMAR SAMEER
Senior Medical Student
Baghdad Medical College