
0
Mustafa Hatim Kadhim
Baghdad University
Al-kindy college of medicine
Third Stage
2013 - 2014

1
List of contents
Nutrition (Theory) (P: 2 – 42)
Lecture
number
Lecture name
Doctor name
Page
number
1
Introduction to nutrition
دكتورة وجدان
3 - 9
2+3+4+5 Food Constituents
10 - 29
6+7
Disorders of Malnutrition
دكتورة لجيه
30 - 36
8
Nutrition in special diseases
دكتورة يسرى
37 - 38
9
Nutrition in vulnerable groups
39 - 42
Nutrition (Practical) (P: 43 – 52)
Lab
number
Lecture name
Doctor name
Page
number
1
Nutrition Assessment
دكتورة وجدان
44 - 46
2
Energy
دكتور احمد
47 - 48
3
Food Pyramid
49 - 52
Biostatistics (Theory & Practical) (P: 53 – 96)
Lecture
number
Lecture name
Doctor name
Page
number
1+2
Introduction
دكتور احمد
54 - 63
3+4+5
Descriptive statistics
64 - 71
6
Probability
72 - 75
7
Probability Distribution
76 - 79
8
Sampling Distribution
80 - 81
9
Hypothesis Testing
82 - 84
10
T-test
85 - 86
11
Chi-square distribution (X
2
-test)
87 - 93
12+13
Inferential Statistics
94 - 95
14
Covariance & Correlation “Relation
between 2 variables”
96
2
Lecture 1 - Introduction to Nutrition
3
Lecture 1 - Introduction to Nutrition
4
Lecture 1 - Introduction to Nutrition
5
Lecture 1 - Introduction to Nutrition
6
Lecture 1 - Introduction to Nutrition
7
Lecture 1 - Introduction to Nutrition
8
Lecture 1 - Introduction to Nutrition
9
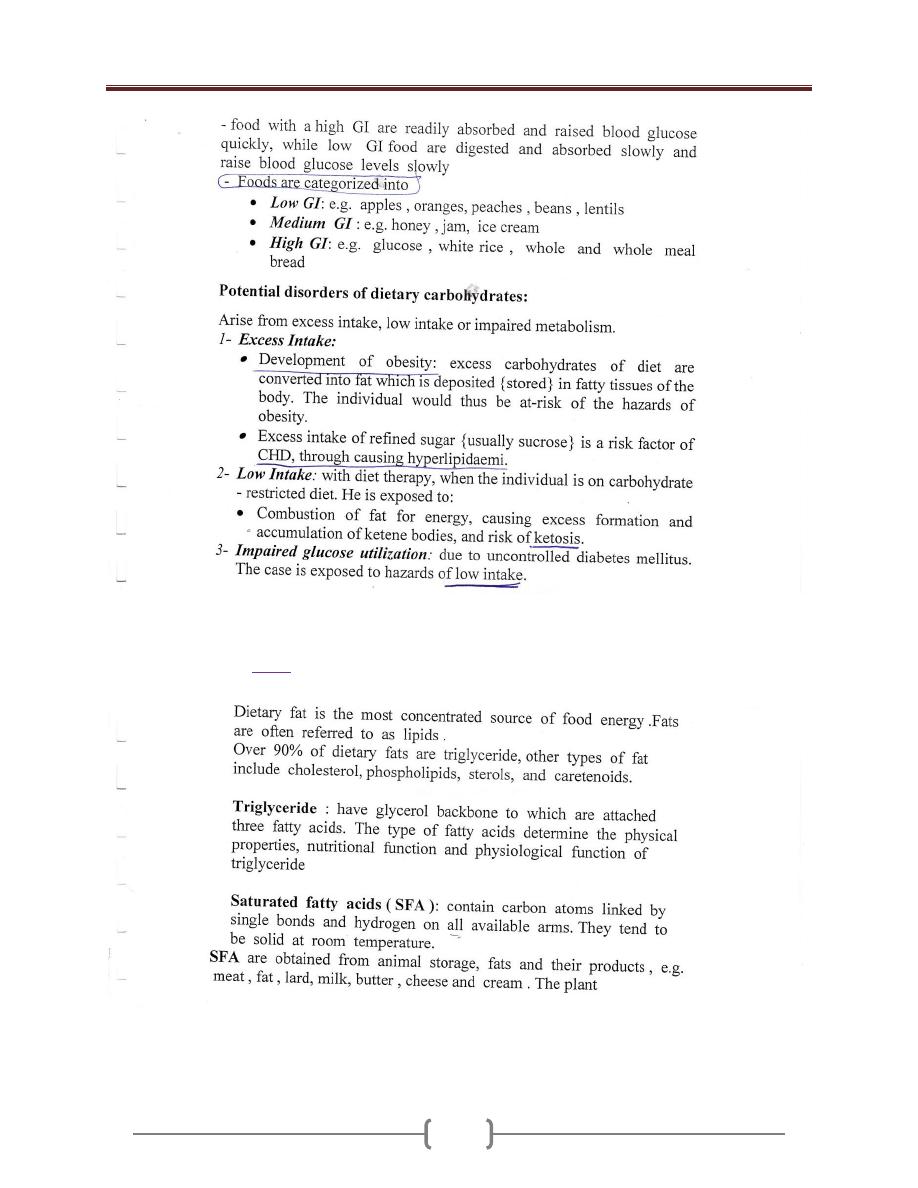
Lecture 2+3+4+5 - Food Constituents
10
1- Macronutrients
1) Protein
Lecture 2+3+4+5 - Food Constituents
11
Lecture 2+3+4+5 - Food Constituents
12
2) Carbohydrates
Lecture 2+3+4+5 - Food Constituents
13
Lecture 2+3+4+5 - Food Constituents
14
3) Fats
Lecture 2+3+4+5 - Food Constituents
15
Lecture 2+3+4+5 - Food Constituents
16
Lecture 2+3+4+5 - Food Constituents
17

Lecture 2+3+4+5 - Food Constituents
18
2- Micronutrients
Vitamins
Vitamins are essential organic compounds needed for
body functioning & metabolism. They are classified into:
Fat-soluble: A, D, E and K.
Water-soluble: B group and C.
Fat-soluble: A, D, E and K.
Vitamin A
Vitamin A is the name of a group of fat-soluble retinoid,
including retinol, retinal, retinoic acid, and retinyl esters
.
Vitamin A is involved in immune function, vision,
reproduction, and cellular communication. Vitamin A is
critical for vision as an essential component of rhodopsin,
a protein that absorbs light in the retinal receptors, and
because it supports the normal differentiation and
functioning of the conjunctival membranes and cornea.
Vitamin A also supports cell growth and differentiation,
playing a critical role in the normal formation and
maintenance of the heart, lungs, kidneys, & other organs.
2 forms of vitamin A are available in the human
diet:
1.
preformed vitamin A (retinol and its esterified form,
retinyl esters) is found in foods from animal sources,
including dairy products, fish, and meat (especially liver).
By far the most important
2.
provitamin A carotenoids . Is beta-carotene; other
provitamin A carotenoids are alpha-carotene and beta-
cryptoxanthin. The body converts these plant pigments
into vitamin A. Both provitamin A and preformed vitamin
A must be metabolized intracellularly to retinal and
retinoic acid, the active forms of vitamin A, to support the
vitamin's important biological functions.
Vitamin A is obtained from dietary sources, and
nondietary when necessary.
1-
Dietary Sources: animal and plant foods.
Animal foods: liver and liver product , egg yolk, whole-
milk & cheese, butter, cream, fatty fish & any animal fat.
Plant foods: not provide vitamin A, but the vitamin
precursor {provitamin}. Carotenes are found in pigments
of most vegetables and fruits {green, yellow, and red,
orange: - carrots, red peppers, tomatoes). Beta – carotene
in chlorophyll of dark – green leafy vegetables (spinach)
is particularly important.
2-
Non dietary Source: cod-liver oil and other fish-liver oils
can be given to supplement vitamin A for vulnerable
groups when necessary.
Physiological Functions
1- Normal growth of healthy epithelial cells, of Skin and
muous membranes, especially of respiratory passages and
urinary tract.
Vitamin A is known as "anti-infection vitamin", because
it is needed for formation of healthy epithelial surfaces,
which are the first line of natural barriers of infection that
resists invasion by pathogenic organisms. But once
infection occurs, vitamin A has no effect against infection
{i.e. anti-infection role is preventive, not therapeutic}.
2- vitaminA is essential for the production of
rhodopsin in the rods 0f the retina., which is
important for the adaptation of vision in the dark.
3- growth
4- cell differentiation
5- Emberyogenesis\
6- Immun response
Deficiency vitamin A
Eye changes : night blindness when vitamin A status
is marginal , and with prolonged or sever deficiency ,
changes to the cornea and congunctiva occur , these
eye changes are known collectively as Xerophthalmia
. these changes consist of conjunctival xerosis and
lack of tears , Bitot`s spots , corneal xerosis , corneal
ulceration and corneal scars
Epithelial tissues – skin keratinization , horny plugs
block the sebaceous glands leading to follicular
hyperkeratosis
Immunity: vitamin A deficiency results in increase
susceptibility to infectious diseases such as diarrhea
and respiratory infections due to Pathological changes
of mucous membranes that become more susceptible to
infection.
Requirements :
The established recommended dietary allowance standard
for adults is 800 µg for women and 1000 µg for men.

Lecture 2+3+4+5 - Food Constituents
19
Table 1: Recommended Dietary Allowances (RDAs) for
Vitamin A
Age
Male
Female
Pregnancy Lactation
0–6
months*
400 mcg
RAE
400 mcg
RAE
7–12
months*
500 mcg
RAE
500 mcg
RAE
1–3 years
300 mcg
RAE
300 mcg
RAE
4–8 years
400 mcg
RAE
400 mcg
RAE
9–13 years
600 mcg
RAE
600 mcg
RAE
14–18
years
900 mcg
RAE
700 mcg
RAE
750 mcg
RAE
1,200 mcg
RAE
19–50
years
900 mcg
RAE
700 mcg
RAE
770 mcg
RAE
1,300 mcg
RAE
51+ years
900 mcg
RAE
700 mcg
RAE
RDAs for vitamin A are given as mcg of retinol activity
equivalents (RAE) to account for the different
bioactivities of retinol and provitamin A carotenoids
Pregnant and Lactating Women in Developing
Countries
Pregnant women need extra vitamin A for fetal growth
and tissue maintenance and for supporting their own
metabolism. The World Health Organization estimates
that 9.8 million pregnant women around the world have
xerophthalmia as a result of vitamin A deficiency
.
Other
effects of vitamin A deficiency in pregnant and lactating
women include increased maternal and infant morbidity
and mortality, increased anemia risk, and slower infant
growth and development.
The most common and readily recognized symptom of
vitamin A deficiency in infants and children is
xerophthalmia
Vitamin D (calciferols){Antirachitic Vitamin}
What is Vitamin D?
Vitamin D is a fat-soluble vitamin that's formed when
skin is exposed to the sun's ultraviolet rays. Vitamin D is
also found in food and dietary supplements.
There are two major types of vitamin D. Vitamin D3, also
called cholecalciferol, is the type made in the body in
response to sun exposure and found in certain foods.
Vitamin D2 (ergocalciferol) is the most common form
used in supplements. It's also used to fortify certain foods,
such as milk.
Both typ\es of vitamin D must be converted in the liver
and kidneys to the active form, 1,25 dihydroxyvitamin D,
to be useful to the body.
Present in two forms: Vitamin D
2
and Vitamin D
3.
Dietary ergocalciferol and cholecalciferol are
biologically inactive and are activated to 25-
hydroxyvitamin D in the liver ( this has limited
amount of biological activity ) . further conversion in
the kidney in the production of more active form
1,25- dihydroxyvitamin D ( Calciferol)
Sources of Vitamin D:
1- Dietary Sources:
Oil-rich salt-water fish {e.g. sardines and salmon}, liver,
egg yolk , , and other fat-containing animal foods:
provide but little vitamin D, not satisfying body need.
Cod liver oil
D-fortified foods {vitamin D is added}: baby powder
milk, and fortified butter and margarine.
2- Non dietary Sources: vitamin D supply is largely
nondietary.
a) Ultraviolet radiation of skin:
Exposure of bare skin to sunlight.
Exposure to artificial ultraviolet rays: only
occasionally used to treat rickets, if necessary.
b) Medicinal preparation of oral fish liver oil {provide
vitamin D and A}, or vitamin D2, oral or parenteral,
given, to supplement vitamin D

Lecture 2+3+4+5 - Food Constituents
20
What Does Vitamin D Do?
The main function of vitamin D is to maintain normal
levels of calcium and phosphorus in the blood to support
bone mineralization (hardening of bones), cell functions,
and proper nerve and muscle function. Vitamin D acts as
a hormone, enhancing the absorption of calcium and
phosphorus in the small intestine.
Vitamin D is needed for normal growth. Without it, bones
become weak and deformed, resulting in rickets in
children and a condition called osteomalacia in adults.
Osteoporosis
Vitamin D deficiency can lead to the development of
osteoporosis because it reduces calcium absorption. In
older people, low vitamin D levels have been associated
with an increased risk of falling. Higher vitamin D levels
have been associated with stronger bones (greater bone
mineral density).
Cancer
Preliminary evidence suggests vitamin D may aid in
cancer prevention by blocking cell growth and
differentiation (cells mature and take on a specialized
form and function).
Since the late 1980s, the risk of developing and dying
from breast, prostate, ovarian, and other cancers has been
found to be increased in geographic areas located at
higher latitudes, where there's less sun exposure, and with
vitamin D deficiency.
Autoimmune Disease
Because vitamin D is thought to influence the immune
system, there is some evidence it may help with
autoimmune disease.
Other Conditions
Preliminary evidence suggests vitamin D may help with
muscle and bone pain, diabetes prevention,
fibromyalgiagum
, and proper immune
function.
Vitamin D supplements are also available.
Multivitamins and calcium supplements provide vitamin
D, but the amount varies widely so it's important to read
labels. Vitamin D3 (cholecalciferol) is the preferred
form.
Recommended Vitamin D Intake
Recommendations for vitamin D intake are as follows:
Birth to 50 years -- 200 IU (5 mcg)
Between 51 and 70 years -- 400 IU (10 mcg)
Over 71 years -- 600 IU (15 mcg)
Pregnant and nursing women -- 200 IU (5 mcg).
In a recent study that found a 7% reduction in mortality,
the average intake was about 500 IU per day.
Function:
Vitamin D is needed for bone metabolism:
1,25 dihydroxyvitamin D maintains plasma Ca by
controlling Ca absorption and excretion
Vitamin D and it's metabolites are involved in bone
mineralization
Deficiency:
Arises mainly from nonexposure of bare skin to sunlight.
Blood calcium and phosphorus level in blood is
inadequate for mineralization of growing bone, and
remineralization of mature bone, causing:
Rickets, (which is characterized by reduced
calcification of bone epiphyses) , and late eruption and
early decay of teeth in children.
Osteomalacia in adults: largely due to calcium
deficiency, and occasionally vitamin D deficiency.
Osteoporosis: vitamin D deficiency may contribute to
type II Osteoporosis of the elderly.
Vitamin E
Eight naturally occurring forms of Vit E are synthesized
in plants
Sources:
Wheat- germ oil
egg yolk and liver are rich sources.
Almonds.
sunflower seeds and oil
peanuts and peanut butter
corn oil
Recommended daily allowance
:
the recommended daily allowance
( RDA) standard for men and women age 14 and older is
15 mg / day , with lesser amounts required in childhood.
Needs during the first year of infancy do not have an
RDA figure, but an adequate intake amount of 4-6
mg/day is used .The UL ( Tolerable Upper Intake Level)
for adults is set at 1,000 mg /day .

Lecture 2+3+4+5 - Food Constituents
21
Function:
Antioxidant, vitamin E is a powerful antioxidant
and protects cell membranes and lipoproteins
from damage by free radicals
Maintenance of cell membrane integrity
Regulation of prostaglandin synthesis
DNA synthesis
Vitamin K
Naturally occurring vitamin K can be classified into
two groups , the major form of vitamin K 1 is found
in plants while the vitamin K2 group of compounds
are synthesized by intestinal bacteria
Sources:
Dietary: fresh dark- green leafy vegetables (spinach,
cabbage).
Biosynthesis: intestinal flora form vit. K.
Synthetic preparations: of K
3
, oral and parental
therapeutic purposes.
Function
Blood clotting: vitamin K is essential for maintaining
normal levels of four of the 11 blood clotting factors.
promotes the synthesis of γ - carboxyglutamic acid (
Gla ) in the liver . Gla is an essential part of
prothrombin ( factor II ) and other coagulation factors (
VII, IX , and X ) .vitamin K is therefore essential for
blood coagulation
Bone development: spesific proteins found in bone and
bone matrix require vitamin K for their synthesis and
are involved with calcium in bone development ,these
bone proteins bind calcium but function here to form bone
crystals .
Water-soluble Vitamins: B and C
** B-Vitamins
The B group of vitamin {water soluble} includes:
Thiamine: vitamin B1, antiberiberi vitamin.
Riboflavin: vitamin B2.
Niacin: nicotinic acid, PP factor {pellagra- preventing factor}.
Folic acid.
Cyancobalamin: vitamin B12.
Pyridoxine: vitamin B6.
Biotin
Pantothenic acid and others.
Sources:
Biosynthesis: by intestinal flora and tissues, except
B12 which is only dietary.
Dietary Sources: plant and animal foods, except B12
which is provided by animal foods only.
Plant foods: {yeast}, whole-grain cereals, pulses, nuts,
green leafy vegetables
Animal foods: egg yolk, meat, organ meat.
Physiological Role: B-vitamins are coenzymes of many
enzymes systems of body metabolism.
Thiamine {B1}
Physiological Role:
B1 is needed for carbohydrate metabolism
Deficiency:
Causes impaired carbohydrate metabolism, clinically
manifested as:
1- beriberi which is classified as dry beriberi involves
the nerves {peripheral neuropathy} and wet beriberi
which involve myocardium.
2- Wernicke- Korsakoff syndrome in chronic
alcoholics , ( encephalopathy and psychosis )
Recommended daily allowance:
Adult male 1.5 mg.
Increased during pregnancy and lactation.
Increased whenever dietary carbohydrate is increased to
provide more energy, according to energy need.
Riboflavin {B2}
B2 has fluorescent yellow-green color.
Sources:

Lecture 2+3+4+5 - Food Constituents
22
Milk is the richest source, hence also named "lactofavin".
Eggs, Liver & kidney, yeast extracts
Function:
1) promotion of normal growth
2) assisting of synthesis of steroids , glycogen
3) maintenance of mucous membranes , skin, eyes, and
the nervous system
4) aiding Fe absorption
Deficiency:
Shows mouth and eye manifestations.
Mouth: angular stomatitis {formation and fissures of
mouth angles}, cheilosis, glossitis & nasolabial dermatitis
Eyes: circumcorneal vascularization, with lacrimation,
photophobia, irritation and sandy feeling.
Recommended daily allowance:
Adult male 1.7mg.Increased during pregnancy & lactation
Niacin (nicotinamide, nicotinic acid )
Sources: dietary and biosynthesis.
Biosynthesis: animal protein foods provide the essential
amino acid tryptophan which is converted , by
biosynthesis, into niacin, and so tryptophan is
considered "niacin precursor".
Niacin deficiency: causes pellagra which is
characterized by:
Dermatitis, Diarrhea, Dementia.
Recommended daily allowance:
Adult male nearly 20 mg of total niacin, that depends on
dietary niacin and tryptophan. It is increased during
pregnancy and lactation
Vitamin B6
There are three naturally occurring forms of Vit B6 ,
pyridoxine, pyrridoxal, and pyridoxamine
Food sources:
Meat, Wholegrain cereals, and fortified cereals, Bananas
& Nuts
Deficiency : lead to lesions of the lips and corners of
the mouth and inflammation of the tongue. Vit B6
deficiency is usually associated with other vitamin
deficiency .
Folic acid
Physiological Role:
1) Folic acid is needed, together with B12, for development
of red blood cells in the bone marrow.
2) Folates are essential for the synthesis of DNA & RNA
Deficiency:
Causes "megaloblastic {macrocytic} anaemia", where
development of RBCs in the bone marrow stops at
megaloblast stage
Vitamin B12
Vitamin B12, (cobalamin is the natural form , &
cyanocobalamin is the commercially available one), is
water-soluble, crystalline red cobalt-containing
compound. It is absorbed in the small intestine; it needs
an intrinsic factor secreted by healthy stomach mucosa.
The liver stores enough vitamin B12 for 3 years
Sources: of B12 differ from other B-vitamins by being:
Only dietary, no biosynthesis.
Provided by animal foods only, especially liver, kidney,
meat and fish .
Physiological Role: B12 is involved in
1) Synthesis of nucleoproteins.
2) Formation of red cells in the bone marrow.
3) Normal myelination of nerves.
Deficiency:
Causes pernicious anemia (megaloblastic) & or nervous
manifestations. Deficiency May be primary or secondary.
Primary deficiency: dietary, with plant or largely plant diet.
Secondary deficiency:
When intrinsic factor is lacking, and so dietary B12 is
not absorbed in small intestine: with degeneration of
gastric mucosa, or gastrectomy.
The intestinal parasite "D. latum" consumes B12.
Recommended daily allowance: 2 micrograms for adults.
Intake increased during pregnancy and lactation.
Vitamin C {Ascorbic Acid}
Sources:
Plant foods, while animal foods, including milk, are poor
sources.
Citrus fruits {and their fresh juice}, Cauliflower, cabbage,
tomatoes, sprouting beans
Physiological Role:
1) Vit C is a powerful reducing agent (antioxidant)

Lecture 2+3+4+5 - Food Constituents
23
2) Vit C is required for the synthesis of collagen , the
main protein in connective tissue and therefore it is
essential for the maintenance of muscles, tendons,
arteries , bone, skin ,. It is essential for the normal
functioning of enzymes involved in collagen synthesis
3) Facilitates absorption of iron in the intestine ,when
consumed in the same meal.
4) Plays a role in amino acid metabolism.
5) Various peptide hormones and releasing factors
require activation by Vit C dependent enzyme
6) The hydroxylation of dopamine to the neurotransmitter
noradrenaline require vitamin C
Deficiency:
Scurvy is the clinical syndrome of deficiency. Scurvy is
characterized by bleeding anywhere in the body, specially
the gums, skin and mucous membranes, and near joints
and bones,
Recommended daily allowance:
60 mg for adults, and more during pregnancy & lactation.
Calcium
Ca. is the most abundant mineral in human body is about
1.4 gm\ kg and 99% in bones and teeth, and 1% in soft
tissues and body fluids.
The normal plasma range for Ca is 2.15 – 2.55 mmol \ l
Sources:
Caseinogen, of milk and cheese: the richest source.
Shellfish, canned fish [with bones],some green
vegetables, molasses, and sesame :good sources.
Deficiency:
1) Deficiency disease and metabolic disorder of bone:
Osteomalacia, rickets & osteoporosis.
1) Tetany: due to severe calcium deficiency, _
hypocalcaemia that causes increased irritability of motor
nerves, usually in children and occasionally in adults.
2) Other hazards related to blood clotting, & regulation of
pulse.
Phosphorus
The normal adult range of serum total phosphate level
is 0.7-1.5 mmol \ l .
Body phosphorus is found in:
Skelton, mainly: 80%
Body fluids and tissue cells: 20%
Sources:
Calcium – rich foods. Specially milk and cheese: provide
adequate phosphorus too.
Protein – rich animal foods. specially egg yolk and meat {
of cattle{ fish and poultry}: rich sources of phosphorus.
Bran of cereal grains contains phosphorus that is mostly,
however, as phytic acid: not only unutilizable, but also
interferes with absorption of calcium.
Physiological Role:
1) Bone and teeth formation, by complex calcium phosphate.
2) Phosphorus is a component of many enzymes of cell
metabolism and functional activities.
3) Formation of phospholipids.
4) Phosphorus contributes to normal blood chemistry.
Deficiency:
Practically unknown, since phosphorus requirement is
provided by animal and plant foods.
No dietary allowance is specified
Iron
There is approximately 4 gm of Fe in the body of an
adult man.
Sources: animal and plant foods.
Animal foods: organ meat {liver, heart, kidney}, lean
meat, shellfish and egg, while milk is poor in iron.
Plant foods: dried beans, nuts, green leafy vegetables, molasses.
Absorption: iron can be absorbed in the stomach and
upper part of small intestine. Not all, but a certain percent
only of dietary iron is absorbed: around 10%, normally.
Iron Deficiency:
Causes "hypochromic microcytic anaemia", with
diminished hemoglobin content of red cells, & oxygen-
carrying capacity of blood
Iodine
Sources:
Chief source: vegetables & fruits grown on Iodine- rich soil.
Other sources: sea foods, specially fish, and milk when
pasture is rich in iodine.
Physiological Role:
Iodine is essential component of thyroid hormones that
are needed for tissue metabolism and regulation of
metabolic rate.
Deficiency:
1) Goitre: simple or endemic, with enlarged thyroid.

Lecture 2+3+4+5 - Food Constituents
24
2) Cretinism: acquired, and occasionally congenital.
3) Congenital cretinism is due to inadequate supply of the
fetus with iodine.
Fluorine
Fluorine is found in enamel of teeth, making it decay –
resistant, and thus prevents dental caries {tooth decay}.
Sources:
Water supply: potable water is the chief source.
Tea and seafood are relatively rich.
Deficiency:
When potable water supply contains inadequate fluorine,
especially of less than 0.1 ppm. Children suffer high
incidence of dental caries.
Trace Elements
Zinc:
Required zinc is provided by foods of balanced diet,
especially muscle meats of farm animals and fish &
seafood
Zinc is coenzymes of zinc – containing enzymes of
protein and carbohydrate metabolism. They are essential
for synthesis of DNA and RNA.
Deficiency:
Balanced diet with adequate animal – protein foods
provides zinc requirement. Deficiency may arise with:
Plant, or largely plant, diet.
Using low – extraction flour, where phytate interferes
with absorption of zinc.
Morbidity associated with increased protein loss.
Deficiency causes growth retardation , failure to thrive ,
delayed sexual maturation{with hypogonadism, especially
in males}.
Relatively more dietary zinc is needed for:
Children below 10years.
Pregnant and lactating mothers.
Zinc intake can be assessed by zinc content of hair & nails.
Copper:
An adult has 80 mg of cu in their body
Sources:
liver, kidney, shellfish, dried beans, nuts and raisins are
good sources, while milk is poor in copper. Average diet,
however, provides copper requirement, and so dietary
deficiency is uncommon, if any.
Functions:
1) Plays a role in oxidation – reduction enzyme systems.
2) Haemopoietic role:
Better absorption of iron.
Synthesis of hemoglobin and cytochrome.
Deficiency:
Not reported in adults.
Deficiency in infants {rare} shows impaired growth,
mental retardation, brittle hair, anaemia {must be
managed by iron and copper}, and contributes to
manifestation of PEM.
Magnesium:
Sources:
Magnesium is widely available in most foods, specially
meat, organ meat, seafoods, green vegetables
{Hard water contains magnesium}.
Functions:
1) Extracellular magnesium: needed in neuromuscular
transmission.
2) Intracellular magnesium: A component of matrix of bone.
- Essential cofactor of many enzyme systems, e.g.
phosphorylation and synthesis of nucleic acid.
Deficiency:
Arises from some pathological conditions:
1) Acute diarrheal disease and PEM.
2) Chronic renal failure.
3) Chronic malabsorption syndrome.
4) Chronic alcoholism.
5) Manifestations: vary with the extent of deficiency that
may be mild {usually asymptomatic}, moderate or severe.
Cases may show irritability, emotional disturbance,
muscle disorders and other hazards.
Manganese:
Sources: dietary content varies, for example:
Cereals, whole unrefined grains, dried fruits, nuts and tea[
very rich], liver, peanuts and white bread [rich],
vegetables and fruits [ moderate].
Function: managanese activates many enzymes.
Deficiency: reported in animals not in man.

Lecture 2+3+4+5 - Food Constituents
25
Water:
Water forms about 70% of body weight. it is necessary
for life, being a constituent of all body cells, that is
needed for body functioning.
Daily requirement:
Not fixed, but varies with climate, physical activity and
other factors. An adult in temperate climate needs about
2.5 liters of water a day, obtained from potable water, and
water, content of ingested fluids and foods.
Fibers
Fiber is material from plant cell walls that is resistant to
digestion by enzymes of the human small intestine, and is
often classified according to its solubility in water. Water
soluble fibers tend to be efficiently broken by bacteria in the
colon. Water insoluble fibers pass through the body mostly
unchanged. Dietary fiber is a complex mixture of both.
Sources:
Fruits [banana], vegetables [potato], breads and cereals,
nuts and seeds.
Recommended daily intake:
Infant: 6-20 weeks ---------------------9.1 gm of fiber/L of
formula
Children: age + 5 gm / day [beginning at age 2- age 18].
Adults: 20-35 gm / day.
Conditions that can be improved by increasing fiber
intake:
1) Diseases of coln.
2) Diabetes mellitus: it improve glycemic control & increase
sensitivity insulin -----decrease the dose of medication
3) Hyperlipidemia ------ it decreases serum lipid levels LDL.
4) Obesity:fullness.
Lecture 6+7 - Disorders of Malnutrition
26
Protein Energy Malnutrition (PEM)
A) Kwashiorkor
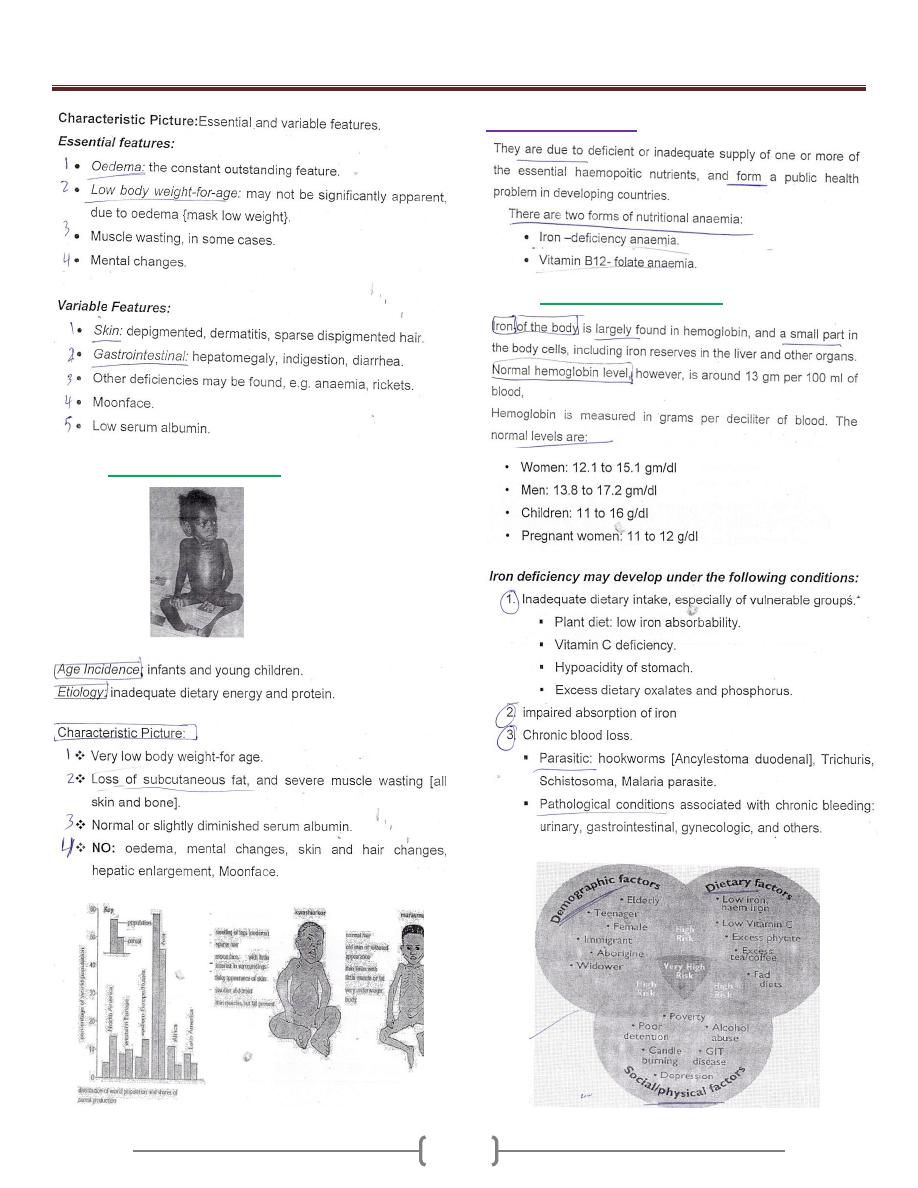
Lecture 6+7 - Disorders of Malnutrition
27
B) Nutritional Marasmus
Nutritional Anemia
A) Iron Deficiency Anemia
Lecture 6+7 - Disorders of Malnutrition
28
B) Folate-B12 Deficiency
Lecture 6+7 - Disorders of Malnutrition
29
Clinical manifestations:-
Children who have vitamin B-12 deficiency often presents
with nonspecific complaints such as:-
Weakness, Fatigue, Lethargy & FTT.
Other common findings include :-
Pallor, Glossitis (red smooth tongue), Vomiting, Diarrhea &
Icterus.
And Neurological symptoms also occur:-
Parasthesias, Sensory deficits, Hypotonia, Seizures &
Developmental delay.
Iodine Deficiency
Goitrous Areas
Endemic Goiter
Cretinism
Non-Goitrous Areas
Lecture 6+7 - Disorders of Malnutrition
30
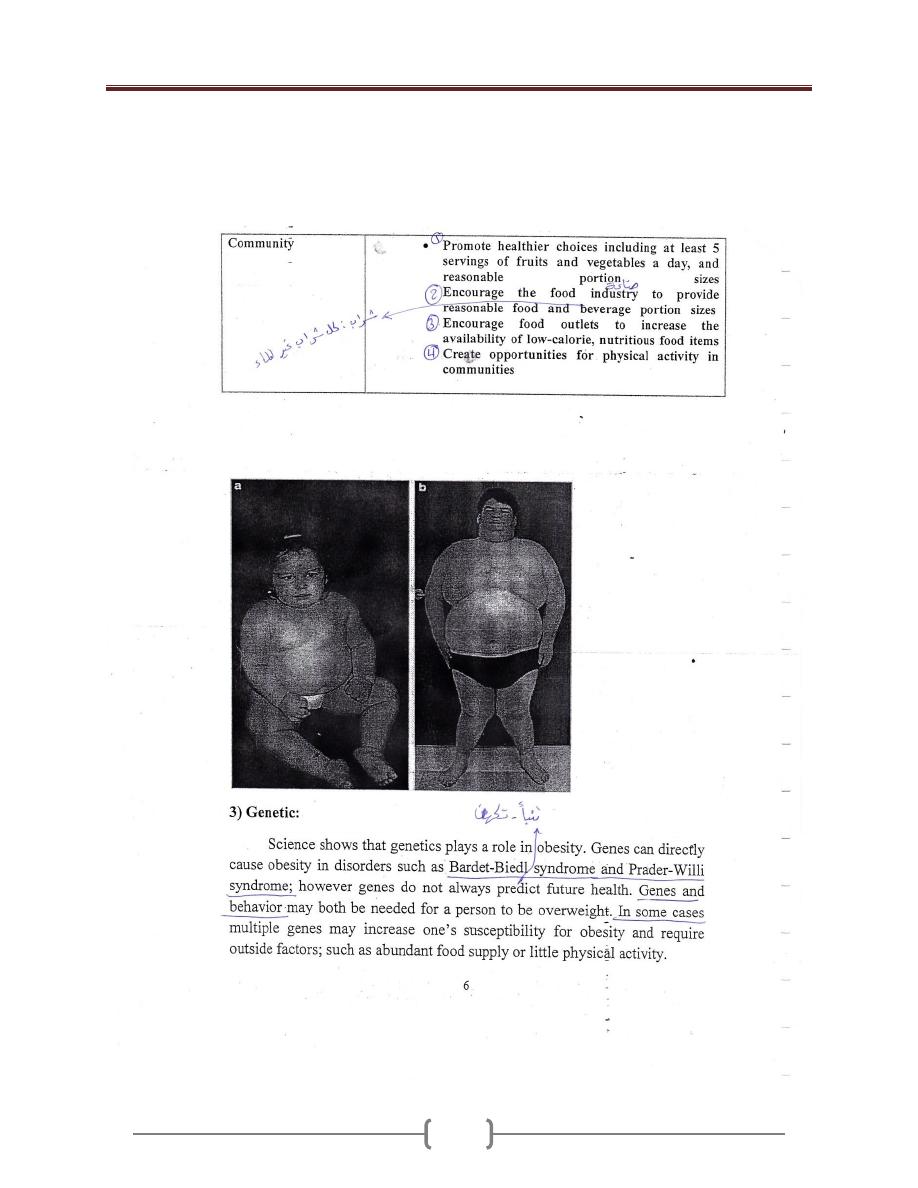
Overweight & Obesity
Lecture 6+7 - Disorders of Malnutrition
31
Lecture 6+7 - Disorders of Malnutrition
32
Lecture 6+7 - Disorders of Malnutrition
33
Lecture 6+7 - Disorders of Malnutrition
34
Lecture 6+7 - Disorders of Malnutrition
35
Lecture 6+7 - Disorders of Malnutrition
36

Lecture 8 – Nutrition in special diseases
37
1- Diabetes mellitus
Diabetes is present when the fasting plasma glucose is
126 mg/dl {7 mmol/L} or greater on two occasions.
Diabetes is a major source of disability. It is the most
common cause of blindness among Americans. It is
responsible for one third to one half of all cases of chronic
renal failure requiring dialysis. Undiagnosed diabetes can
be a life-threatening disease in children.
Causes of diabetes:
The two types of diabetes are
Type 1, or insulin - dependent diabetes {IDDM}, and
type 2, or non-insulin-dependent diabetes {NIDDM}.
1) Type 1 diabetes, which accounts for approximately 10%
of cases, is believed to be the result of an autoimmune
process in which a progressive destruction of pancreatic
beta cells results in insulin deficiency. Its onset is
typically in childhood. This form of diabetes was
uniformly fatal until insulin was discovered in the 1920s.
2) Type 2 diabetes represents the remaining 90% of cases. It
is also known as adult-onset diabetes. Obesity is present
in 80-90% of individuals with type 2 diabetes and
contributes to the insulin resistance, which is thought to
be a key element in the pathogenesis of this condition.
Impairment in insulin secretion is also a factor in the
development of type 2 diabetes.
The effect of weight loss on type 2 diabetes:
Weight loss has been shown to lower plasma glucose,
triglycerides and very low-density lipoprotein {VLDL}
concentrations in a high proportion of individuals with
type 2 diabetes. Weight loss also reduces blood pressure.
Because elevated blood pressure, triglycerides, and VLDL
are common in type 2 diabetes and because they are
important risk indicators in this condition {which is
accompanied by increased cardiovascular risk}.
How can weight loss be achieved in individuals with
type 2 diabetes?
Although a reduction in energy intake is, in theory, the
ideal treatment for type 2 diabetes, this is extremely
difficult to achieve for long-term management, in part
because of the accessibility of highly palatable, energy-
dense foods in modern culture. Also, most studies show
that weights regain occurs in the majority of people who
have lost weight, usually over a 1-2 year interval.
Therefore, there has been considerable interest in formal,
aerobic exercise as an adjunct to dietary measures for the
purpose of losing weight, studies done over a period of 2-
3 years show that regular exercise, combined with a low-
fat diet, can result in sustained weight loss.
Diabetes and low-fat diet:
A low-fat diet is still strongly recommended for the
prevention and treatment of coronary artery disease.
Several studies have shown that when an isocaloric high-
carbohydrate, low-fat diet is compared with a diet higher
in fat and lower in carbohydrate, the high-carbohydrate
diet tends to result in hypertriglyceridemia. Therefore it is
probably still best to recommend a high-carbohydrate
{50-60% of calories}, low-fat {20-30% of calories} diet
for people with type 2 diabetes.
Dietary protein requirements in diabetes:
Diabetic patients should strive for a moderate protein
intake. When diabetes is controlled, protein metabolism
becomes normal. Studies have shown that restricting
protein in patients with diabetic nephropathy reduces
protienuria. It is, therefore, prudent for diabetic patients to
avoid high-protein diets. The diabetic diet should contain
moderate amounts of protein, usually 15-20% of total
energy.
Micronutrient supplementation in diabetes:
Supplementation of micronutrients not recommended in
diabetes. Physicians are often asked about chromium
picolinate, a preparation found in health food stores,
which has been touted as a treatment for diabetes.
Chromium is a cofactor of insulin. Chromium
supplementation is not currently recommended.
Magnesium and zinc have been suggested as
supplements but are also not generally indicated. A
patient with poorly controlled diabetes, especially one
who is taking diuretics, may become deficient in
magnesium, but no benefit has been shown from
magnesium therapy. It has been suggested that zinc
supplementation might aid in the healing of leg ulcers, but
zinc deficiency is extremely rare.
General advice to patients with diabetes:
Diet and exercise recommendations for diabetic patients.
A diet high in complex carbohydrate {with emphasis on
fiber} and low in fat with some limitations on simple
sugar and alcohol content is recommended for everyone
but especially for diabetics. Consistency of food intake is
also important, to avoid episodes of hyperglycemia.
Exercise, which is important for everyone, is especially
important for the diabetic patient. Sadly,

Lecture 8 – Nutrition in special diseases
38
recommendations for weight loss and exercise too often
fall upon deaf ears in the adult-onset diabetic.
2- Hypertension
Dietary management of hypertension:
Hypertension is one of the most common diseases of
adults.. Nutritional factors are as important as
pharmacologic therapy in the management of
hypertension. Up until the past three decades, patients
with hypertension generally died early, but, with modern
pharmacologic, nutritional, and lifestyle management,
patients with hypertension can live a normal life span.
Dietary measures in prevention of hypertension:
The incidence of hypertension can be reduced by
modifying four predisposing factors, three of which are
nutritional. These four factors are overweight, high salt
intake, excess alcohol consumption, and lack of physical
activity.
The optimum weight for the management of
hypertension:
The weight should be normal. Using the BMI and RW
indices to measure that. A reasonable definition is 20%
above the upper limit of the normal range.
Sodium restriction and hypertension:
Prevention of HT is associated with moderate salt
restriction, defined as 6 grams of salt/ day[ 2400 mg of
sodium]. More severe degrees of salt restriction are not
usually necessary for hypertension in the absence of heart
failure, but, with heart failure it is necessary to have more
restrictive sodium intake.
Potassium intake with hypertension:
There is an association between high potassium intake
and lower blood pressure. An increased potassium intake
is associated with reduced mortality from stroke. The
mechanisms include
lowering of the peripheral resistance
suppression of the rennin- angiotensin
mechanism
Useful substitute for sodium in achieving a low-
sodium diet.
Patients with hypertension are often treated with diuretics,
these drugs especially the hypochlorthiazides, are
associated with potassium loss therefore potassium should
be supplemented to prevent negative potassium balance.
Major drug- nutrient interactions in Hb:
Most of the drugs used to control blood pressure either
interact with nutrients or have gastrointestinal side effects,
or both:
Drugs
Side-effect
B – blockers
[propanalol]
Anorexia, dry mouth
nausea, diarrhea, abdominal pain
& and B- blockers [
labetalol]
Dry mouth, taste change, nausea
diarrhea.
&
1
recepter
blockers[prazocin]
Dry mouth, nausea, diarrhea,
constipation
ACE inhibitors
[enalapril]
Anorexia Dry mouth, nausea,
diarrhea, constipation, taste
change, glossitis and stomatitis,
abdominal pain.
Calcium channel
blockers [vepramil]
nausea, constipation
Vasodilator
[hydralazin]
Anorexia Dry mouth, nausea,
diarrhea, constipation, taste
change,
Modification in lifestyle of hypertensive patients:
Physical activity:
Exercise is the first major change, only 30minutes
scheduled exercise three times a week can have a
beneficial effect and the exercise need to be no more
elaborate than brisk walking.exersice have three benefits:
Lower blood pressure by 6 or 7 mmhg...
Useful to the weight loss program.
It helps to break the cycle of physical activity,
Smoking:
Many people think that smoking primarily damages the
lung. but the excess cardiovascular mortality related to
smoking is three times as large as the excess mortality
related to lung cancer.
Management of Hb in the elderly patients:
The systolic blood pressure rises as people age.
Management is as for younger patients. Weight reduction,
sodium restriction, alcohol limitation, and exercise are all
important components in the overall management.

Lecture 9 - Feeding of Vulnerable Groups
39
These groups are affected too much greater extent than
the general population with nutritional deficiency due to
their physiological status and these include:
1. Feeding of infants
2. Feeding of children
3. Feeding of mothers [pregnant and lactating].
4. Feeding of adolescence
5. Feeding of the elderly.
1) Feeding of the infants
Infants need adequate feeding for, normal growth and
development and for promotion of health and more
resistance to infection.
Principles of feeding:
1) Milk.
2) Dietary supplementation.
3) Weaning practice.
1) Milk:
the essential food and is either:
- human milk
- animal milk: this either powder milk , liquid milk
Breast feeding
Lactation is a physiological function with two processes:
milk secretion and milk letdown each controlled by a
special hormones of the posterior pituitary [prolactin and
oxytocin].
Requirement of breast feeding:
1) Must be started very early after delivery, for:
Stimulates milk secretion and emptying of breasts
Allows sulking of colostrum that is of anti-
infection value.
Early mother/ baby bonding.
2) Baby must be given sufficient time for suckling.
3) Mother must be at comfort, and psychologically
relaxed, to help the letdown.
4) Pattern of breast feeding:
Exclusive breast feeding giving breast milk only
[no other food], for the first four months. It may be
recommended for 6 months, especially in less
developed areas.
Weaning is then started, and gradually progresses,
together with dietary supplementation {given later}
Advantage of Breast – feeding:
Advantage to both baby and mother.
I] Advantage to Baby:
Nutritional.
Non – nutritional: anti – infection, convenience, and
psychological.
Composition of Milk
Milk Contents
Human
{%}
Cow
{%}
Buffalo
{%}
Protein gm
Fat gm
Lactose gm
Water ml
Energy kcal
Calcium mg
Phosphorus mg
Iron mg
Vitamin A IU
Vitamin D IU
Vitamin C mg
Thiamine mg
Riboflavin mg
Niacin mg
1.1
4.5
6.8
87.0
68.0
32.0
14.0
0.1
190.0
2.2
4.5
0.01
0.04
0.1
3.5
3.5
4.9
87.0
69.0
118.0
92.0
0.05
102.0
1.4
1.1
0.04
0.02
0.1
4.0
7.5
4.5
83.0
101.0
160.0
0.2
130.0
1.0
0.04
0.12
0.1
1. Nutritional:
Except for deficient iron and vitamin D that can be
supplemented, breast milk is of suitable composition and
properties for optimal growth and development. It is
readily digestible, and satisfies needs of infant in the first
months.
Impact of nutrition status of lactating mother on
composition of milk:
Adequately nourished mother: composition is more or
less unchanged[ hind milk, however, is of more fat and
protein content than fore milk]
Inadequate nutrition is mild/ moderate: quantity of milk
may be somewhat affected while composition is not, due
to physiological adaptation, with depletion of mother.
Severe malnutrition: both quantity and quality of secreted
milk are affected.
2. Non – nutritional Advantage:
A. Anti-infection value: incidence of infection, specially the
diarrhoeal and respiratory, is significantly lower in the
breast –fed then the bottle fed, due to
Presence of immunoglobulin in colostrum
The presence of lysozyme [antibacterial],
macrophages [bactericidal], lactobacillus bifid us-
promoting factor, lactoferritien [inactivates E. coli]

Lecture 9 - Feeding of Vulnerable Groups
40
B. Convenient feeding: the baby can be nursed at any time.
Breast milk is fresh and needs no preparation, of optimal
temperature, and is usually sterile.
C. Psychological value: breast –feeding allows intimate
mother/ baby contact that are emotionally valuable for
both.
II] Advantages to BF to mother:
Postpartum value: suckling stimulates secretion of
oxytocin that causes contraction of the uterus and
enhances involution of uterus.
Lower risk of breast cancer.
Psychological/ emotional value.
Fertility regulation: exclusive breast feeding suppresses
ovarian activity and postpartum ovulation, and is thus
associated with lactation amenorrhea.
Drew back of bottle feeding:
Milk borne infection,
Hyperosmolarity: increased serum similarity, causing
hypertonic dehydration.
Hypocalcaemia, due to impaired utilization of calium by
neonates in the first days or weeks--- neonatal tetany.
Allergy to caw milk, with more susceptibility to diarrhea,
and intestinal and skin disorders.
Depriving the baby of the benefits of breast- feeding.
2) Dietary Supplementation:
Milk feeding of infant and young children must be
supplemented for:
Milk –deficient nutrients
Protein.
Vitamin A.
1. Supplementation for milk –deficient nutrients:
Non powder milk is supplemented for
Iron: by iron rich food and medical preparations if
necessary, green leafy vegetables, eeg yolk, liver of
chicken then cattle
Vitamin C: giving fresh orange or tomato juice, green
vegetables.
Vitamin D: supplementation is non dietary by, proper
sun exposure ,giving vit D [ oral, parental]
2. Supplementation for protein:
As the infant grows older, increasing protein requirement
cannot be satisfied by milk, and so supplementary
protein- rich weaning foods are needed.
3. Vitamin A supplementation:
It is recommended to give two oral massive doses of vit.
A for healthy epithelial surfaces that support protection
against infection, especially measles.
Vitamin is available in blue capsules of 10000 IU, the
first capsule, at 9 months, with measles vaccine and
booster OPV.
Second dose, AT 18 months with MMR vaccine and
booster OPV, DPT vaccine.
3) Weaning:
Weaning is the process of gradually replacing milk feeds
of the baby, by a variety of foods until ultimately reaching
regular diet, and principally milk feeding is stopped, it is
recommended to start weaning from the 4
th
month and
progress to the age of 24 months.
Months
Given food
4
th
Orange or tomato juice: for vitamin C
Milk pudding: for protein, starch and other
nutrients or yogurt.
5
th
Vegetable soup [by bottle]: for iron, iodine, in
nongoitrous area and vit. C.
Yolk of boild egg: for protein, iron, Vitamins
and others
6
th
, 7
th
Fruits, for vitamins and minerals: mashed
bananas, or cooked.
Smashed vegetables by spoon.
8th,9
th
Boild potatoes or sweet potatoes
Piece of bread, or biscuits.
10th to 12th
Mashed liver or chicken, or mined meat of
chicken, cattle or fish.
Peeled mashed stewed beans[ with precaution
for fauvism]
During the second year: mother is guided how to make a
balanced diet from selected food plus milk feeds, until
weaning completed.
The characteristic of weaning practice in traditional
communities of developing countries:
Breast – feeding is usually stopped abruptly stopped,
not gradually.
Onset of weaning varies widely: BF is continued for
varied period that may be as short as 6 months- 3 years
according to circumstances.
Milk feeds are largely replaced by sweetened fluids
and starchy food, which are lack of protein.
Milk may be given but usually in small inadequate
amount.

Lecture 9 - Feeding of Vulnerable Groups
41
2. Feeding of Children
Includes preschool children, and schoolchildren.
a)
Feeding of preschool children:
Children of 1-5 years need special feeding that satisfies
normal growth and development, and health promotion
and body resistance to infection.
Deficiency:
infants [after the 6
months of age usually, or
earlier sometimes] and preschool children are exposed to
deficiency of protein, iron, vitamin D, and other nutrients.
1) Protein Deficiency: PEM, in infants and young
children, underweight, in older children.
2) Vitamin D deficiency: causes rickets. Age incidence
is usually 6 - 24 months.
3) Iron deficiency: causes iron-deficiency anemia, a
common deficiency problem.
4) Others:
Ariboflavinosis.
Dental caries.
Vitamin A deficiency.
b)
Feeding of school children:
Nutrition Deficiency Diseases
Protein deficiency: causes impaired growth and
underweight.
Iron-deficiency anemia: common problem.
Riboflavin deficiency, causing ariboflavinosis, with eye
and mouth manifestation, including cheilosis.
Dental caries: multifactorial problem, including
neglecting regular oral hygiene {the most important}, and
nutritional deficiency.
Vitamin A deficiency, giving skin and may be ocular
manifestations: occasional problem.
{What about rickets: active rickets is a preschool disease,
with age incidence of 6-24 months. Schoolchildren,
however, may show sequelae of untreated rickets, termed
"healed rickets"}.
Predisposing factors:
Inadequate home and school feeding.
1) Nutrition ignorance of child and family, including faulty
food habits, as:
Going to school without taking breakfast.
Spoiling appetite for principal meals, by in between-
meal nibbling {sweets, soft drinks and others}
Preferring snacks than vegetables and fruits.
2) Parasitic infection.
Manifestations:
General picture: impaired appetite, early fatigue, lowered
alertness and body resistance, and weak muscles.
Specific nutritional deficiency, giving characteristic
manifestations of missing or inadequate nutrient{s}.
3. Feeding of adolescence
There is a5-7 year period of rapid growth, during which
the adolescent will gain about half of their final adult
weight. The peak occurs at around 12 in girls and around
15 in boys. It is associated with the onset of sexual
maturity, after this is reached; growth tapers off until the
late teens in girls and the early twenties in boys.
Energy requirement for adolescents:
Energy need in girls reach a level of 2200 kcal/day at age
11-12 and stay at that level through adolescence. Boys,
with their later growth peak, start out at 2500 kcal/day
and go up to 3000 kcal/day during the period of maximum
growth, dropping back to adult levels during the late teens
and early twenties.
Minerals:
Some 45% of the overall skeletal growth occurs during
adolescence. Calcium requirement in adolescents is
therefore elevated to 1200 mg/day, with boys requiring
somewhat more than girls.
Zinc and magnesium are also required, girls under the
influence of estrogen, show an increase in bone density as
well as bone size during adolescence.
Iron:
The requirement in girls as they go through menarche are
somewhat greater, girls on the other hand, require adult
female levels of Iron Age 12 onward.
Vitamins:
A number of the B complex vitamins, specially thiamin,
riboflavin, niacin are required in large amounts to meet
high energy requirements and to support muscle
synthesis. Vitamin D is crucial to support the rapid
skeletal growth, its requirement are above adult levels
during adolescence. Vitamin A, C, E, B6 and foliate, are
required in adult amounts.
None of these should require supplementation in
individuals consuming a healthy and balanced diet.

Lecture 9 - Feeding of Vulnerable Groups
42
4. Feeding of mothers
{Pregnant and lactating}
Extra allowances of nutrients and energy are needed
during the latter half of pregnancy, and throughout
lactation, to satisfy physiological requirements of mother,
and needs of intrauterine growth and development.
Special consideration is given to:
Nutrition education of mothers for principles and
requirements of maternal and child feeding.
Dietary supplementation during pregnancy and lactation,
if necessary. Usually no supplementation is fed mothers.
Family planning service for optimal pregnancy spacing,
or postponing pregnancy for indicated period of time, for
restoration and promotion maternal health, and favourable
outcome of pregnancy.
Health appraisal of mothers, for:
Diagnosis and treatment of nutritional deficiency.
Morbidity that may predispose to malnutrition, if any,
e.g. parasitism.
Impact of malnutrition during pregnancy:
Impact on both the pregnant and fetus.
Impact on the pregnant:
General impairment of health.
May predispose to some maternal hazards.
Nutritional deficiency diseases, specially:
Nutritional anaemia: iron-deficiency anaemia,
pregnancy macrocytic anaemia
Osteomalacia.
Tetany, occasionally.
Impact on fetus:
More incidence of LBW.
Tendency to premature onset of labor, and more risk of
birth injuries.
Deficient body stores of the newborn, and susceptibility
to deficiency early in life, specially iron-deficiency
anemia and rickets.
Congenital cretinism in goitrous areas, when iodine
supplementation is not given during pregnancy.
Impact of malnutrition during lactation:
Impact on mother
: mother is exposed to the same
hazards of malnutrition of the pregnant, given before.
Impact on nursed baby
: composition of breast-milk is
unique, and not influenced by maternal malnutrition,
except with severe advanced deficiency.
5. Feeding of the elderly
Malnutrition is one of the main health problems of the
elderly.
Predisposing Factors:
Impaired physiological functioning with aging, including
digestion, absorption and metabolism.
Loss of teeth.
Chronic disease may be associated with anorexia.
Psychological disturbance may de associated with
anorexia, and neglecting or refusing food.
Deficiency Diseases
: varied types and severity, according
to nature and severity of deficiency. Important problems
include general debility and loss of weight, anemia, and
osteoporosis.
Prevention:
1) Establishing geriatric health centers, to provide
convenient accommodation, especially for the elderly
deprived of family care.
2) Nutrition education, of the elderly and family, for:
Foods of high nutritive value, and easy preparation,
consumption and digestion. Milk, cheese and yoghurt,
mashed potatoes, fish and minced chicken and meat
are valuable.
Diet therapy and restrictions, on medical prescription.
3) Dietary supplementation, by:
Powder milk, if regular liquid milk supply is not
available.
Supplementary geriatric foods: made of balanced,
readily digestible mixtures of HBV protein, vitamins
and minerals.
Polyvitamins – minerals preparations.
4) Regular health appraisal: for diagnosis and treatment of
morbidity, including nutritional deficiency and
predisposing disease.
43

Lab 1 – Nutrition Assessment
44
Nutrient as agent
1. according to type :
a- under nutrition (quantity) starvation
b- Mal nutrition (quality) protein, vitamins.
c- over nutrition (quantity) 0besity.
d- Food allergy.
2. according to relation to immune mechanism
a- lower natural resistance (vitamin A Deficiency change
in mucous membrane).
b- Interfere with antibody productions.
c- Increases in severity of diseases (vit C).
To assess nutritional condition we need:
A combination of
1. Clinical examination and
2. Epidemiological facts
3. Anthropometric Data
4. Biochemical testing is used to assess. Micronutrient
deficiency diseases.
The Nutrition Care Process:
Identifying and meeting a person’s nutrient and nutrition
education needs. Five steps:
1) Assess Assessment of nutritional status
2) Analyze Analyze assessment data to determine nutrient
requirements
3) Develop Develop a nutrition care plan to meet patient’s
nutrient and education needs.
4) Implement: Implement care plan
5) Evaluate: Evaluate effectiveness of care plan: ongoing
follow-up, reassessment, and modification of care plan.
Assessing Nutritional Status
•Historical Information
•Physical Examination
•Anthropometric Data
•Laboratory Analyses
A- Historical Information:
Health History (medical history) - current and past health
status
–diseases/ risk factors for disease
–appetite/food intake–conditions affecting digestion,
absorption, utilization, & excretion of nutrients–emotional
and mental health
Drug History
– Prescription.
– illicit drugs
–nutrient supplements, HERBS and other “alternative” or
homeopathic substances
– Multiple meds (who’s at risk?)
Meds can alter intake, absorption, metabolism, etc.
Foods can alter absorption, metabolism, & excretion of
meds.
Socioeconomic History
Factors that affect one’s ability to purchase, prepare, &
store food, as well as factors that affect food choices
themselves.
–Food availability (know local crops/produce)
–occupation/income/education level
–ethnicity/religious affiliations
–kitchen facilities
–transportation
–personal mobility (ability to ambulate)
–number of people in the household
Diet History
Analyzing eating habits, food intake, lifestyle, so that you
can set individualized, attainable goals.
–Amount of food taken in
–Adequacy of intake – omission of foods/food groups
–Frequency of eating out
–IV fluids
–Appetite
–Restrictive/fad diets
–Variety of foods
–Supplements (overlaps)
B- Physical Examination:
-weight status
-mobility
-confusion
-signs of nutrient deficiencies/malnutrition
esp. hair, skin, GI tract including mouth and tongue
-Fluid Balance (dehydration/fluid retention).
Limitations of Physical Findings
–Depends on assessor!
–Many physical signs are nonspecific: ie. cracked lips
from sun/windburn vs. from malnutrition, dehydration…
Lab 1 – Nutrition Assessment
45
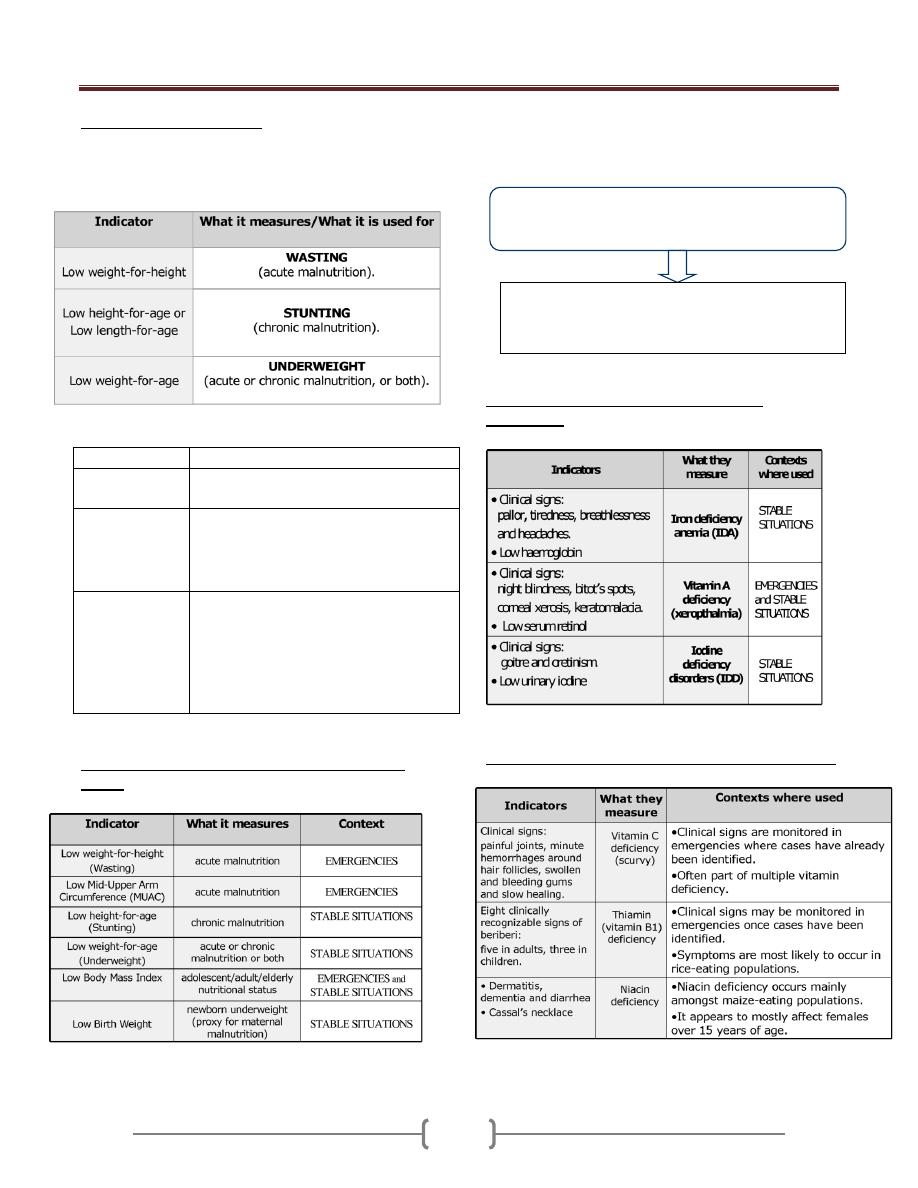
Nutritional status indicators
There are three primary anthropometric indices for
children under five years of age: Wasting; Stunting, and
Underweight.
Index/indicator What it measures/what it is used for
Body Mass Index
(BMI)
It measures thinness in adolescents, adults
& the elderly.
Low Birth
Weight (LBW)
It measure newborn weight.
It associated with poor nutrition in
mothers (although other factors can also
contribute to low birth weight.
Mid-Upper Arm
Circumference
(MUAC)
It is an index of body mass.
It is usually measured using a MUAC
that is placed around the middle of the
upper arm
It is particularly good for identifying
with high risk of mortality
Contexts in which these indicators are particularly
useful:
A combination of clinical examination and biochemical
testing is used to assess micronutrient deficiency diseases.
Indicators used for assessing micronutrient
deficiencies:
Other micronutrient deficiencies & relevant indicators
Biochemical testing is carried out on blood or
urine samples.
It is vital in situations where there is a strong
indication of risk of micronutrient deficiency but a
lack of clinical evidence.
Lab 1 – Nutrition Assessment
46
Key indicators for rapid assessment:
Mortality rates and causes of mortality
Demographic profile
Morbidity data on the most common diseases
Presence of diseases with epidemic potential
Data on immunization and vaccine coverage
Coverage of vitamin A supplementation
Predominant infant and young child feeding practices
C- What are the anthropometric
measurements & how are they used in
nutritional assessment?
Anthropometric measurements include height, weight,
skin fold thickness and circumference measurements of
different parts of the body. These measurements reflect
present nutritional status and can be used to estimate the
degree of obesity and even the percentage of body fat.
Three commonly used anthropometric indices are derived
by comparing height and weight measurements with
reference curves:
1- Height for age
2- Weight for age
3- Weight for height
Height for Age:
Length: refers to the measurement in a recumbent position
used in children aged less than 2 years who cannot stand
well.
Standing height: refers to as stature so height is used to
cover both measurements:
a) Low height for age (shortness): either normal variation or
pathological process.
Stunting: gaining insufficient height relative to age.
The term chronic malnutrition is used to describe low
height for age.
b) High height for age: (tallness) is an indicator with little
public health significance.
Weight for height:
Reflects body wt. relative to height
a) Low weight for height (thinness and wasting), thinness
does not necessary imply a pathological process.
Wasting: refers to recent and sever process that led to
significant weight loss, usually as a consequence of acute
starvation and \ or sever disease.
b) High weight for height :over wt. and obesity
What is the Body Mass Index (BMI)?
The BMI is commonly used to estimate the level of
adiposity in individuals or in groups It defines as a
relationship of weight to height, so is defined as a ratio of
weight to the square of height:
BMI = Weight in kg \ (height in meter) 2
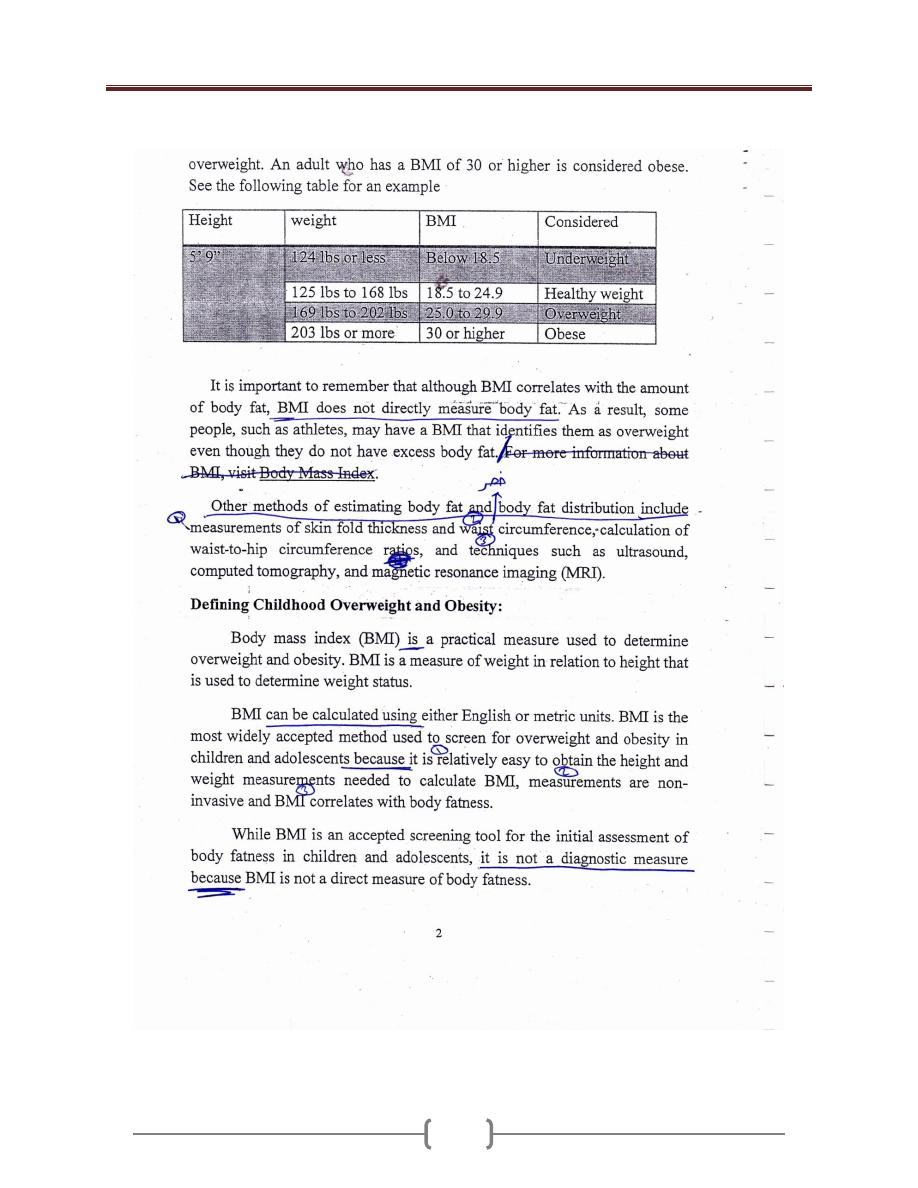
Table cut- offs for BMI in adults:
BMI
Weight status
Risk of co-
morbidities
Below 18.5
under wt
low
18.5-24.5
normal
average
25.5-29.9
over wt.
increased
30.0-39.9
obese
moderate- sever
Above 40
very obese
sever
Weight for age:
a) Low weight for age: (lightness): is a descriptive term for
low wt. for age.
(Underweight) refers to underlying pathological process.
b) High wt. for age: seldom used for public health purposes.
The proper descriptive term for high wt. for age would be
heaviness.
Other anthropometric indices:
1) mid upper arm circumference : The advantage of MUAC
include the portability of measuring tapes and the fact that
a single cut – off value ( 12.5-13.0 cm) can be used for
children under 5 years of age .
2) Body mass index.
3) Skin fold: assess the thickness of subcutaneous tissue and
are widely used for assessing obesity among adults.
4) Head circumference
occipital – frontal circumference)
used as a part of health screening for potential
developmental or neurological disabilities in children.
5) 5-proxies for length: limitation in obtaining accurate
measurements of infant length. Potential proxies include
leg (or fibular) and arm (or ulnar) length as well as head
circumference.

Lab 2 – Energy
47
Daily requirement according to age ,sex, activity, and
other conditions
Energy”
The ability to:
1- Perform work,
2- Produce change
3- Maintain life
All requires energy.
Energy exists in many forms
; mechanical, chemical,
heat, electrical, light, & nuclear energies
• In the body, chemical energy from food is converted
to mechanical energy & heat.
• The major dietary sources of energy-yielding
substrates are CHO, fats & proteins.
Units of Energy
Calorie:
It is the basic unit of energy.
It is the amount of heat energy required to raise the
temperature of one gram of water by 1°C at the standard
temperature.
But because the calorie is a small unit we usually use;
Kilocalorie (Kcal or Cal) =1000 calorie.
Which is the amount of heat energy required to raise the
temp. of a kilogram of water 1°C
Joule (J):
Is the work done (energy expended) when 1 kg is moved
1 m. by a force of 1 Newton.
The total calorie content of food can be measured by a
device called (Bomb Calorimeter). It is design to burn
food & the amount of energy produced per gram of
protein, fat or CHO by Bomb calorimeter are;
1 gm of: protein = 4 Kcal, fat = 9 Kca, CHO = 4
Kcal, alcohol =7 Kcal (not nutrient)
The nutrients release energy when they are catabolized
forming Co2 &H2O. The released energy becomes caught
within ATP = the fuel for all energy- requiring processes
in the body.
E.g. 2 eggs =100 gm;
13% protein = 13 gm x 4 = 52 kcal
12% fat = 12 gm x 9 = 108 kcal
1% CHO = 1 gm x 4 = 4 kcal
Total = 164 kcal
Bread 100 gm contains;
8% protein = 8 gm x 4 = 32 kcal
2% fat = 2 gm x 9 = 18 kcal
58% CHO = 58 gm x 4 = 232 kcal
Total = 282 kcal
100 cc of milk = ½ cup contain;
3.5% protein = 3.5 gm x 4 = 14 kcal
3.5% fat = 3.5 gm x 9 = 31.5 kcal
5% CHO = 5 gm x 4 = 20 kcal
Total = 65.5 kcal
Cup of milk = 200 cc = 200 gm
One table spoonful = 15 cc = 15 gm
One tea spoonful = 5 cc = 5 gm
One tea spoonful of oil = 5 gm x 9 = 45 kcal
= = = = sugar = 5 gm x 4 = 20
Anaerobic & aerobic pathways:
For the 1
st
or 2
nd
minutes of exercise, oxygen has not
arrived at the muscles & energy must come from
anaerobic sources. After several minutes aerobic pathway
takes over, & as the exercise continues, there is a constant
interchange or use of energy sources, which depends on:
1- The intensity ,2- length of exercise, 3- the
person’s fitness level, 4- the food eaten.
Short term, high intensity activities (e.g. sprinting) rely
mostly on the anaerobic pathway & only CHO (from
muscle glycogen) can be used.
Exercise of low to moderate intensity is supported by
aerobic system & both CHO & fats are utilized. Fats are
an important energy source during exercise, because the
fatty acids are abundant in the body & using them spares
muscle glycogen.
Long term activity, the fat becomes the primary source of
energy.
Sedentary person breaks down glycogen faster (lactic acid
accumulated in the tissues causing muscle fatigue), but
physically fit person has a higher aerobic capacity i.e.
more fat than glycogen is used
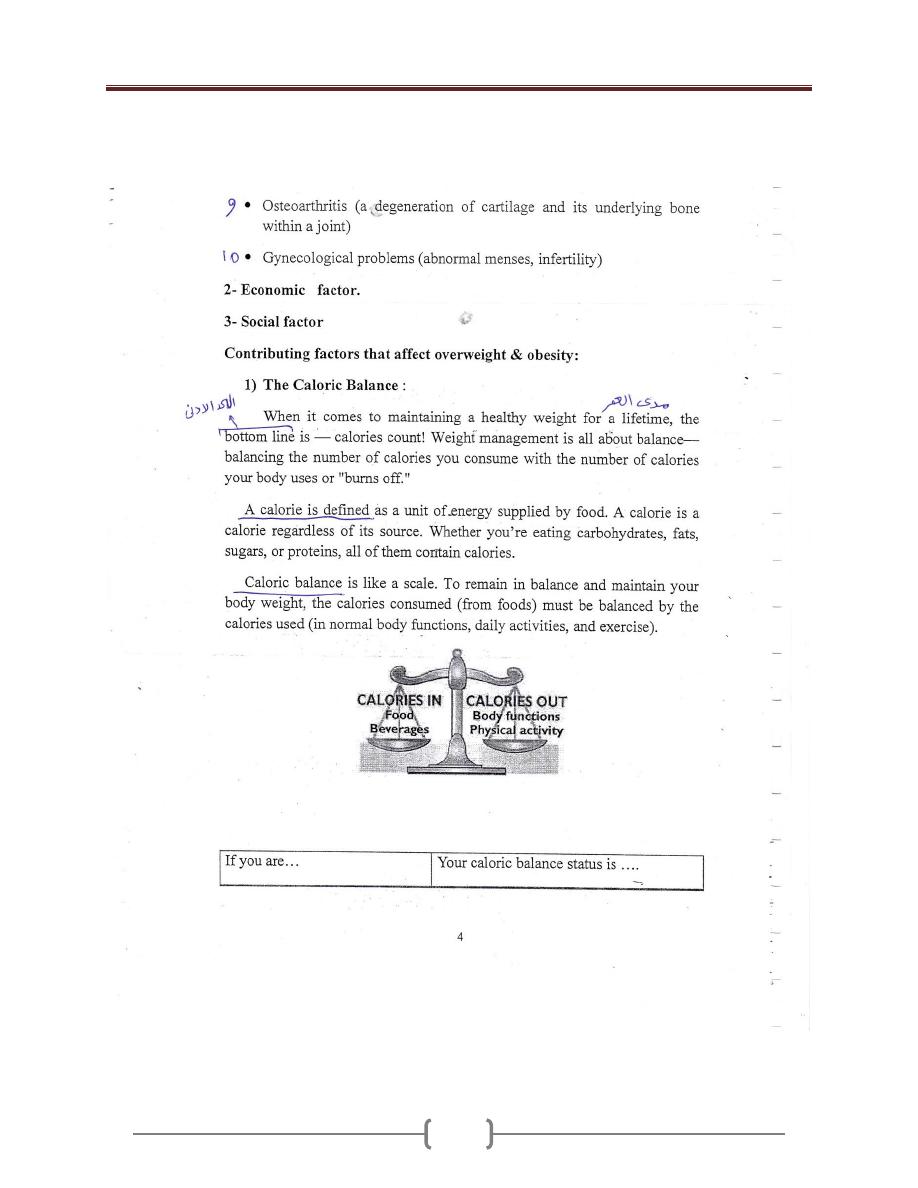
Total energy requirement (TER):
This depends on summation of 3 factors;
1 - Basal metabolism.
2- Physical activity.
3- Specific dynamic action of food (S.D.A.) = thermic
effect of food (TEF)
= . التأثير الديناميكي النوعي لألطعمة
4-Other factors like growth, pregnancy, lactation &
temperature regulation.
Energy requirement =BMR+ physical activity +TEF
Lab 2 – Energy
48
1)
Basal Metabolism (BMR) ( معدل االستقالب االساسي=
Basal energy requirement = resting metabolic rate:
Which is the minimum amount of energy needed by the
body at rest in fasting state (post absorptive state) to
sustain life processes, basal energy expenditure is
measured as BMR by direct& indirect calorimeter
Condition to measures BMR: the person should be;
At complete physical& mental rest.
Relaxed but not sleep.
At least 12 h. after last meal.
Several hours after strenuous exercise or activity.
In a comfortable temp. & environment
To calculate the energy requirement for BMR:
BMR for male = I.B.W.(kg) × 1 Kcal/ kg / hr × 24hr
BMR for female= I.B.W.(kg) × 0.95 Kcal /kg/hr × 24hr
I.B.W.= ideal body wt.
2) Physical Activity:
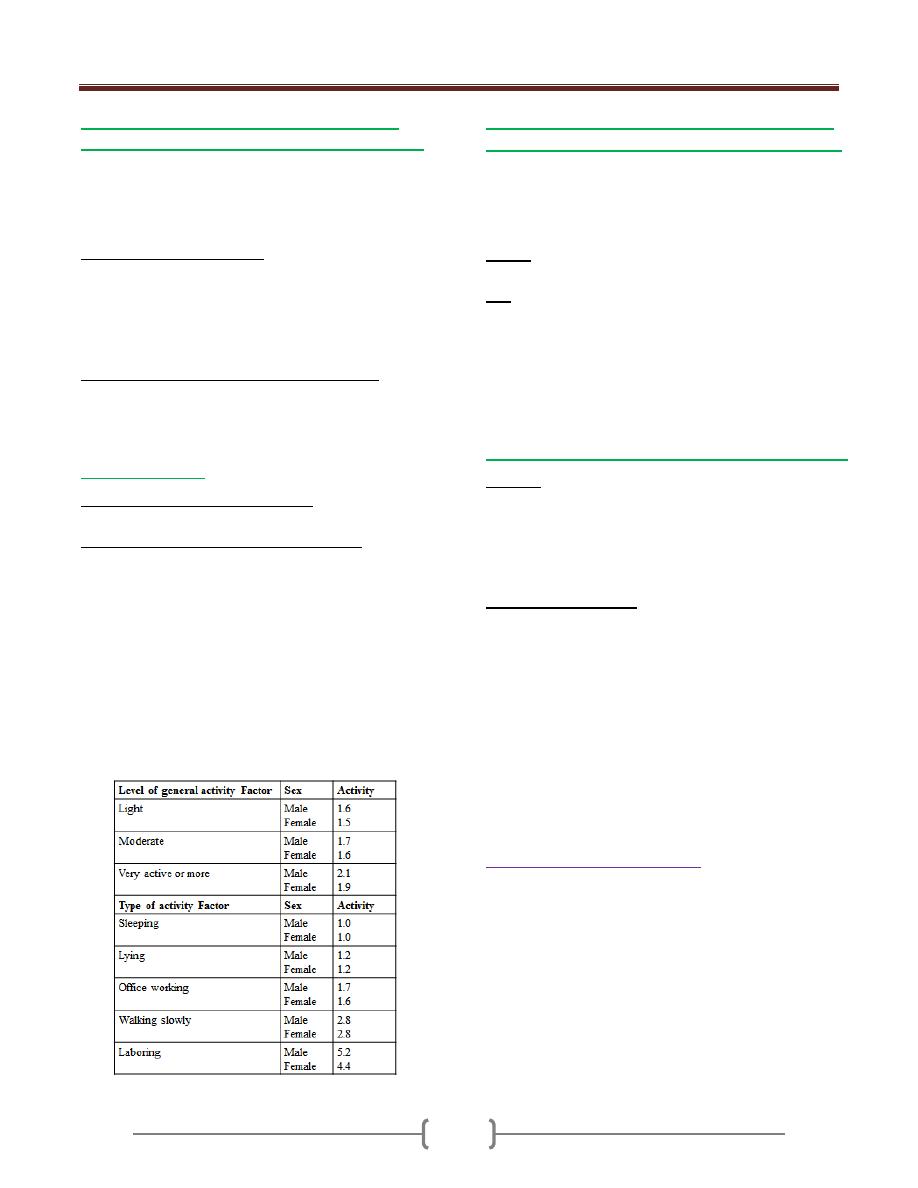
To calculate physical activity either;
Physical activity=BMR × activity factor
Rough classification of occupation(activity);
Light activity (sedentary)=30% of BMR: office
worker, lawyer, doctor, teacher, shop worker, house
cleaning.
Moderate activity= 50% of BMR: industrial worker,
farmer, student, solder (not in active service),
housewife, carrying a load & cycling.
Heavy activity (75-100% of BMR): agriculture
worker, unskilled laborer, mine worker, solder in
active service, &walking with a load uphill.
NOTE: mental activity dose not appreciably affect the
energy requirement.
3) Specific Dynamic Action of food (SDA)= Thermic
Effect of Food(TEF) = diet induced thermo genesis:
Which is the extra energy released due to digestion,
absorption, &metabolism of food reaches its maximum
level 3-5 hours after ingestion of food.
This effect is not equal for all type of food;
TEF of: protein= 25-30% of BMR, CHO = 6% of BM,
fat = 4% of BMR, for mixed diet= 10% of BMR
E.g. Calculate the total energy requirement (TER) of a 4th
year medical male student whose ideal body wt. is 60kg?
(moderately active male)
BMR = 60kg × 1 Kcal/kg/hr × 24hr =1440 Kcal/day
Physical activity = 1440 Kcal/day × 1.7 = 2448 Kcal/day
TEF = 10% × 1440 Kcal/day = 144 Kcal/day
TER= 2448+ 144 =2392 Kcal/day
4) Other factors; Like growth, pregnancy & lactation:
Growth: additional energy is required to cover the cost of
increasing B.wt.& Ht., a growing infant may store 12-15% of
energy expenditure for growth & formation of new tissues.
When the child gets older , his rate of growth is diminish
&the caloric requirement for growth is reduced but the
TER is increased because of increased body size.
Pregnancy &Lactation:
Additional calories are required to meet the energy cost of
pregnancy &lactation will add to the TER of normal women
In pregnancy 300 Kcal/day (esp. in 3rd trimester)
In lactation 500 Kcal/day will added
E.g. Calculate the TER of 60kg housewife woman?
BMR= 60kg × 0.95Kcal/kg/hr × 24hr =1368Kcal/day
Phys. Act. =1368 Kcal/day × 1.6 = 2188.8 Kcal/day
TEF = 10% × 1368 Kcal/day = 136.8 Kcal/day
2188.8+ 136.8 = 2325.6
If she is pregnant add 300 Kacl/day
If she is lactating add 500 Kcal/day
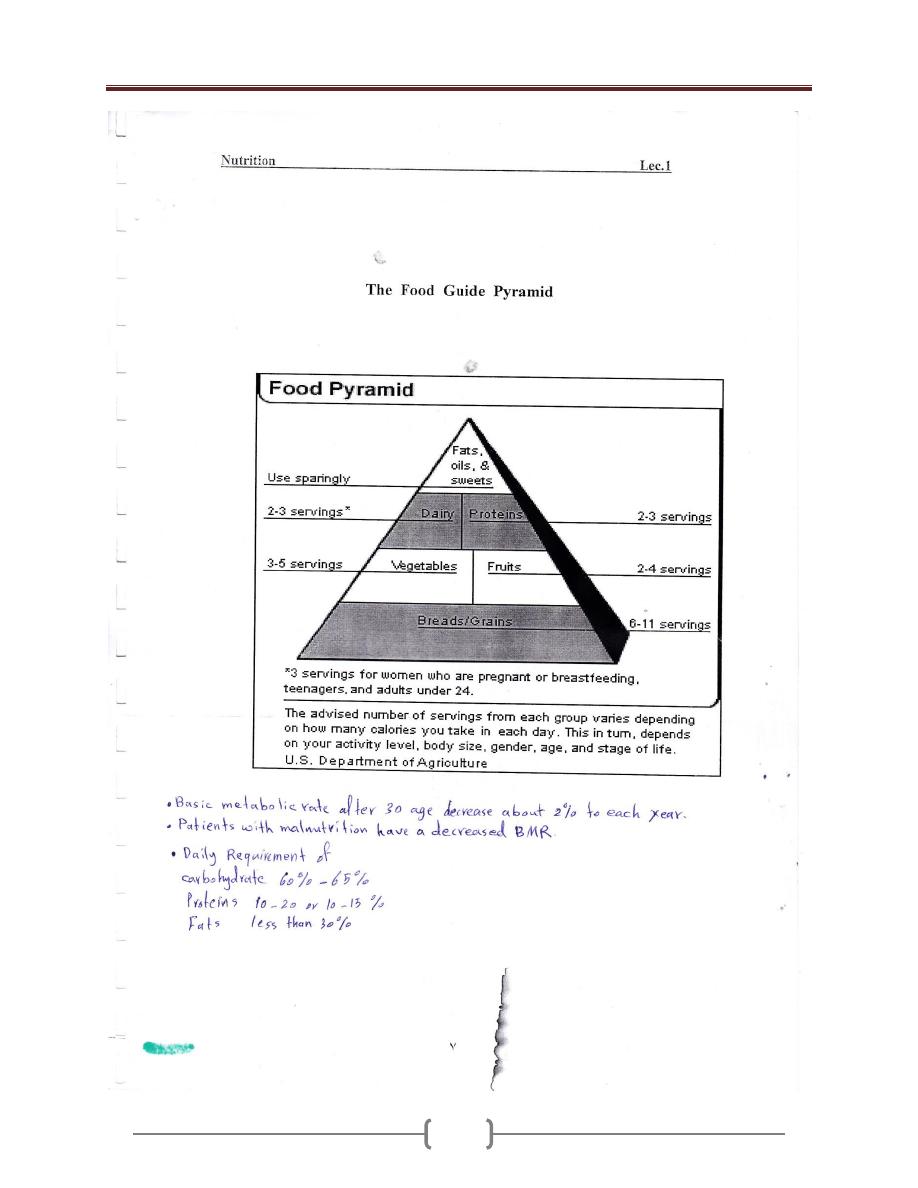
Adequate diet (Balanced diet):
Is the diet that composed of various nutrients that the body
needs for maintenance, repair & the living process of growth
& development (in children) & to meet all the nutritional &
energy requirement of a person. It should contain; protein,
CHO, fat, vitamins, minerals, fibers& water.
The percentage of various nutrients to the total calories
intake; Protein10-20% , fat 20-30%, CHO 50-60% of total
calories (or according to the food guide pyramid). The
intake more than two third of the R.I. of nutrients are
considered adequate.

Lab 3 – Food Pyramid
49
Water
What are the recommended servings of water/ day?
Women: Drink 9 cups (72 oz) per day
Men: Drink 12 cups (100 oz) per day
Why should you drink water?
It is an essential nutrient and makes up > 60% of adult
body weight
It is needed for all body functions, such as nutrient
digestion, absorption, transport, and metabolism
It aids in body-temperature maintenance
It is vital to electrolyte balance
It helps lubricate and cushion joints
Water contains no calories or fat
May help with weight loss by acting as a natural appetite
suppressant
Prevents complications from dehydration, such as
headache or fatigue
May benefit people with respiratory diseases by thinning
mucous secretions that worsen asthma
May help people who experience recurrent urinary tract
infections by increasing their urine flow
May help reduce cancer risk of the colon, kidneys,
bladder
Increase water consumption
Person may need to increase water consumption in
many conditions like
Exercise
Short bouts of exercise:
Consume an extra 1.5 to 2.5 cups of water
Intense exercise lasting >1 hour:
During sustained hard exercise, especially in a hot
environment, person needs at least 2 cups of water
before exercising and 1 cup of water every 20 minutes
while exercising.
Pregnancy
Pregnant should drink 2.3 liters (about 10 cups) per day
Women who breastfeed should drink 3.1 liters (about 13
cups) per day.
Environment
Increase fluid intake under these conditions:
Hot or humid climates
During/after sun exposure
In heated, indoor air
In cold weather while wearing insulated clothing
At high altitudes
Diarrhea
Increase fluid intake when tolerable. Avoid milk, instead
consume clear fluids such as: water, tea, juice, or
carbonated water when possible. Diarrhea
Cold/Flu
Increase fluid intake when tolerable. Consume at least the daily
recommendation of water and electrolytes throughout the day.
Grains
What are the recommended servings of grains &
starchy vegetables per day?
4 -11 servings per day. For optimal health, we
recommend mostly whole grains versus processed or
refined grains.
What are whole grains?
Grains are the seeds of plants. Whole grains contain all
parts of the grain, including the bran, endosperm & germ.
Bran- Forming the outer layer of the seed, the bran is a
rich source of niacin, thiamin, riboflavin, magnesium,
phosphorus, iron and zinc. The bran also contains the
majority of the seed's fiber.
Germ- A concentrated source of niacin, thiamin,
riboflavin, vitamin E, magnesium, phosphorus, iron and
zinc. The germ also contains protein and fat.
Endosperm- Also called the kernel, the endosperm makes
up the bulk of the seed. It contains most of the grain's
protein and carbohydrate and has small amounts of
vitamins and minerals
What are processed and refined grains?
Unlike whole grains that contain at least part of their bran
and germ layers, processed and refined grains have both
the bran and germ removed during processing; therefore
all of the nutrients in these layers are also removed.
They are often “enriched” which means nutrients that
were lost during food processing are added back. For
example, B vitamins, lost when wheat is refined, are
added back to white flour during processing. However,
even after enrichment, refined grains often do not provide
as many nutrients or as much fiber as their whole grain
counterparts
While whole grains are preferred, adding fiber-rich foods to
refined or processed grains can lower the glycemic impact
& help to stabilize blood sugar. Therefore, foods such as
pasta and white rice can be part of a healthy diet when
combined with high fiber foods such as vegetables or beans

Lab 3 – Food Pyramid
50
Why choose whole grains and starchy vegetables?
They are rich sources of fiber and naturally low in fat
Whole grains and starchy vegetables are an important
source of vitamins and minerals, such as B vitamins,
vitamin E, folate, selenium, zinc and iron
They contain a variety of phytochemicals and
Foods in this group usually have a low glycemic index,
which helps to regulate blood sugar levels
Consumption of whole grains is associated with reduced
risk of type 2 diabetes, constipation, diverticulitis,
obesity, heart disease, and some types of cancer
Fruits & Vegetables
What are the recommended servings per day?
Overall: more than 7 servings
Vegetables: unlimited (minimum 5 servings)
Fruits: 2-4 servings
Why should you choose fruits & vegetables?
Excellent source of fiber
Rich in vitamins and minerals including folate,
potassium, vitamins A and C
Low in calories and fat-free-Except for avocados
which are a good source of Healthy Fat
Provide a food source of water; fruits and vegetables
are made up of more than 50% water
Abundant in phytochemicals and antioxidants
Most are low on the glycemic index
High consumption helps reduce risk of various diseases
such as cancer, obesity, heart disease, stroke, arthritis,
asthma, macular degeneration & diverticulosis
Increasing fruit &vegetable intake decreases risk
of unhealthy
Legumes (Peans, Peas & Lentils)
What are the recommended servings per day?
1-3 servings per day
Low in fat
Excellent source of protein & fiber
Contain iron, zinc, calcium, selenium, and folate
Rich in antioxidants
Provide a low glycemic index (GI) / glycemic load (GL)
May help reduce the risk of chronic diseases, such as,
heart disease, diabetes mellitus, obesity and cancer
Legumes are inexpensive and easy to prepare
Lean Meats
What are the recommended servings per week?
Optional*: 1-3 servings per week
Why choose lean meat?
Good source of complete protein
Rich iron source
Contains B vitamins, specifically B-12
Contains less saturated fat than higher fat meats
Dairy Products
Optional: 1-3 serving per day
Low-fat Dairy Sources Serving Size
Low-fat kefir 1 Cup
Low-fat/non-fat yogurt 1 Cup
Low-fat/non-fat frozen yogurt 1 Cup
Low-fat/non-fat cottage cheese ½ Cup
Low-fat/non-fat cream cheese 1 Tbsp
Low-fat/non-fat sour cream 2 Tbs
Why choose low-fat/non-fat dairy products?
Dairy foods are some of the richest sources of calcium,
an important nutrient for bones, teeth and cell function
They are high in protein, vitamin B12 and other minerals
such as selenium, zinc, phosphorus, potassium and
magnesium
Most milk is fortified with vitamin D, which helps the
small intestine absorb calcium
Low-fat and fat-free milk are also typically fortified with
vitamin A, which is lost in the removal of milk fat
Selecting low-fat/non-fat dairy products helps reduce total
and saturated fat intake and calories
Fish & Seafood
What are the recommended servings of fish & seafood?
Optional*: 2-4 servings per week, including at least 2
servings of fish with high omega-3 content (Serving size
4-6 ounces) individual needs.
Why should you choose fish & seafood?
Low in saturated fat
Rich source of protein and iron
Contains B vitamins, including B-12
Promotes normal fetal growth and child development
Richest source of omega-3 fatty acids, which may be
helpful in the prevention and treatment of:

Lab 3 – Food Pyramid
51
Heart disease, high blood pressure, inflammation, mental
health disorders, diabetes, digestive disorders,
autoimmune disease, cancer Omega-3 fatty acids are a
type of polyunsaturated fatty acid (PUFA). They are an
essential component of the human diet because our bodies
cannot make them. These fats are necessary for proper
brain growth and development. Omega-3s are most
abundant in deep-water fatty fish and some plant foods.
They have anti-inflammatory effects on the body
Omega-3 fatty acids are a type of polyunsaturated fatty
acid (PUFA). They are an essential component of the
human diet because our bodies cannot make them. These
fats are necessary for proper brain growth and
development. Omega-3s are most abundant in deep-water
fatty fish and some plant foods. They have anti-
inflammatory effects on the body
Seasonings
What are the recommended servings per day?
Use a variety of spices, herbs, and alliums in your daily
food preparation. Experiment cautiously with hot peppers.
Why choose a variety of seasonings?
Seasonings are grown for their culinary & medicinal
properties
They may be helpful in many medical conditions, such as:
Nausea, Infections, Cancer, Inflammatory conditions,
autoimmune disorders, High blood pressure & High
cholesterol
Eggs
What are the recommended servings per day?
Optional*: Average 1 per day
Why choose eggs?
Protein, Vitamin, and Mineral Content
Egg white protein quality is used as the gold standard for
comparison with other proteins
Whole eggs offer almost every essential vitamin & mineral
needed by humans, with the exception of vitamin C
Egg yolks contain an array of essential vitamins, such as
vitamins A, D, E, & K, which are not found in egg whites
Source of Carotenoids: Lutein and Zeaxanthin
One egg yolk, on average, contains significant amounts of
the two carotenoids, lutein and zeaxanthin
Research shows that individuals who consume a greater
number of foods rich in lutein and zeaxanthin have a
lower risk for age related macular degeneration and heart
disease
Eggs contain cholesterol, a waxy substance found only
in animal products
Dietary cholesterol, like that in egg yolks, had been
implicated in increasing blood cholesterol levels
Fats
What are the recommended servings per day?
3-9 servings per day (see serving sizes below)
What are the different types of healthy fats & oils?
Fats & oils are made up of basic units called fatty acids.
Each type of fat or oil is a mixture of different fatty acids.
Monounsaturated Fatty Acids (MUFA) are found
mainly in vegetable oils, nuts, seeds, olives and
avocadoes. They are liquid at room temperature.
Polyunsaturated Fatty Acids (PUFA) are found mainly
in vegetable oils, fish and seafood. They are liquid or soft
at room temperature. Omega-3 and omega-6 fatty acids
are types of PUFA and are considered essential fatty acids
because our bodies cannot make them, thus they must be
obtained through the diet.
Saturated Fatty Acids are usually solid at room
temperature and are found mainly in foods from animal
sources like meat, and dairy products, like butter and
cheese. Some vegetable oils such as coconut, palm kernel
and palm oil also contain saturated fat.
Trans Fatty Acids are liquid vegetable oils that have
been chemically processed to become semisolid at room
temperature through the addition of hydrogen
atoms. Trans fatty acids, also called “partially
hydrogenated” oils, are used in some margarines, fried
foods, and process snack foods to improve the flavor,
texture and shelf-life .
Conjugated Linoleic Acid (CLA) is a naturally occurring
trans fatty acid found in the meat and dairy products of
ruminant animals (such as cows, sheep, goats, and deer),
as well as eggs. CLA is not associated with the negative
health impacts of artificially produced trans fatty acids
and may impart some health benefits, though current
research findings are controversial. CLAs are not included
in the Trans fatty acid listing on a nutrition label.
Why choose healthy fats like MUFA & omega-3s?
• They provide antioxidants such as vitamin E & selenium

Lab 3 – Food Pyramid
52
• Small amounts of healthy fats help the body absorb vital
nutrients, including fat soluble vitamins (A, E, D, K) from
other whole foods
• Including healthy fatty acids in your diet in appropriate
quantities can help prevent and treat: diabetes, heart
disease, cancer, obesity, musculo skeletal pain, and
inflammatory conditions
• Some research suggests that diets including MUFA can
have a beneficial effect on cholesterol, blood pressure,
blood clotting and inflammation
• Omega-3 fatty acids are necessary for proper brain
growth and development. They are anti-inflammatory
and may be helpful in the prevention and treatment of
many diseases.
Why limit saturated fats, trans-fats & omega-6
fatty acids?
Saturated fat eaten in excessive amounts is the main
culprit in raising total and LDL (“ bad”) cholesterol,
which can increase risk of heart disease.
High saturated fat intake may also contribute to increasing
the risk of obesity, diabetes, and cancer.
Trans fatty acids act like saturated fats in the body and
raise LDL cholesterol levels. Unlike saturated fats, trans
fatty acids also lower HDL (“good”) cholesterol.
Additionally, trans fatty acids may increase risk and
incidence of type 2 diabetes, and may compromise fetal
and early infant growth and development.
Omega-6 fatty acids are essential PUFAs found in
vegetable oils commonly used in processed foods
containing corn, safflower, and soybean oils. While
omega-6 fatty acids are necessary for a balanced diet, we
often consume them in overabundance.
Consuming significantly more omega-6 fatty acids than
omega-3 fatty acids, like most American’s do, contributes
to an increased risk of chronic diseases and promotes
inflammation.
Tea
What are the recommended servings per day?
2-4 cups per day
Why should you drink tea?
Teas are rich in antioxidants called polyphenols which
are plant chemicals that may help prevent cancer, heart
disease, metabolic syndrome, hypertension, stroke,
obesity, arthritis, and other diseases.
TER=1600 Calory
Grains = 6 serv.
Vegetables = 3 serv
Fruits = 2 serv
legumes = 1-2 serv
Dairy = 2-3serv
Oil = 53 gm
Sugar = 6 tsf
TER=2200 Calory
Grains = 9 serv.
Vegetables = 4 serv
Fruits = 3 serv
legumes = 2-3 serv
Dairy = 2-3serv
Meat , fish = 3 oz
Oil = 73 gm
Sugar = 12 tsf
TER=2800 Calory
Grains = 11 serv.
Vegetables = 5 serv
Fruits = 4 serv
Legumes = 3 serv
Dairy = 2-3serv
Meat , fish = 4 oz
Oil = 93 gm
Sugar = 18 tsf
53
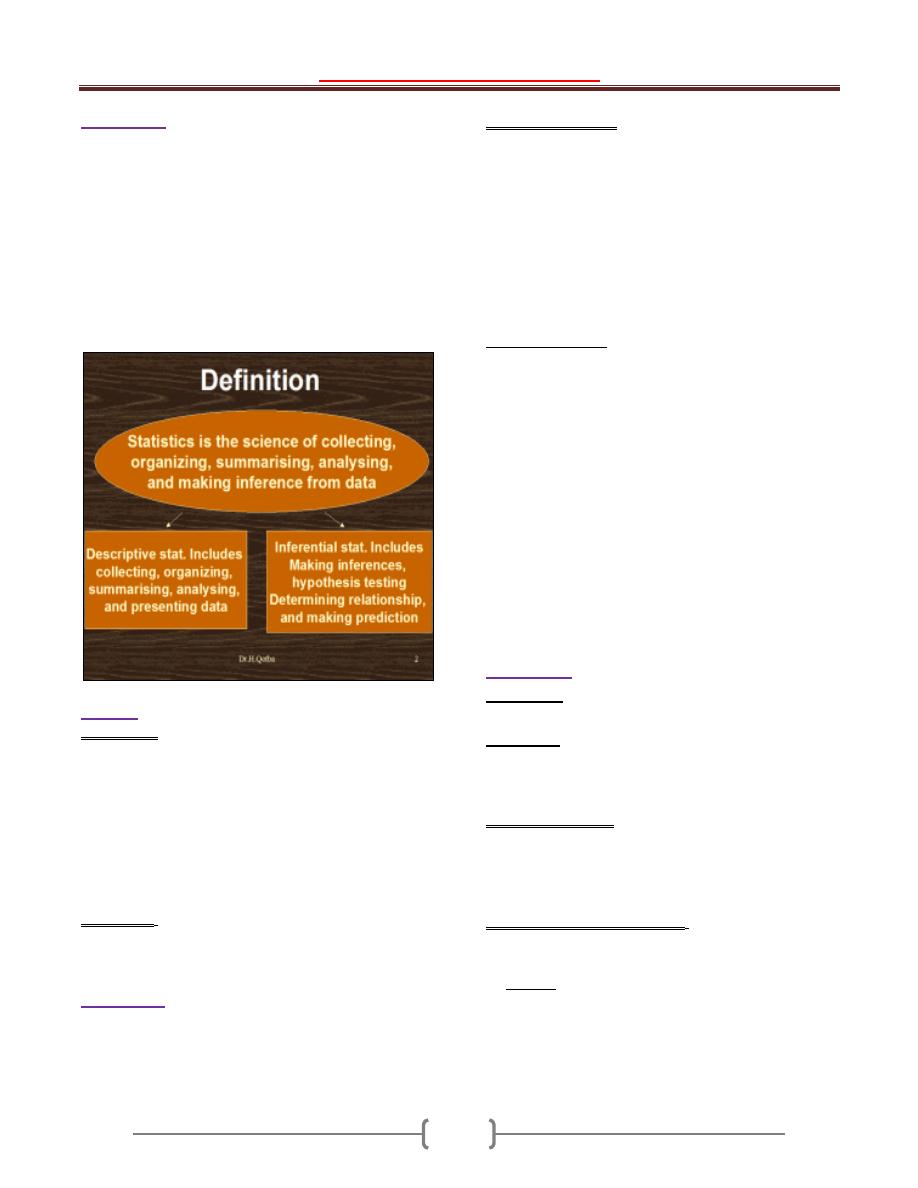
Introduction
-
Lecture 1+2
54
Introduction.
"The importance of medical statistics"
*"Smoking cigarettes causes lung cancer". This is now a
somewhat uninteresting fact because it is such common
knowledge, yet 60 years ago relatively few people were
aware of this. It has only been with the aid of research
methods and statistical techniques that such a
consequence of smoking was introduced to society and is
now well accepted. Research has since shown us
numerous other diseases that are caused by smoking. As a
result of people giving up smoking, there has been a
dramatic reduction in deaths in many countries.
Statistic
is the field of study which can be classified into;
1) Descriptive: Concern with collection, classification,
organization and summarization (reduction) of the data.
((They are merely descriptive & used to describe the basic
features of the data in a study. They provide simple
summaries about the measures make no attempt to draw
conclusion)). They can be:
a- Tabular ((tables)).
b- Diagrammatic ((Figures)).
c- Numerical ((Numbers)).
2) Inferential: Concern with drawing conclusions from the
data that extend beyond the immediate data alone. The
conclusion drawn will influence sub- sequent decision.
Biostatistics
:
The statistics that concern with biological
& medical aspects.
Uses of Biostatistics:
1) Measure & analyze the health status and health problems
in the community.
2) Compare the health status of the community with others.
3) Planning for the health services.
4) Evaluation of the health services & estimation the future
needs.
5) For research purposes. "Statistics is vital & central to
most medical research".
6) Evaluation of published paper.
Learning objective: To understand the basic statistical
principles commonly used in Public Health.
We are living in the information age, the information
about which we are concerned are called data (raw
material of statistics) and these data are a available to us
in form of numbers (values). Two kinds of number are
used in statistics;
1) Numbers (values) that result from the process of
counting "Frequencies" e.g. No. of patient admitted
to the hospital per day, No. of teeth……etc.
2) Number (values) that result from measurement e.g.
B.P, WT, and HT……etc.
3) Sources of data: 1- Experiment. 2- Survey.
3- Routinely kept records.
4) External sources e.g. published reports, Internet.
Quantities;
can be classified into:
1)
Constants,
quantities which are not vary e.g. ח
= 3.14,
this type not need statistical analysis.
2)
Variables
, quantities which vary (take different values
in different person, place, &/or time e.g. WT, HT,
BP..etc; this type need statistical analysis.( Statistics
deals with variables )
Random variable;
Is the variable that arises as a result of chance factors, so
can't be exactly predicted in advance. e.g. HT, WT,
when a child born, we can't predict exactly his/her HT or
WT at maturity.
Variables are subdivided into;
1) Quantitative (Numerical); can be measured by the usual
sense e.g. age, WT, HT….etc. This can be either:
a) Discrete, taking some value in discontinues set of
value (charect by a gap or interruption, have no
fraction) e.g. No. of teeth, No. of admissions, Number
of children, Number of attacks of asthma per
week….etc..
Introduction
-
Lecture 1+2
55
b) Continuous, taking some value in an infinity divisible
range of value (doesn’t possess a gap or interruption,
have a fraction, we can find another value somewhere
in between) e.g. WT, HT, Serum cholesterol, Blood
sugar….etc.
2) Qualitative (Categorical); can't be measured by the
usual sense but must describe in category. This can be
either:
a) Nominal, defined by un ordered categories. E.g., color
of the eye, blood group, sex, marital state….etc.
(Nominal variable with only two probabilities is called
"dichotomous variable" e.g., life or death, sick or
not ….etc.
b) Ordinal, defined by ordered categories. E.g.,
educational state categorized into primary, secondary
and higher education, Cancer staging I, II, III……etc.
Notes;
I. It is important to be able to distinguish different types of
data from one another as we use different techniques to
describe and analyses the different types.
II. Numerical variables can be converted to Categorical one
by using "cut off points". For example, blood pressure can
be turned into a nominal variable by defining
"hypertension" as a diastolic blood pressure greater than
90 mmHg, and "normotension" as blood pressure less
than or equal to 90 mmHg. Height (continuous) can be
converted into "short", average" or "tall" (ordinal). In
general it is easier to summarize categorical variables, and
so quantitative variables are often converted to categorical
ones for descriptive purposes as in make a clinical
decision on serum potassium level, one does not need to
know the exact serum potassium level (continuous) but
whether it is within the normal range (nominal) also It
may be easier to think of the proportion of the population
who are hypertensive than the distribution of blood
pressure.
Ordered array
: When we arrange our data in order of
magnitude from the smallest value to the largest value
((organization of the data)).
Ex; (9, 2, 5, 7, 3, 1) → In ordered array→ (1, 2, 3, 5, 7,
9).
Grouped data:
A technique used for systematically
arranging a collection of observations to indicate the
frequency of occurrence of the different values of these
observations ((summarization of the data)).
To group a set of observations, we select a set of
contiguous, non overlapping intervals in such away that
each value in the set of observation can be placed in one
interval only, these intervals usually called "class-
intervals". The no. of values falling in each class interval
is called "Frequency distribution". Ex. Frequency
distribution of Ht in cm of 61 subjects.
Class interval Ht(cm)
Frequency
100-119
120-129
130-139
140-149
≥150
5
19
10
13
4
Total
61
General rules for forming frequency distribution of
grouped data.
1) Count the number of intervals by using "Sturge's rule":
K = 1+ 3.322 log n (k = no. of class interval, n =
sample size).
2) Find the width ((W)) of the intervals. The class intervals
should be of the same width. W = Range (R) / K ,
R = largest value - smallest one
Ex; The Wt of malignant tumor (in gm) removed from the
abdomen of 57 subjects are 68, 63, 42, 27, 30, 36, 28, 32,
79, 27, 22, 23, 24, 25, 44, 65, 43, 25, 74, 51, 36, 42, 28,
31, 28, 25, 45, 12, 57, 51, 12, 32, 49, 38, 42, 27, 31, 50,
38, 21, 16, 24, 69, 47, 23, 22, 43, 27, 49, 28, 23, 19, 46,
30, 43, 49, 12.
Construct the frequency distribution by calculating the
suitable no. of class intervals.
K = 1+ 3.322 log n = 1+ 3.322log
57
= 1 +
3.322(1.755) = 7
W = R/K = (79-12) / 7 = 9.6 ~ 10
Class interval Wt(kg)
Frequency
10 – 19
20 - 29
30 - 39
40 - 49
50 - 59
60 - 69
70 - 79
5
19
10
13
4
4
2
Total
57

Introduction
-
Lecture 1+2
56
Note. Too few intervals are undesirable because of the
resulting loss of information, and too many intervals will
not meet the objective of summarization.
The Mid-Point of the class interval is obtaining by
computing the mean of the upper & lower limits of the
interval.
The Cumulative Frequency; is the frequency regarding
two or more intervals.
The Relative Frequency; is the proportion of value with
in each class interval. This is obtained by dividing the
class frequency by the total frequency for all classes x
100((usually express as percentage)).
The Cumulative Relative Frequency; is the relative
frequency for two or more class intervals ((also usually
express as percentage)).
Ex1: Frequency, cumulative frequency, relative
frequency, & cumulative relative frequency for the
previous example.
EX2: The following are fasting blood glucose level
(mg\dl) of 20 children: 56, 61, 57, 79, 62, 75, 63, 58, 64,
60, 60, 57, 61, 57, 67, 62, 69, 67, 68, &59. From these
data construct a frequency distribution, a relative
frequency distribution, a cumulative frequency and a
cumulative relative frequency.
Solution:
K= 1+ 3.32 log n = 1+ 3.322log
20
= 1 +
3.322(1.3010) = 5.3 ~ 5
W = R/K = (79-56)/5 = 4.6 ~ 5
Class
interval
Wt(kg)
Mid-
Point
Freq
uenc
y
Cumu
lative
freque
ncy
Relativ
e
Freque
ncy
(%)
Cumulat
ive
relative
Frequen
cy (%)
10 - 19
20 - 29
30 - 39
40 - 49
50 - 59
60 - 69
70 - 79
14.5
24.5
34.5
44.5
54.5
64.5
74.5
5
19
10
13
4
4
2
5
24
34
47
51
55
57
8.77
33.33
17.54
22.81
7.02
7.02
3.51
8.77
42.10
59.64
82.45
89.47
96.49
100.00
Total
57
100
Class
interval
FBS
(mg\dl)
Frequ
ency
Cumulative
frequency
Relative
Frequency
(%)
Cumulative
relative
Frequency
(%)
56-60
61-65
66-70
71-75
76-80
8
6
4
1
1
8
14
18
19
20
40
30
20
5
5
40
70
90
95
100
Total
20
100
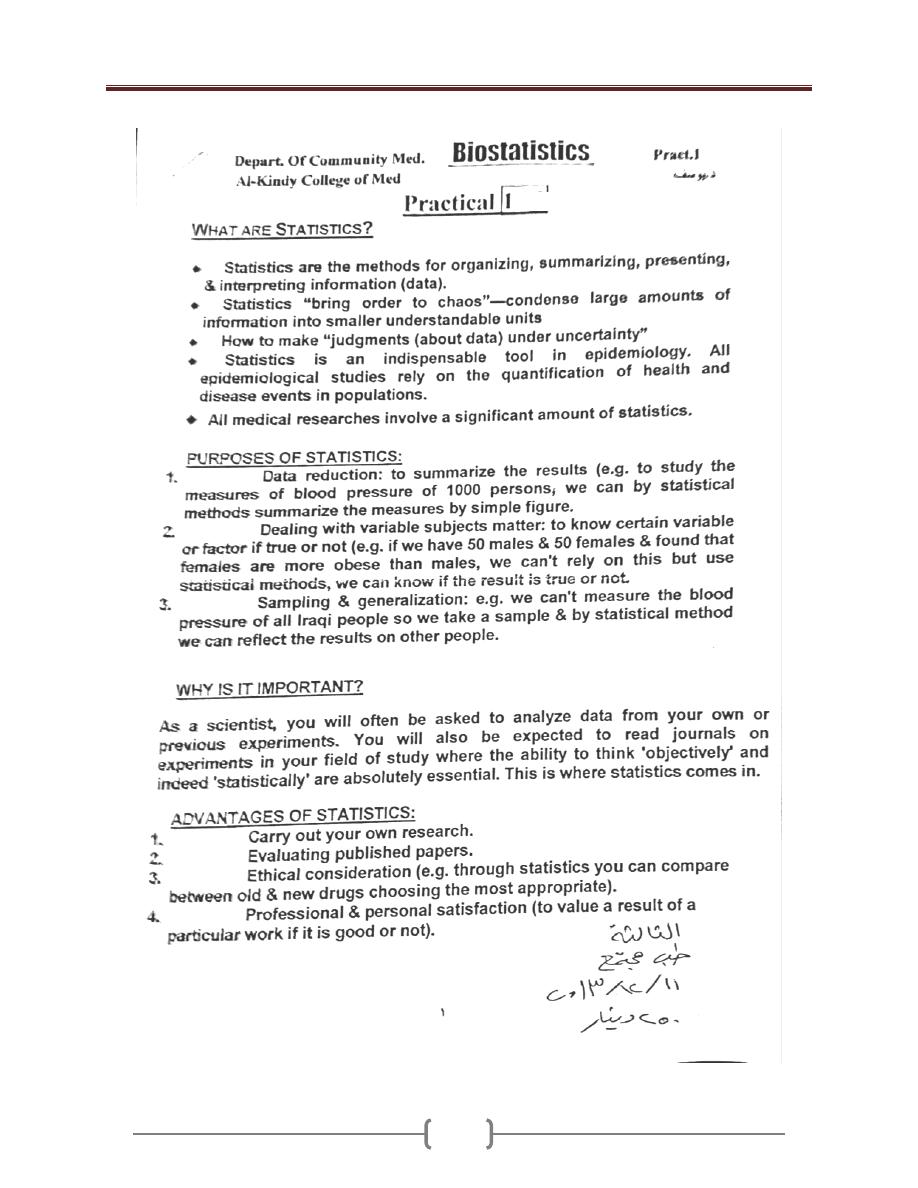
Lecture 1+2 - Introduction
57
h
h
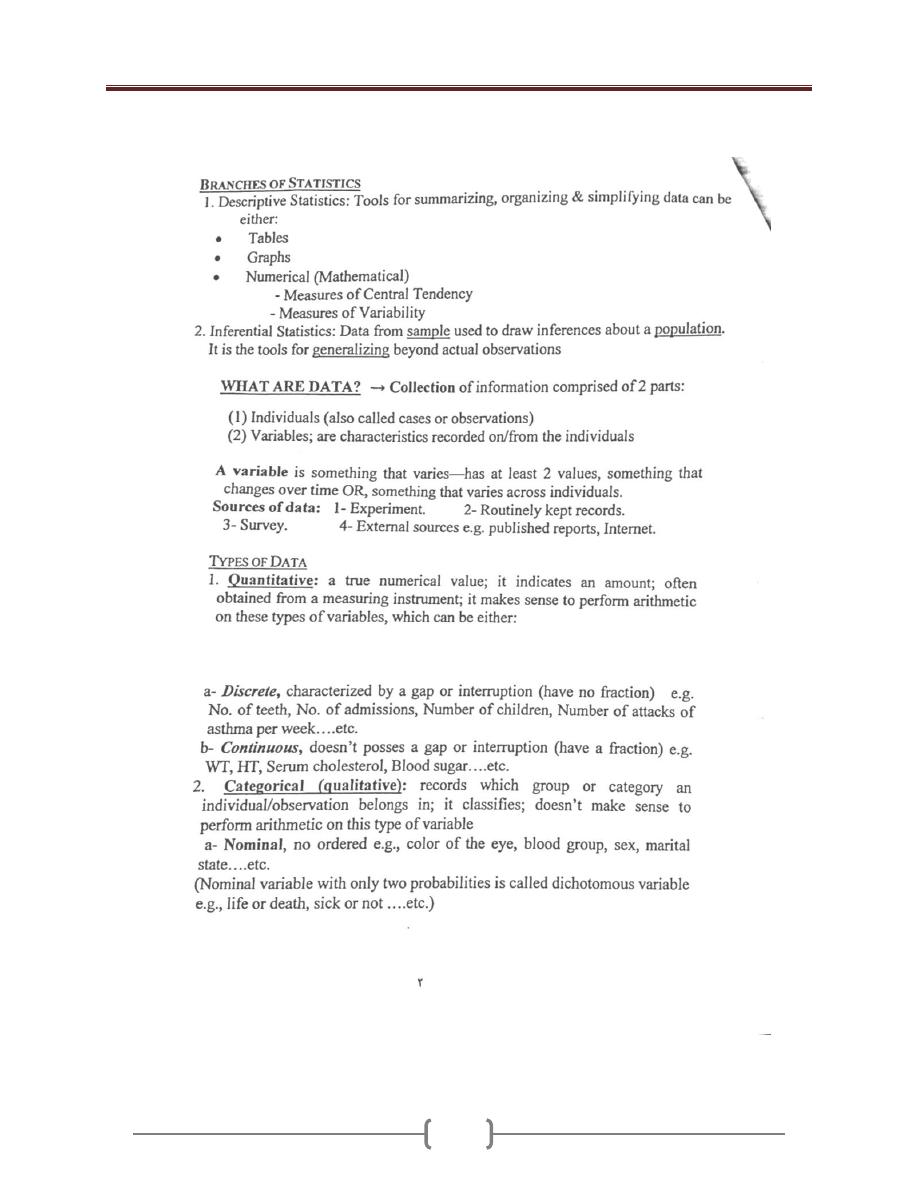
Lecture 1+2 - Introduction
58
Lecture 1+2 - Introduction
59
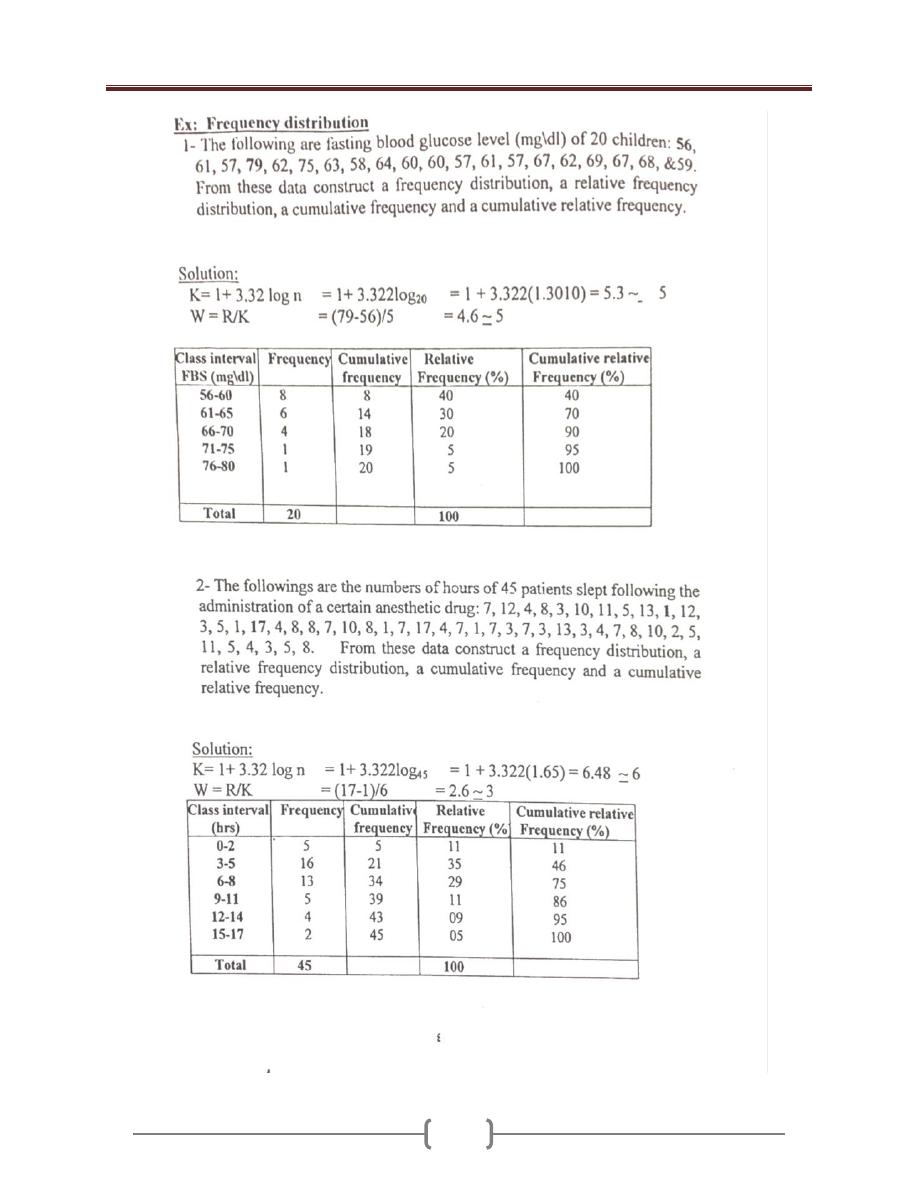
Lecture 1+2 - Introduction
60

Lecture 1+2 - Introduction
61
Population, Sample & Sampling Methods
Population:
largest collection from which we have an
interest at particular time. (Collection of entire people
you want to understand), Could be:
1) Entities; peoples, animals, plants…. etc. ((people of
unit)).
2) Variables; Wt, Ht, serum cholesterol…etc. ((people of
observation)).
If a population of value consists of fixed number of these
value→ ''Finite population", but it consists of an endless
values → "Infinite population"
Sample;
A limit number of values drawn from the
population ((part of population intended to represent the
population)), could be either entities or variables.
Parameters: A descriptive measure computed from the
data of population.
Statistics: A descriptive measure computed from the
data of a sample.
Statistical inference: Is the condition concerning a
people on the basis of the information obtained from a
sample drawn from that population.
Generalizations: will depend on how well the sample
represents the population.
Representative sample = Sample whose characteristics
are similar to population.
EX1: Since blood tests are costly to administer, a sample
of n=20 children were selected from the N=293 of a
particular school. These 20 were given the test and, based
on their results; a statement is made concerning the blood
levels of all 293 children in the school.
Note: If a sample is NOT drawn in an appropriate manner
from a population, it may not be representative of that
population. In that case, results from the sample may not
be generalizable to the population.
EX2: Thirty-six percent of the adult Iraqi population has
an allergy. A sample of 1200 randomly selected adults
resulted in 33% having an allergy. Describe each of the
six terms.
POPULATION: all Iraqi adults.
SAMPLE: the 1200 adults.
VARIABLE: allergy status.
DATA: yes/no responses to questions concerning
existence of allergies
PARAMETER: percentage of all (US---Iraqi) adults with
an allergy.
STATISTIC: 33% from the sample
Why we not collect data from the whole population?
Sometimes impractical, often impossible! But if we
cannot measure everyone in the population, that does not
mean we cannot study populations or make any
conclusions about them. →Data from a sample can tell
us something about a population. For example, to find
out the immunization coverage of a district, not all the
children in the district have to be surveyed - one could
take a random sample and still estimate the coverage with
good accuracy.
Sampling error: The difference between sample measure
and its correspondent population measure.
Parameter = Values describing POPULATIONS
Greek letters
(Mean),
2
(Variance),
(Standard deviation)
Statistics = Values describing SAMPLES
English letters
X
(Mean), s
2
(Variance),
s (standard deviation)
Sampling methods
In order to make a valid inference about population, we
need a scientific sample from that population. We have 2
methods of sampling:
1)
Probability sample
; It’s the sample that drawn from a
population in such a way that every member of population
has the same chance of being included in the sample. The
results of this sample are amenable for generalization
(valid inference).
We have:
a- Simple random sample. b- Systematic sample.
c- Stratified sample. d- Cluster sample.
e- Multistage sample.
2)
Non- Probability sample
; the results of this sample
are not amenable for generalization. We have:
a- Convenience sample. b- Quota sample.

Lecture 1+2 - Introduction
62
Simple random sample
If a sample of size "n" is drawn from a population of size
"N" in such a way that every possible sample of size "n"
has the same chance of being selected. The mechanism of
drawing is called "Random sampling", can be done by:
1- Lottery method. 2- Computer program.
3- Random number table.
Use of random number table:
a) Assign a unique identification number to each member
of the population (sample frame).
b) Decide the direction of movement on the table
(vertical or horizontal).
c) Locate at random a starting digit.
d) Move on table by equal digit number to the population
digit number.
Simple random sample requires:
1- Sample frame. & 2- Sample fraction.
Systematic sample:
Done by:
1) Assign a unique identification number to each member
of the population.
2) Locate at random starting point.
3) Selection of the sample at regular interval (every 3,
every 4 ...etc.).
Stratified sample
Simple random sample & systematic sample can't ensure
that the structure of the sample will be similar to the
structure of the population regarding certain
characteristic. To overcome such problem, we use
stratified sample by dividing the population into strata
regarding certain character (age, sex….etc.), then a
random or systematic sampling will be applied to each
stratum by either:
1) Equal allocation (equal No. in each stratum).
2) Proportion allocation, the number is proportion to the
size of the stratum.
Cluster sample.
The selection of group (cluster) of study instead of
individuals. This is usually done in big studies, and the
clusters are often geographical unit like villages, districts,
schools…..etc. But these clusters contain similar person
((high interclass correlation)), then the generalization of
the result may be affected.
Multistage sample
Sampling procedures that carry out in phases (stages) and
usually involve more than one sampling method. This is
usually done in two or more stages in very large diverse
population.
Convenience sample
This sample is representative to the site and time of data
collection ((e.g., in surgical ward in certain time)), but the
drawback that the sample is not representative to the total
population.
Quota sample
The composition of the sample as in term of age, sex,
social class…etc., is decided and all that require is to find
the right number of population to full these quota.
Sample size
It’s important to put in mind that:
1) The more the sample size, the less is the variability in the
results, and more chance that the random sample
represents the studied population.
2) The larger two samples are drawn from the same
population randomly, the more they resemble each other.
3) In small sample size, it's difficult & even impossible to
make a precise and confidently generalization, on the
other hand, its wasteful to study objects require. It's
said that "Samples which are too small can prove no
thing, and samples which are too large can prove
everything".
4) Standard error (SE): is the measurement of variation
between sample and population. SE = Standard
deviation (SD)/ ⌡sample size (n).
So, if we increase the n, SE will decrease.
If we use the all the population, there is no SE.

Lecture 1+2 - Introduction
63
Small group work
1) Specify the sampling method used in each of the
following studies. Write A, B, C, or D.
A = simple random sampling B = stratified random
sampling
C = cluster sampling D = systematic sampling
a) A die is rolled to decide which one of the six volunteers
will get a new, experimental vaccine: _____
b) A sample of students in a school is chosen as follows: two
students are selected from each batch by picking roll
numbers at random from the attendance registers: _____
c) A target population for a telephonic survey is picked by
selecting 10 pages from a total of 100 pages from a
telephone directory by using a table of random numbers.
In each of the selected pages, all listed persons are called
for the interview: _____
d) The number 35 is a two-digit random number generated
by a calculator. A sample of two wheelers in a state is
selected-by picking all those vehicles which have
registration numbers ending with 35: _____
2) Consider the following statement concerned with the
collection of data, and determine the best selection of
terms to complete the statement: "The entire group of
objects or people about which information is wanted is
called the ____________. Individual members are called
_______. The ________ is the part that is actually
examined in order to gather information."
a) population, explanatory variables, subgroup
b) whole, items of interest, stratum
c) response group, respondents, nonresponse group
d) sample, units, target population
e) population, units, sample (The right answer)
3) In a study looking at the effect of fluoridation on caries
prevalence in children, the researchers studied two towns;
the local water was fluoridated in the first one and no
fluoride was added to the second one. In both cases they
examined all 5-6 year old children in the two towns. They
found a 40% difference in the number of caries-free
children. From the point of view of sample selection,
would we be correct in assuming that this study proves
that defluoridation of the water supply causes an increase
in caries in children? Why?
Answer: Strictly speaking the children were not a random
sample of 'children' or even '5-6 year old children'. All the
5-6 year old children in the two towns were selected, had
a 100% chance of being picked and all other children had
a 0% chance of being picked. The population that was
sampled was 5-6 year olds and so, strictly speaking, the
results can only be generalized to that population.
4) A researcher wishes to investigate the average duration of
hospital staying for patients suffering from CVA in Al
Kindy Teaching hospital. From patient records, design a
suitable sampling method in order to get a valid and a
generlizable results.
5) In the campaign against polio, a doctor inquired into the
number of times children <5 years in village had been
vaccinated. Design a suitable sampling method in order to
get a valid and a generlizable results.
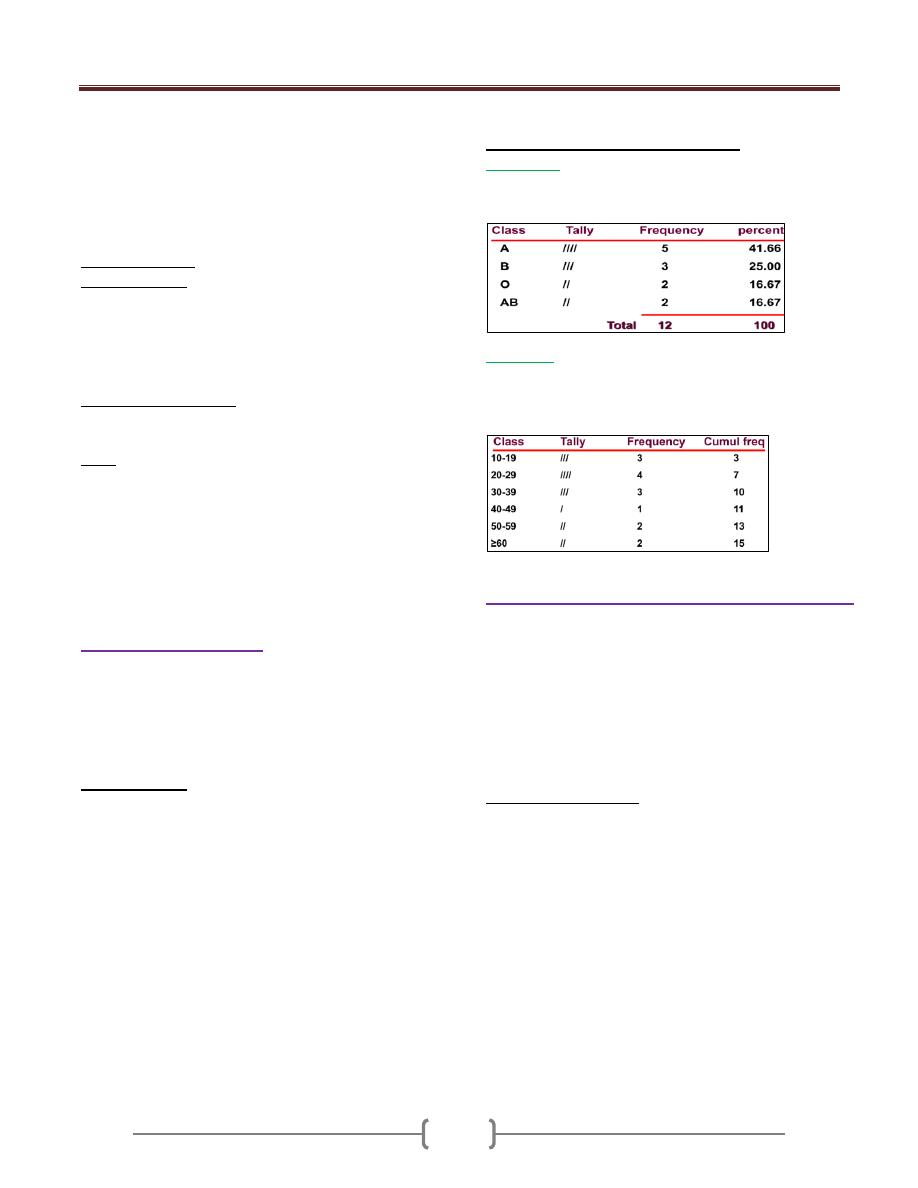
Lecture 3+4+5 - Descriptive statistics;
64
Descriptive statistics serve as device for organization,
summarization of data.
{{Measurements that have not been organized
summarized or otherwise manipulated are called ''raw
data''}}.
Organization and summarization and the displaying of
data
عرض
البيانات
can be done by the following methods.
1) Tabular (Tables):
2) Graphs (figures)
Tables and graphs are often displayed the distributions,
which are useful:
(a) To detect any trends in the data
(b) To detect “unusual” scores in a set of data
(c) To quickly present/summarize a great deal of info
3) Numbers (mathematics)
Single number to summarize the whole data
Note: The purpose of tables and graphs is to present
information in a concise way so that readers can
comprehend
فهم
and remember it more easily.
Tables and Graphs should stand alone in a report.
This means that the reader should not have to refer to the text
in order to understand & interpret the information in them
In practice this means, they require descriptive titles and
clear, meaningful labels.
1) Tabular (Tables):
Table consists of row(S) & column(S), could be 2x2,
2x3….etc.
List is the simplest form of table, consists of two columns
only, the first giving an identification of the observation
unit & the 2
nd
giving the value of the variable of that unit.
Table must be:
a) As simple as possible (it is better to have 2-3 simple
tables than one complicated).
b) Understandable & self-explanatory without references to
the text. This is done by:
The title should be clear (placed above the table), and
answer the questions of: What? Where? And When?
Each row and column should be labeled clearly and
concisely.
Specific unit of the measure for the data should be defined.
Total should be placed.
Illustrate symbols, code, and abbreviation by putting a
footnote below the table.
c) Source of the table (if not original).
d) Avoid too much over ruling.
Tables can display two types of data
1) Categorical
Ex: 12 subjects were tested for blood type: A, B, O, A,
AB, B, O, B, A, A, A, AB
2) Numerical
Ex: The ages of 15 subjects were: 14, 15,16 20,22, 27,
28, 31, 33, 37, 48, 50, 59, 60, 60
Data must be grouped in classes
2) Diagrammatic "Graphical”, “Figure".
Graphs represent pictorial representations of the
distribution of data. Graphs should present a clear and
accurate picture about the data and convey an easy-to-
understand message. Graphs include labels with units of
measurement, a title that accurately describes the contents
of the graph, and a scale on each axes that neither distorts
nor exaggerates the data. Sample size should be included
on the graph or legend.
Graphs versus Tables
• Advantages :
Simplicity, clarity
Easily remembered visual image
Picture of complex relationships
Emphasis
Popular
• Disadvantages:
Lack of precision & Lack of flexibility
Lack of Provide for distortion
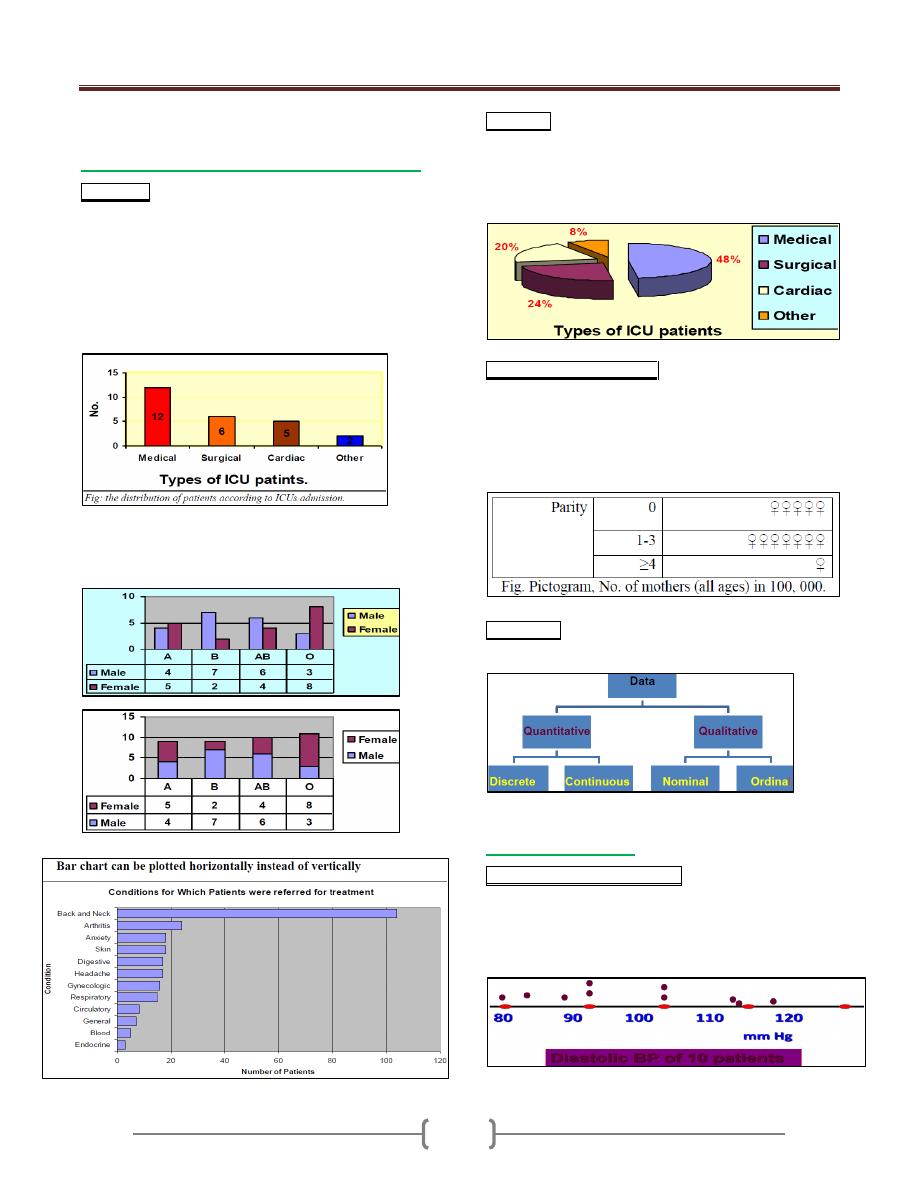
Lecture 3+4+5 - Descriptive statistics;
65
The form of the diagram varies according to the
nature of the data:
a) For categorical data, we have "chart", this can
Bar chart; This is a graphical representation of the
(relative) frequencies or magnitudes by rectangles of
constant width drawn with length proportional to the
(relative) frequencies or magnitudes concerned, as the
EX. Below:
EX: In certain hospital the number of patients in its 4
ICUs for 1 day was: medical=12, surgical=6, cardiac=5
and other=2. Construct suitable diagram
We have: 1- Clustered bar chart 2- Segmented bar chart
Useful for displaying the distribution of more than one
categorical variable
Pie chart; This is a graphical representation of the
(relative) frequencies or magnitudes by a circle whose
area represent the total frequency and which is divided
into segments which represent the proportional
composition of total frequency, as the EX. Below:
Picto-chart ((Picto-gram)). This is a graphical representation
of the (relative) frequencies by using symbols (drawing or
picture) relevant to the subject matter. Symbols of different
size should not be used. A unit value of the data should be
represented by standard symbol which may repeat to represent
magnitude. As in the Ex.
Flow chart. Flow-chart. The sequence of series of events
is often illustrated by flow chart, as in the Ex.
b) For numerical data
One dimensional dot diagram. This is a diagrammatic
representation of the distribution of a variable in which
every observation is marked as a dot corresponding to its
value on a line (usually horizontal line) calibrated within
the range of values of the variable. As in the Ex.
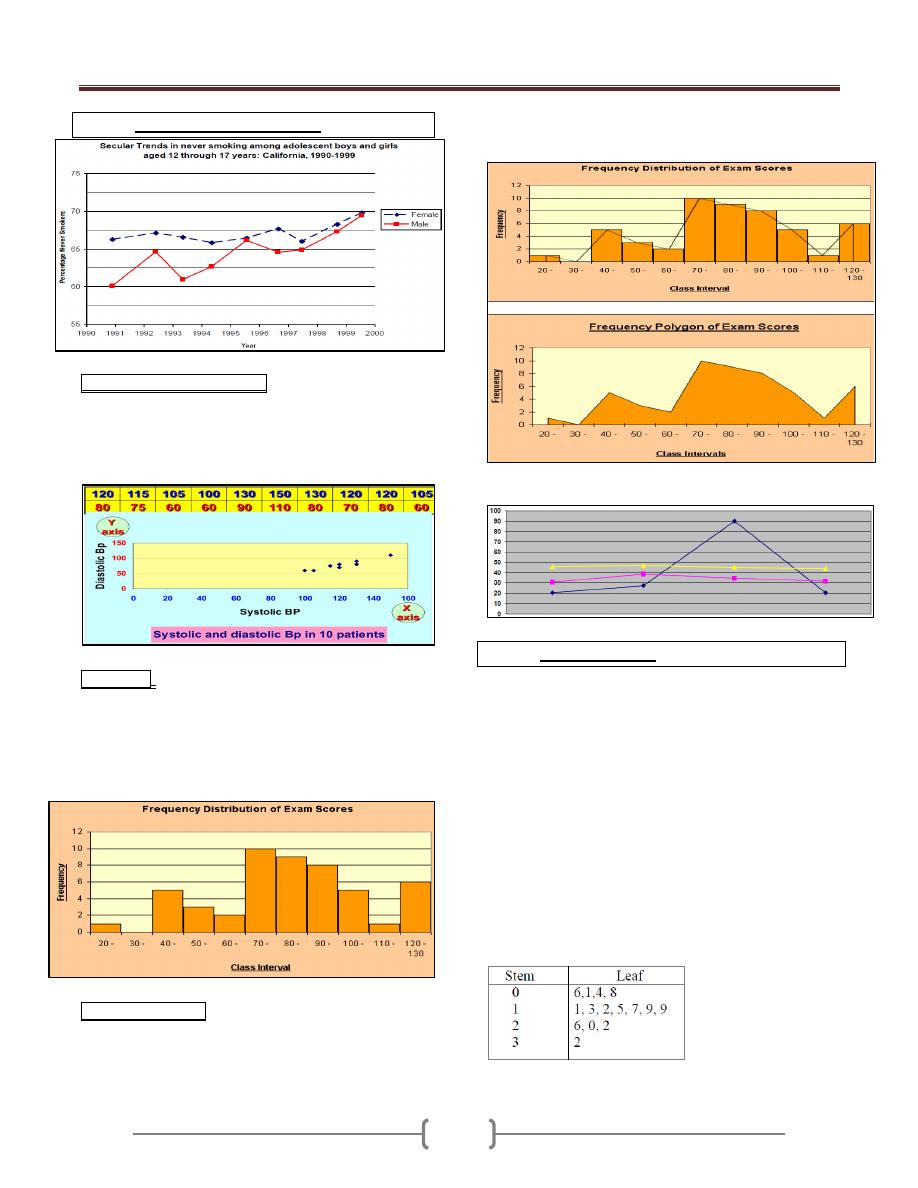
Lecture 3+4+5 - Descriptive statistics;
66
Arithmetic Scale Line Graph
Scattered diagram (dot-graph). Each observation is
marked as a dote corresponding to its value on each axis
(X & Y). The pattern made by the dotes is an indication
of relation between the two axes, which may be linear if
the follow a straight line or curved if not.
Histogram: This is a graphical representation of
frequency distribution in which rectangle proportional in
the area to the frequencies are erected on the horizontal
axis. The base lines are continuous (because we are
dealing with continues variables). The width of the
rectangles should be equal. As in the Ex.
Frequency polygon: If we join the tops of the rectangles
in the histogram→Polygon (total area of histogram= total
area of polygon). It is only appropriate when the variables
on the horizontal axis are continues and there is only
single value on the vertical axis. As in the Ex.
Advantage: can present more than one set of data.
Stem & Leaf plots
It is the combination of a graphic technique and a sorting
technique of the data
The raw data can still be obtained from the graph for
further analysis
The stem is the leading digit(s) of the data
The leaf is the trailing digit(s) of the data
Ex1: A pediatric registrar is investigating the amount of
lead in the urine of children from a nearby housing estate.
In a particular street there are 15 children whose ages
range from 1 year to under 16, and in a preliminary study
the registrar has found the following amounts of urinary
lead (nmol/24 hrs): 0.6, 2.6, 0.1, 1.1, 0.4, 2.0, 0.8, 1.3,
1.2, 1.5, 3.2, 1.7, 1.9, 1.9, 2.2
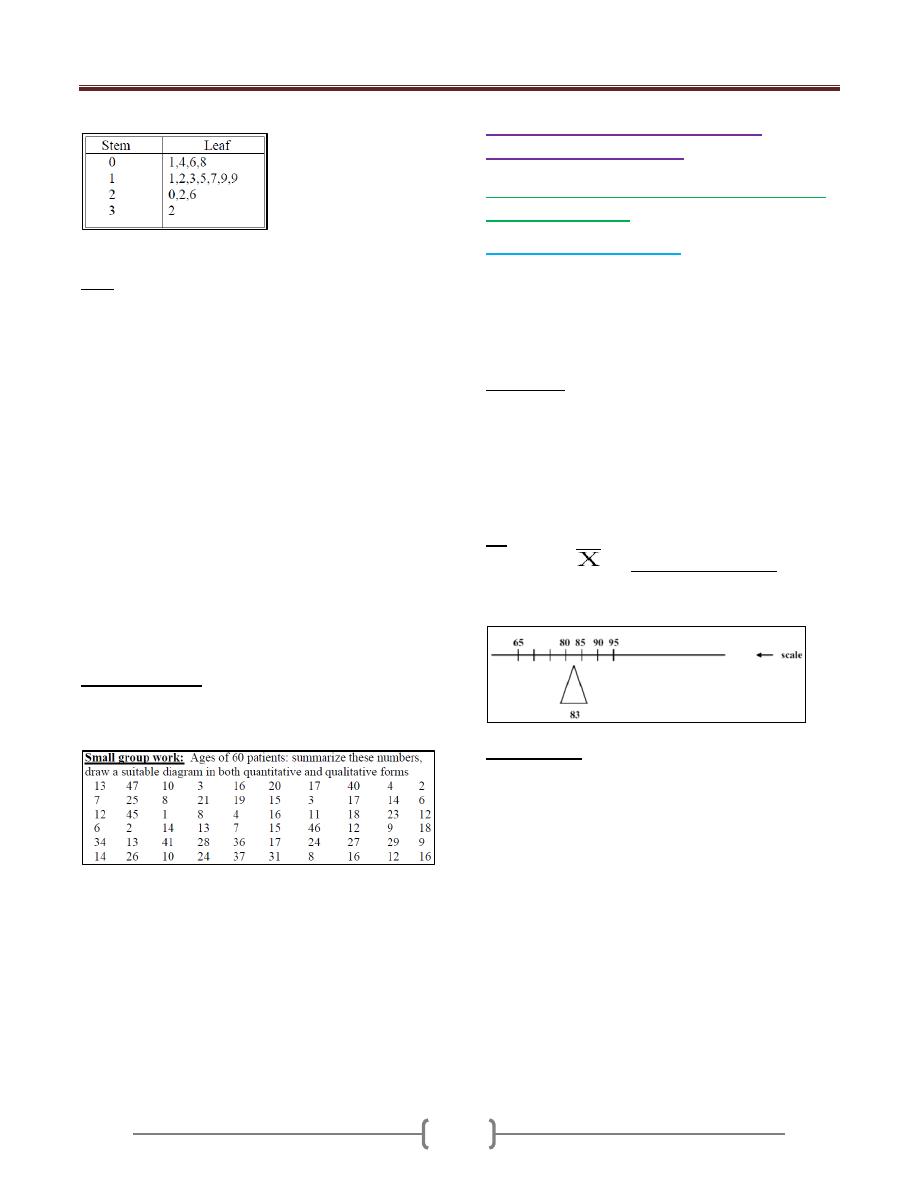
Lecture 3+4+5 - Descriptive statistics;
67
Stem and leaf "as they come"
Ordered stem and leaf plot
EX2: systolic blood pressures of 30 subjects are 185, 160,
235, 165, 125, 175, 185, 132, 168, 112, 170, 155, 105,
158, 120, 190, 140, 185, 125, 180, 145, 110, 155 135,
170, 113, 155, 175, 145, 130
Arrange the data from least to greatest: 105, 110, 112,
113, 120, 125, 125, 130, 132, 135, 140, 145, 145, 155,
155, 155, 158, 160, 165, 168, 170, 170, 175, 175, 180,
185, 185, 185, 190, 235.
Stem/leaf Stem/leaf
10 | 5 18 | 0555
11 | 023 19 | 0
12 | 055 20 |
13 | 025 21 |
14 | 055 22 |
15 | 5558 23 | 5
16 | 058
17 | 0055
Small group work: Ages of 60 patients: summarize
these numbers, draw a suitable diagram in both
quantitative and qualitative forms
3) Mathematical ((Numerical))
representation of data
1- Measurements of location ((Measurement of
central tendency)).
a) Arithmetic Mean (Average)
The most commonly used measure of central tendency.
This is the sum (Σ) of all observations divided by the
number of observation. We have:
Population Mean (µ) = Σx / N (N= No. of population)
Sample Mean (x) = Σx /n (n= No. of sample)
Advantages.
Uniqueness, only Arithmetic Mean for a giving set of
data.
Simplicity, easy to compute & understand.
Take in consideration all values, not ignore any one (takes
into account the magnitude of each and every observation
in the data).
EX: Suppose data are: 90, 80, 95, 85, and 65 (n=5)
Sample mean
= 90 + 80 + 95 + 85 + 65 = 83
5
The mean can be thought of as a “balancing point”,
“center of gravity”
Disadvantages.
Affected by the extreme values, which in some cases so
distorted that it become undesirable as a measure of
central tendency. As an EX. Of how the extreme values
may affect the mean: Suppose five physicians receive the
following charges, $95, $95, $85, and $280. The charge
for the five physicians is found to be $118, a value that is
not very representative to their charges.
The mean is the most commonly used measure of central
tendency. However, if the data has extreme values (very
high or very low values produce skewness in the data),
such values can pull the mean towards one side and make
it less usefull. The median is less influenced by extreme
values and this makes it useful in certain epidemiological
studies where skewed distributions are studied.
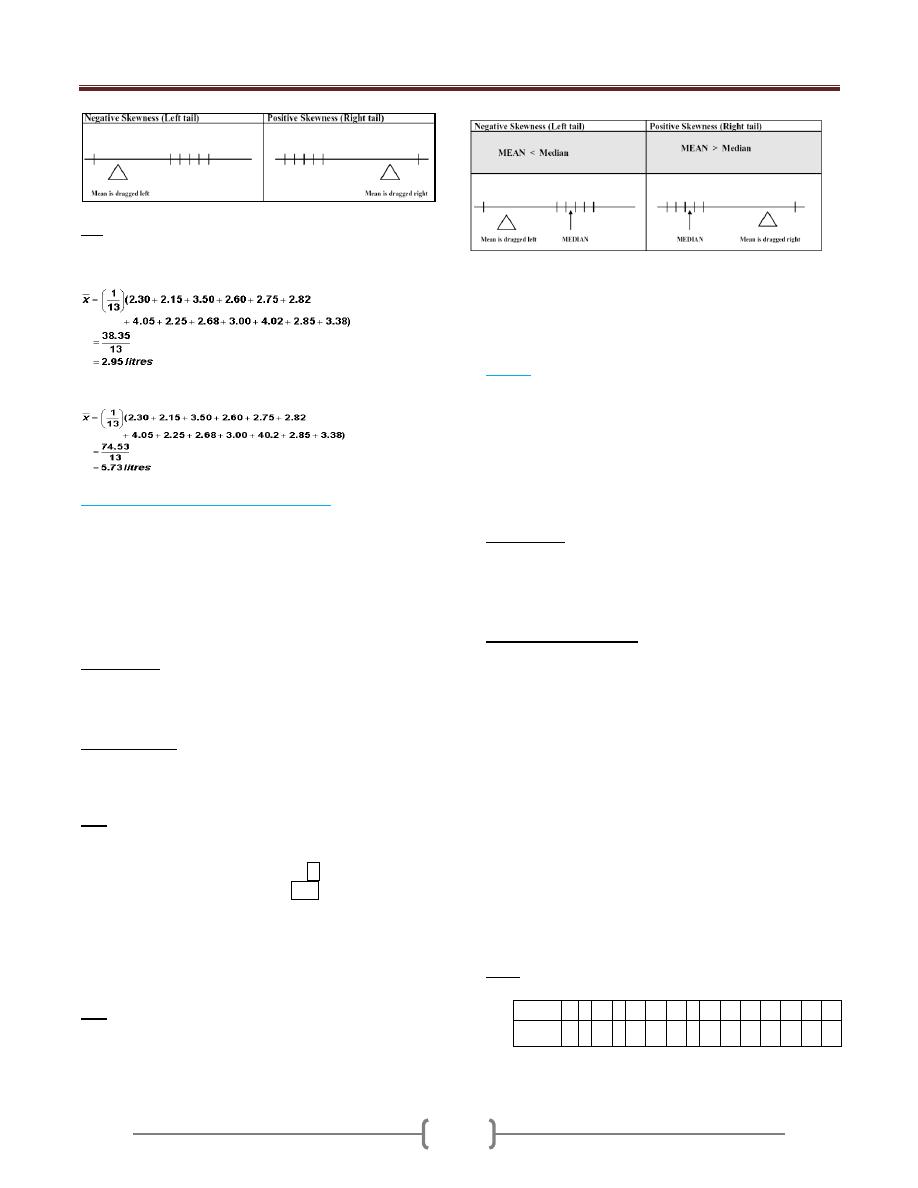
Lecture 3+4+5 - Descriptive statistics;
68
Ex: Measurement results from the Forced Expiratory
Volume (FEV) test in one second (in litres): 2.30, 2.15,
3.50, 3.60, 3.50, 2.82, 4.05, 2.25, 2.68, 3.00, 2.68, 2.85,
3.38. The mean is calculated as:
If the 11th observation was accidentally recorded 40.2
liters, and not 4.02 then our calculation would be thus:-
b) Median (50
th
percentile, 5
th
deciles).
It is the value that divides the data into two equal parts
(50% greater and 50% lesser than it)) giving that the
values are arranged in o ordered of magnitude.
If the number of values is odd, then the position of the
median = n+1/ 2.
If the number of values is even, then the median is taken
to be the mean of (n/2) and (n/2 +1) observations.
Advantages.
1) Uniqueness, only 1 median for a giving data.
2) Simplicity, easy to calculate.
3) Not affected by the extreme values.
Disadvantages.
Didn't take in consideration all values, but only the
median one.
EX: give the median of these values:
1
st
set of data: 5, 15, -7, 20, 25, 3, -1, 0 & -3.
2
nd
set of data: 7, 9, 16, -5, -9, 3, -4, & 6.
Solution: ordered array: -7, -3, -1, 0, 3, 5, 15, 20, 25
-9, -5, -4, 3, 6, 7, 9, 16
Median position= (9+1)/2=5, i.e. the 5th reading,
median = 3 in 1st set = 8/2 = 4 & (8/2) + 1 = 5 so
position 3 & 6, (3+6)/2= 4.5 in 2nd set
The Median is a Better Description (than the Mean) of the
Majority When the distribution is skewed (not affected by
the extreme values).
Ex: Data are: 14, 89, 93, 95, 96
• Skewness is reflected in the outlying low value of 14
• The sample mean is 77.4
• The median is 93
When do we use mean & median?
If there are extreme values in a set of data we use the
median, so as not to be misled by extreme value when we
use the mean.
c) Mode.
The value which occurs most frequently. Mode is not
unique
If all values are different → No mode.
If one value which occur most frequently → Uni-modal.
If two values which occur most frequently → Bi-modal.
If 3 values which occur most frequently → Tri-
modal….etc.
Advantages.
1) Simplicity, easy to calculate.
2) Unlike mean & median, the mode can be used for qualitative
data (e.g., modal diagnosis as HT, DM, IHD …..etc.).
Important to know:
If the data is homogenous, we use the mean, but if it is
not, we use the median.
For uni-modal frequency distribution (normal
distribution) which is symmetric: The mean = The median
= The mode.
Knowing the values of the mean and median of a
distribution can provide some information on the
skewness of a distribution.
If the mean is greater than the median then: the
distribution is positively skewed; the long tail is on the
high (usually right) side of the graph.
If the mean is equal to the median then: the distribution is
symmetric.
If the mean is less than the median then: the distribution is
negatively skewed; the long tail is on the low (usually
left) side of the graph.
Ex 1: A sample of 15 patients making initial visit to a
clinic, travailing these distances:
Patient
1
2 3
4 5
6
7
8 9
10
11
12
13
14
15
Distant
(x)/Km
5
9 11
3 12
13
12
6 13
7
3
15
12
15
5
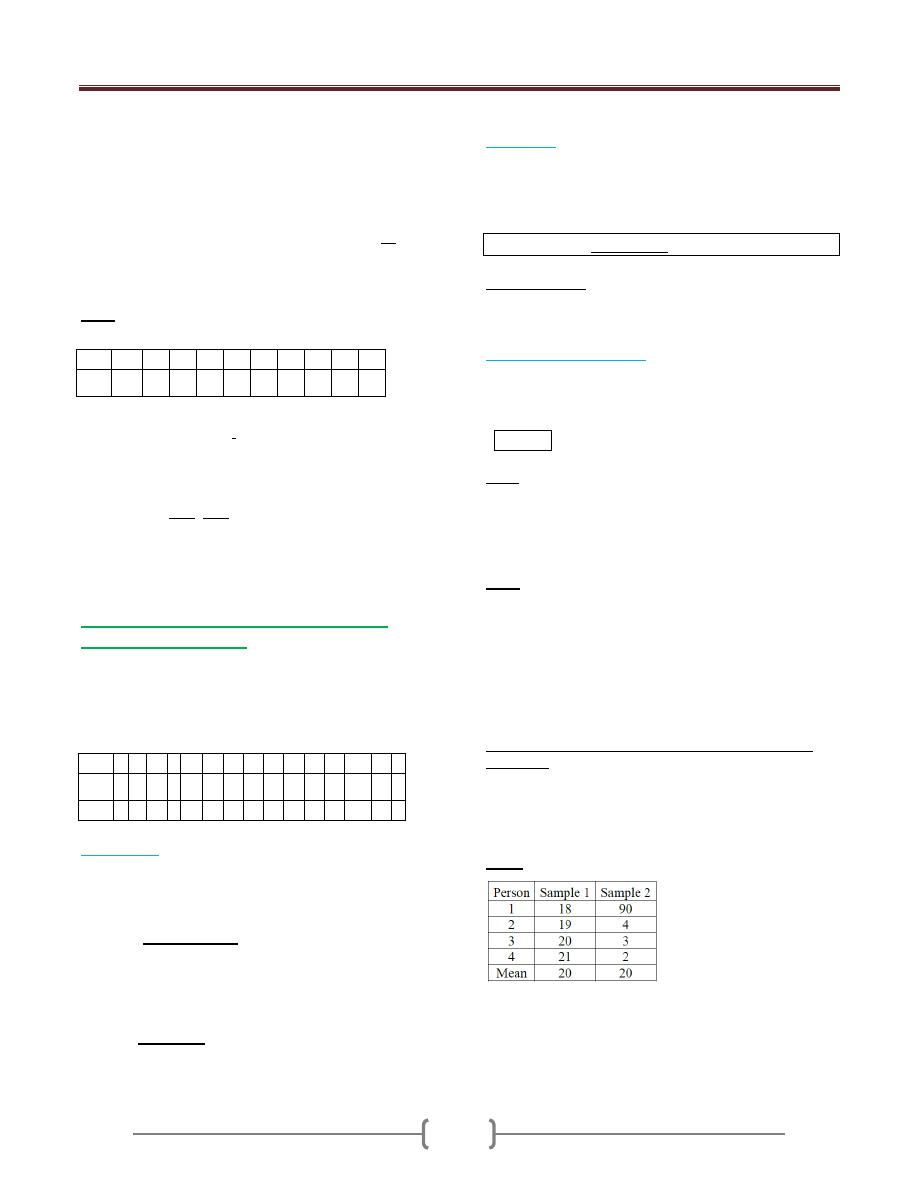
Lecture 3+4+5 - Descriptive statistics;
69
Mean(x) of the distance =
X /n = (5+9+11…. +5)/ 15
= 9.4 Km.
Median of the distance: As the number of values is odd,
the position of the median will be (n+1)/2 after arranging
the values in ordered array → (3, 3, 5, 5, 6, 7, 9, 11, 12,
12, 12, 13, 13, 15, 1w5). So the median is 11.
Mode = 12
Ex 2: The following are the WT of a sample of 10
experimental animals.
Mean(x) of the WT =
x /n = (13.2+15.4+13.0…
+13.1)/ 10 =14.58 Kg.
Median of the WT: As the number of values is even,
the median will be mean of (n/2) and (n/2+1) values
after arranging the values in ordered array→ (13, 13.1,
13.2, 13.6, 14.4, 14.6, 15.4, 15.4, 16.6, 16.9). So the
median will be the mean of No. 5 &6 values =14.4 +
14.6/ 2 = 14.5 Kg.
Since all the values with same frequency → No mode.
2. Measurements of dispersion (scattering,
spreading, variation).
This is the variety that the values exhibit about their
mean. If all values are the same →No dispersion. If all
values are close together → Small dispersion. If the
values are widely scattered → Great dispersion.
a) Range (R):
Is the difference between the largest (X
L
) and smallest
(X
s
) values in a set of observation. → R = X
L
- X
s
.
It’s the least commonly used measure because of the
following disadvantages:
a) Didn’t take in consideration all the values, only the
extremes.
b) Not stable estimate because as the sample size
increases, the range will increase too.
The only advantage is simplicity.
b)
Variance:
This is the dispersion relative to the scatter of the values
about their mean. We have;
a- Population variance (
2
b- Sample variance (S
2
).
S
2
= n
x
2
-(
x)
2
\ n(n-1).
Disadvantages. Since it represents squared unit, therefore
it's not appropriate measure of dispersion when we wish
to express this concept in term of the original units.
c)
Standard deviation(S).
It's the square root of the variance; it provides a summary
of dispersion of individual observations around the mean.
It’s the most frequently value used in dispersion.
S =
S
2
Note. We have what we called the standard error (SE),
which is not a mistake but it gives the standard difference
of sample mean from population mean. SE = S\
n. →
As the sample size increases, the SE decrease, and if we
use all the population, there is no SE.
Ex 1: A sample of 15 patients making initial visit to a
clinic, travailing these distances:
x = 141
x
2
= 1515
-Range = 15- 3 = 12 Km.
- Variance (S
2
) = n
x
2
-(
x)
2
\ n(n-1).
= 15 (1515)-(141)
2
\ 15(14) = 17.8 Km
2
.
-Standard deviation(S) =
S
2
= ± 4.2 Km.
Measurements of dispersion (scattering, spreading,
variation)
Knowing the mean is not enough
A key issue is how alike or “unlike” each other the
individual observations are
Ex: 2
samples with same mean, but…
To understand the variation in the sample we should
calculate the standard deviation which is a summary
measure of the differences of each observation from the
mean (SS). If the differences themselves were added up,
No.
1
2
3
4
5
6
7
8
9
10
WT
(Kg)
13.2
15.4
13.0
16.6
16.9
14.4
13.6
15.0
14.6
13.1
Patient 1
2
3
4 5
6
7
8
9
10
11
12
13
14
15
Distant
(x)/Km
5
9
11
3 12
13
12
6
13
7
3
15
12
15
5
(x)
2
25 81 121 9 144 169 144 36
169 49
9
225 144
225 25
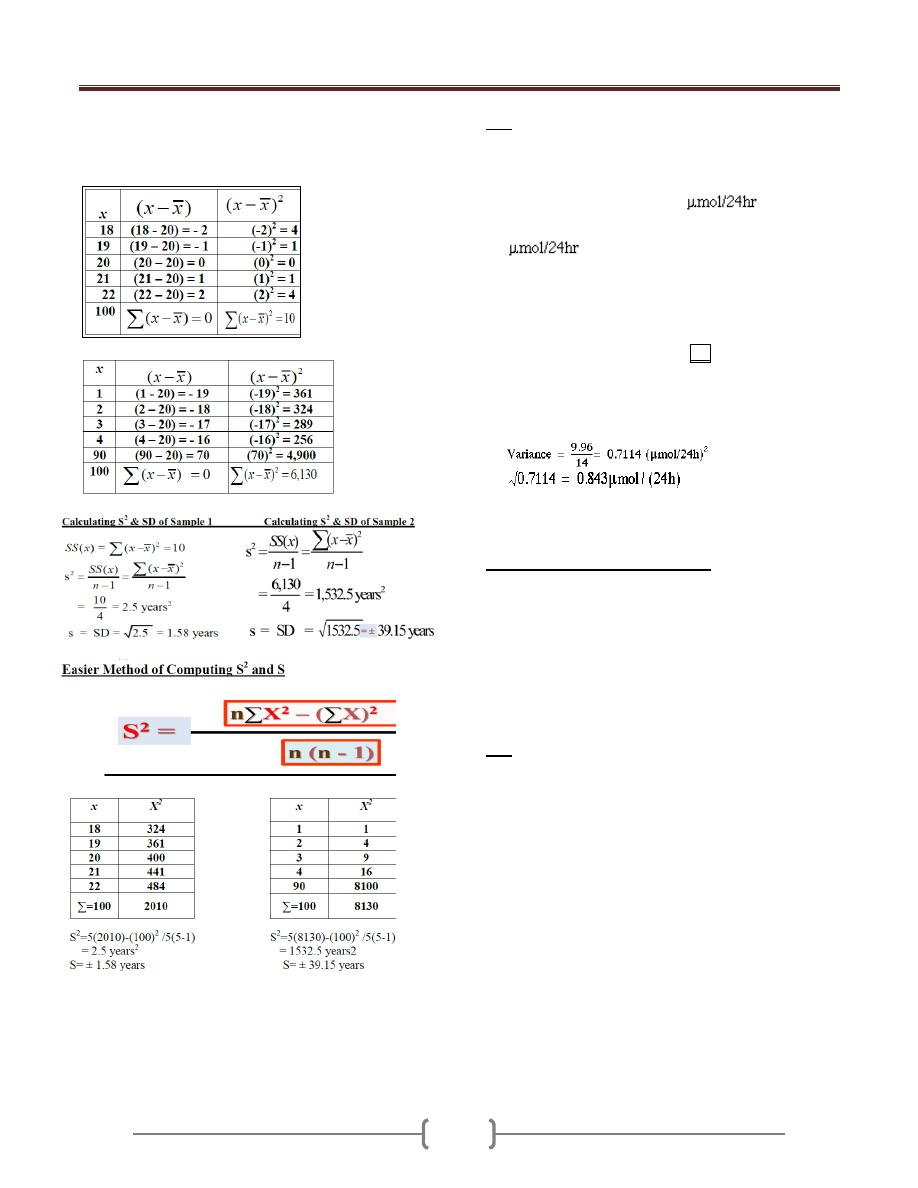
Lecture 3+4+5 - Descriptive statistics;
70
the positive would exactly balance the negative and so
their sum would be zero.
Calculating SS(x)
for Sample 1
Calculating SS(x)
for Sample 2
Variance and SD are the most common measures of
variation, but some time we use range=Max-Min, but this
measure is unstable and lessuseful.
EX: Urinary concentrations of lead in 15 children were:
0.6, 2.6, 0.1, 1.1, 0.4, 2.0, 0.8, 1.3, 1.2, 1.5, 3.2, 1.7, 1.9,
1.9, and 2.2. Calculate the measures of central tendency
and dispersion
The total of the values is 22.5
, which was
divided by their number, 15, to give a mean of 1.5
.
To find the median (or midpoint) we need to identify
the point which has the property that half the data are
greater than it, and half the data are less than it after
data ordering.
0.1, 0.4, 0.6, 0.8, 1.1, 1.2, 1.3, 1.5, 1.7, 1.9, 1.9, 2.0,
2.2, 2,5, 3.2
Median position=15+1/2=8 the median is 1.5
The mode is 1.9
S
2
=15(43.71) – (22.5)
2
/15(15-1) S=√S
2
Coefficient of Variation (CV)
Useful measure of relative spread of data and is used
frequently in biological sciences.
It produces a measure of relative variation, (variation that
is relative to the size of the mean), rather than actual
variation.
useful for comparing two or more data with different units
of measurement because it is expressed in percentage
CV = SD/mean x 100%
Ex: Suppose we have 2 samples of males
n1 age 25 years, mean Wt=145 lb, S=10
n2 age 11 years, mean Wt=80 lb, S=10
Which group is more variable?
A comparison for SD might lead one to conclude that the
2 samples possess equal variability. But calculation of CV
CV for group 1= (10/145) X 100 = 6.9
CV for group2= (10/80) X 100 = 12.5
Different Impression
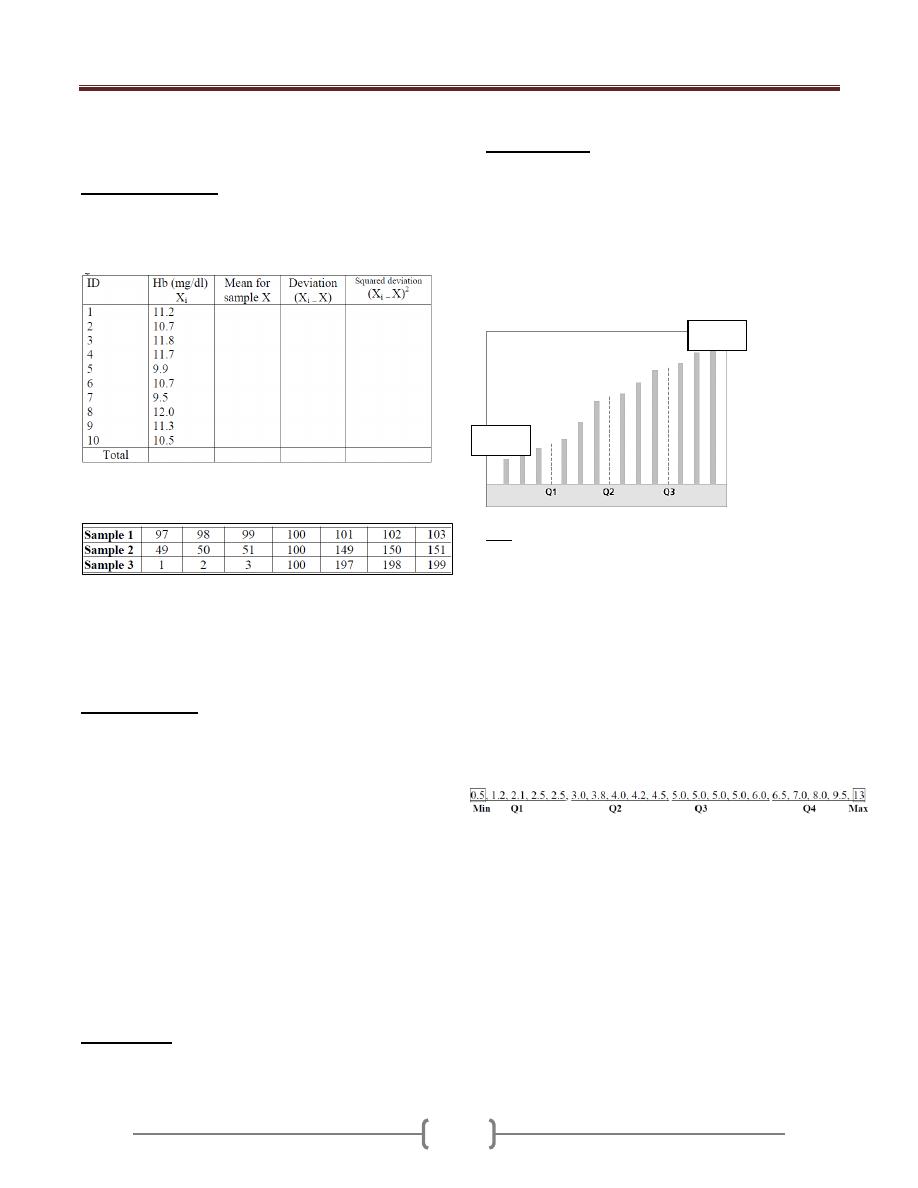
Lecture 3+4+5 - Descriptive statistics;
71
Group Discussion
1) The Hb level in 10 patients is shown in table below.
Complete the data required and calculate the measures of
location and dispersion. Draw suitable diagram
2) Suppose we had the following data from 3 different
samples.
The average for each sample is 100. Also, the median for
each sample is 100. But it is obvious that each sample is
quite different, despite having the same mean and median.
How can we prove that?
Percentiles (P):
The value below which a given
percentage of the cases fall. The value of the k
th
percentile
is obtained by ranking the observations and looking at the
value of the {(k/ n) X100}th observation.
EX1: A teacher gives a 20 point test to 10 students. The
score are: 18, 15, 12, 6, 8, 2, 3, 5, 20, and 10. Find the
percentile of score 12.
Sol: Arrange the data in order from lowest to highest: 2,
3, 5, 6, 8, 10, 12, 15, 18, and 20.
(k/ n) X100= (7/10)X100 = 70% thus the student whose
score 12 did better than 70% of the class.
EX2: Find the value that corresponds to 60
th
percentile.
(60 X 10)/100=6 (position of 60
th
percentile), hence 10
score. Thus any one scoring 10 would have done better
than 60% of the class.
Deciles (P):
position in tenths a data value in the
distribution → (k/ n) X10
Quartile (Q);
position in fourths a data value in the
distribution → (k/ n) X4
The first quartile (Q1) is the value of the {(n + 1)÷4}th
observation.
The third quartile (Q3) is the value of the {3x(n +
1)÷4}th observation.
Interquartile range (IQR): The middle half of the
values. i.e. those lying between the first and third
quartiles(Q1- Q3).
Ex: The following are the diameters (in cm) of pure
sarcomas removed from the breast of 20 women: 0.5, 1.2,
2.1, 2.5, 2.5, 3.0, 3.8, 4.0, 4.2, 4.5, 5.0, 5.0, 5.0, 5.0, 6.0,
6.5, 7.0, 8.0, 9.5, and 13. Calculate Q1, Q2 (median), Q3,
and IQR.
Q1= (20+1)/4 = 5.25
th
measurement. Either we say
Q1 is 5
th
measurement = 2.5 or
Q1= 2.5 + 0.25(3.0 - 2.5)
= 2.625
Q2 (median) = 2(20+1)/4 = 10.5
th
value
= 4.5 + 0.5(5.0 - 4.5) = 4.75
Q3 = 3(20+1)/4= 15.75
th
value. Either we say Q1 is 15
th
measurement = 6 or
= 6.0 + 0.75(6.5 - 6.0)= 6.375
IQR= Q3-Q1 = 6.375 – 2.625 = 3.75
Min
Max
Lecture 6 - Probability
72
Why should we understand
probability? Is probability
essential for physician?
Example 1: Genetic Counseling: A couple has a baby
with a genetic defect. They are considering having
another baby. What is the likelihood that the second child
will have a genetic defect also?
Example 2: Prognosis; A physician is considering several
therapies for the treatment of a patient. Which therapy
should be used? Each therapy produces a result that is
somewhere between success and failure. The final choice
is “weighed the probability” against the others.
Example 3: Is a food additive carcinogenic? An
investigator explores this in an experiment that compares
two groups. Some of the treated individuals develop
cancer and only few of the controls develop cancer.. Is the
excess number of cancers meaningful (higher probability
than control)?
Example 4: Smoking and Cancer: Lung cancer occurs
commonly in smoker but only sometimes in non smokers.
Probability of other factors related to a variable outcome.
Probabilities are a tool in decision making, and the key
to understand inferential statistics
Example 5: The data below shows the finding of a
survey. Is living near electricity transmission equipment
associated with occurrence of cancer?
Cancer Not
Near 200 1646 11%
Not 50 7289 1%
Among those living near electricity equipment, 11% have
cancer. Among those living elsewhere, only 1% have
cancer. Is this a meaningful difference?
The difference (if significant) in this example is
reflected for population and called inference
Probability is the bridge between Descriptive Statistics
and Inferential Statistics
The sample space is the universe, or collection, of all
possible outcomes.
The probability (P) of the occurrence of event (E) is equal
to the number of times (E) occur (M), divided by the
number of times E can occur (N). P (E) = M\N
The concept of probability is frequently encountered in
every day communication of health workers, we may here
the physician say that a patient has 50-50 chance of
surviving, or a patient 95% has the disease.
Element of probability
1) Total probability value must be between 1 & zero (0 ≤ P≤
1), no negative value.
P = 0 → Not occur. P = 1→ should occur.
P = 0.5→ 50% will occur & 50% will not occur.
2) The sum of the probabilities of mutually exclusive (can't
occur simultaneously) outcome is equal to one.(black
or
white, male
or
female, blood group A
or
B
or
AB
or
O)
There are 3 types of probability:
1) Classical Probability
:
Assume that all outcomes in the sample space are equally
likely to occur. One does not actually have to perform the
experiment to determine the probability.
Ex: When a single die is rolled, each outcome has the
same probability of occurring Since there are 6 outcomes,
each outcome has a probability of 1/6
2) Empirical Probability (Relative frequency):
Depend on actual experience to determine the likelihood
of outcomes
Ex: In a study, we have the following table for serum
cholesterol of 1047 male patients aged 40-59 year.
S.choles.
F
R.F
C.R.F
<160
31
3
3
160-199
134
12.8
15.8
200-239
358
34.2
50
240-279
326
31.1
81.1
280-319
145
13.7
94.8
320-359
43
4.1
98.9
360 +
12
1.2
100
totals
1047
100%
----
The probability to get individuals with serum cholesterol
of 820-319 is 145 / 1047 = 13.7%
Probability to get those below 200 is (31 +134)/ 1047 =
15.8
So we can express probability in terms of relative
frequency or cumulative relative frequency.
3) Subjective (personalistic) Probability
:
Based on person’s experience and evaluation of the situation
But does not rely on the repeatability of any process

Lecture 6 - Probability
73
A physician might say that on the basis of his diagnosis,
there is a 30% chance that the patient will need an
operation.
If a doctor says “you have a 50% chance of recovery,”
the doctor believes that half of similar cases will recover
in the long run.
Presumably, this is based on knowledge, and not on a
whim. The benefit of stating subjective probabilities is
that they can be tested and modified according to
experience.
Joint probability
:
It is the probability that the events (2 or more, E
1
, E
2
..etc)
can occur simultaneously. We have the following 2 rules:
1) Multiplication rule (And, ∩, both).
a) Independent events (E
1
not affected by E
2
).
P (E
1
∩E
2
) = P (E
1
) x P (E
2
)
Two events are statistically independent if the chances, or
likelihood, of one event is in no way related to the
likelihood of the other event. Individual is male with red
hair.
EX: Event A = “a woman is hypertensive”
Event B = “her husband (not relative) is hypertensive”.
The assumption of independence seems reasonable since
the two persons are not genetically related. If the
probability of being hypertensive is 0.07 for woman and
0.09 for man, then the probability that BOTH the woman
and her husband are hypertensive is:
P(A and B) = P(A) x P(B) = 0.07 x 0.09 = 0.0063
Ex: The probability that an individual belonging to blood
group A is 0.42, and the individual being a football player
is 0.50. What is the probability of the individual both
belonging to blood group A & being football player?
Since the events are independent → P (E
1
∩E
2
) = P (E
1
) x
P (E
2
) = 0.42 x 0.50 = 0.21
b) Dependent events (E
1
affected by E
2
).
P (E
1
∩E
2
) = P (E
2
) x P (E
1
/ E
2
)
EX: Probability of being male 1s 0.5, and that that male
being bold is 0,05. What is the probability of both being
male and bold?
Since the events are dependent→ P (E
1
∩E
2
) = P (E
2
) x P
(E
1
/ E
2
) =0.5 x 0.05/0.5= 0.005
EX: the chance that person has Huntington ’s chorea is
0.0002 (if the parent does not have Huntington’s Chorea).
An offspring of a person with Huntington’s Chorea has a
50% chance of contracting Huntington’s Chorea
(offspring with chorea giving that his father had chorea).
Probability 2 persons have Huntington’s Chorea =
P(A and B) = 0.0002 X 0.0002= 0.00000008
Probability both parent and child have Huntington’s
Chorea = P(A) P(B|A) = 0.0002 x 0.5 = 0.0001
*Conditional probability: Probability of an event
occurring (E
1
) giving that the other event (E
2
) has already
occur.
P (E
1
/ E
2
) =P (E
1
& E
2
)/ P E
2
Ex: Using the information of table below:
Calculate:
1- The probability of selection person dis. +ve & test +ve.
2- The probability of selection person dis. -ve & test -ve.
As the variables are dependent, so P (E
1
∩E
2
) = P (E
2
)
xP (E
1
/ E
2
)
1- P (dis. +ve & test +ve.) = 11/100 x 7/11 = 7/100
2- P (dis. -ve & test -ve.) = 90/100 x 86/90 = 86/100
Ex: Probability of DM patient given that he has central
obesity=70/90, the denominator only patient with Central
obesity.
P(A/B)=P(A+B)/B
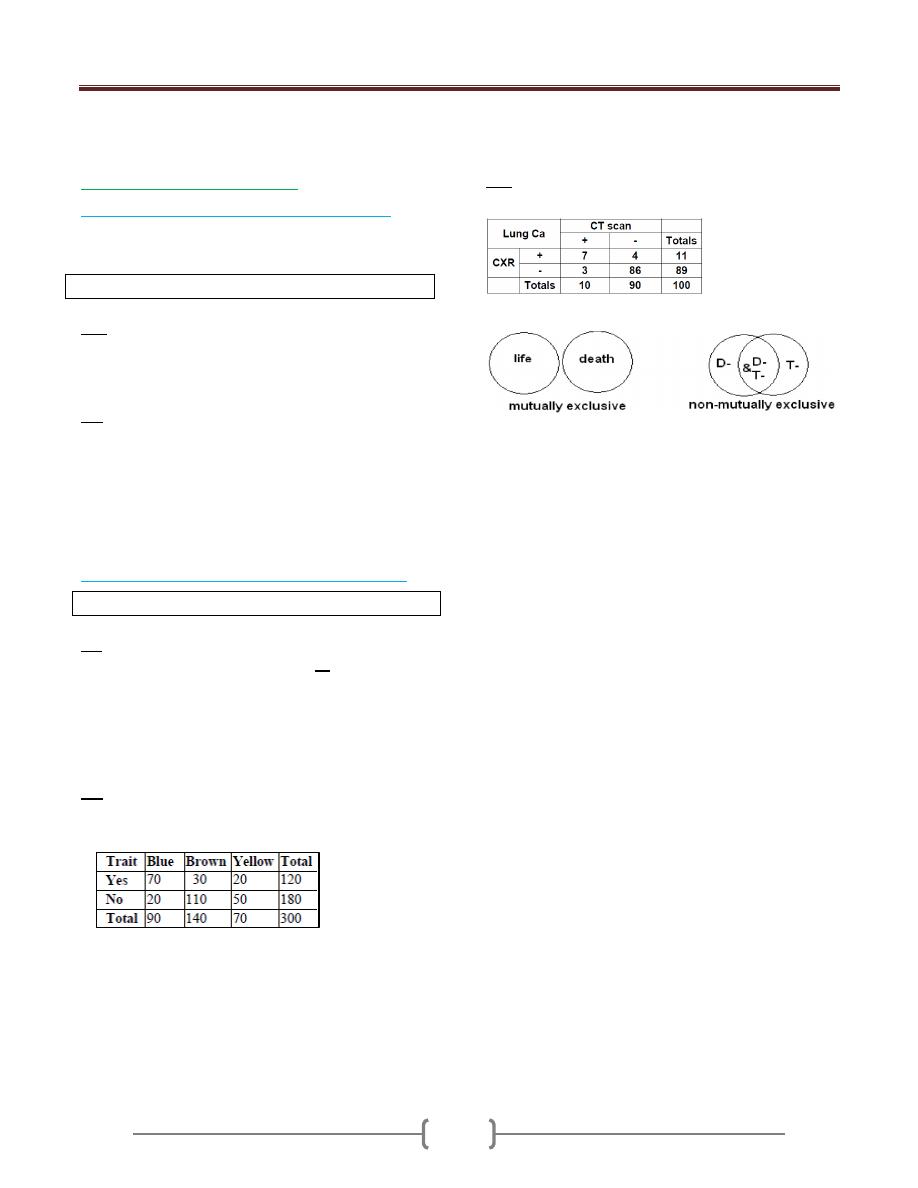
Lecture 6 - Probability
74
2) Additional rule. (Or, U, either)
a) Mutually exclusive events (can't occur together).
Two events are mutually exclusive if they cannot occur
at the same time.
P (E
1
U E
2
) = P (E
1
) +P (E
2
)
EX: if a baby has a 0·04% chance of being homozygous for the sickle
cell gene and a 3·92% chance of being a heterozygote, then the
probability that it carries the gene either as a homozygote or as a
heterozygote is 0·04 + 3·92 = 3·96%.
Ex: The probability that an individual belonging to blood
group A is 0.4 and the individual belonging to blood
group B is 0.3. What is the probability of the individual
belonging to blood group A or B?
As the variables are mutually exclusive events (can't
occur together), so:
P (E
1
UE
2
) = P (E
1
) +P (E
2
) = 0.4 +0.3 = 0.7
a) Not mutually exclusive events (can occur together).
P (E
1
UE
2
) = P(E
1
) +P(E
2
) )-P(E
1
and E
2
)
Ex: Using the information of table above, calculate the
probability of selection person dis. -ve or test -ve.
As the variables are not mutually exclusive events (can
occur together), so:
P (E
1
UE
2
) = P (E
1
) +P (E
2
)-P (E
1
and E
2
)
= [(90/100) + (89/100)] - (86/100) = 0.93
Ex: Suppose a certain ophthalmological trait determines
the eye color, 300 randomly selected individuals are
studied and the results are as follow:
1- P (trait) = 120/ 300 = 0.4
2- P (No trait) = 180/300 = 0.6
3- P (Blue eye) = 90/300 = 0.3
4- P (Brown eye)= 140/300 = 0.46
5- P (Yellow eye) = 70/300 = 0.24
6- P (Blue or Brown eye) = (90/300) + (140/300) =0.76
7- P (Blue eye and trait) = (120/300) x (70/120) = 0.23
8- P (Blue eye or trait) = (90/300) + (120/300) -(70/300)
= 0.23
9- P (Brown eye / trait) = (30/120) = 0.25
EX: From table below, what is the probability to have a
person that is CT scan –ve or CXR negative?
= 0.90 + .089 - 0.86 = .93 = 93%
The ideas of mutually exclusive and independence are
different. The way we work with them are also different.
We say the events of “heads” and “tails” in the outcome
of a single coin toss are mutually exclusive. A coin toss
cannot produce heads and tails simultaneously. Weight of
an individual classified as “underweight”, “normal”,
“overweight” The outcomes on the first and second coin
tosses are statistically independent and, therefore,
probability [“heads” on 1st and “tails” on 2nd ] =
(1/2)(1/2) = 1/4.
The distinction between “mutually exclusive” and
“statistical independence” can be appreciated by
incorporating an element of time. “heads on 1st coin toss”
and “tails on 1st coin toss” are mutually exclusive.
Probability [“heads on 1st” and “tails on 1st” ] = 0
Statistical Independence “heads on 1st coin toss” and
“tails on 2nd coin toss” are statistically independent
Probability [“heads on 1st” and “tails on 2nd ” ] = (1/2)
(1/2)
Group Work: Table below summarizes results of a study
to evaluate the CXR as diagnostic test for TB. The study
involved 240 patients with symptoms of fever and
prolong cough who were seen at a medical facility for the
diagnosis and treatment of chest diseases. Sputum
specimens obtained from each of the patients and
examined and the results obtained from CXR and sputum
exam were cross tabulated.

Lecture 6 - Probability
75
a. What is the probability that a patient has sputum +ve?
183/240= 76.25%
b. What is the probability that a patient has sputum -ve?
57/240=
c. What is the probability that a patient has CXR +ve?
184/240
d. What is the probability that a patient has CXR -ve?
56/240=
e. What is the probability that a patient has a positive CXR
and +ve sputum?
175/240 = 0.7292 OR = (183/240) (175/183)
f. What is the probability that a patient has CXR –ve and
sputum -ve?
48/240 = .20 OR = (57/240) (48/57)
g. What is the probability that a patient has CXR +ve giving
that sputum +ve?
175/183 = .9563 OR = (175/240) / (183/240) = 175/183
h. What is the probability that a patient with sputum -ve has
a negative CXR?
48/57 = .8421 OR = (48/240) / (57/240) = 48/57
i. What is the probability that a patient with sputum -ve has
a positive CXR?
9/57 = .1579 OR = (9/240) / ( 57/240) =9/57
j. What is the probability that a man with sputum +ve has a
negative CXR?
8/183 = .0437 OR = ( 8/240)/(183/240) = 8/183
k. What is the probability that a man with a positive CXR
has sputum +ve?
175/184 = .9511 OR = ( 175/240)/(184/240) = 175/184
l. A clinic similar to the one that conducted the CXR study
examines a man with symptoms of cough and prolong
fever and decides to order the CXR, which comes back
negative. What is the likelihood that this patient has TB?
What is the likelihood that he does not have it?
The probability that TB patient gives -ve CXR = 8/56 =
.1429
The probability that he does not have TB is = 48/56 =
.8571
m. Based on data in the above table, what is the probability
that a man who visits the clinic has a positive CXR or
sputum, or P(T+ or D+)?
= (148/240)+(183/240)-(175/240) = 192/240 = .80
n. Consider the probabilities P(Sputum+/CXR+) &
P(CXR+/Sputum+). Which would be more informative to
a physician who is interested in establishing a diagnosis
of TB in a patient?
Physicians frequently must interpret positive or negative
test results in an attempt to judge the likelihood of disease
in a given patient. Therefore, the probability of most
interest (from a diagnostic point of view) is the
probability of disease given a positive test result,
P(Sputum+/CXR+) or P(D+/T+).
EX: Cystic fibrosis is an autosomal recessive disease, and
it is manifested when a person carries two mutant alleles.
Parents of affected children are heterozygous carriers. A
healthy 26-year-old male comes for a routine health
maintenance examination. He recently got married, and
he is currently planning to have children. His younger
brother was recently diagnosed with cystic fibrosis, and
he wants to know his chances of carrying the abnormal
allele. Which of the following is the best response?
A) He has 25% chance of being a carrier
B) He has 50% chance of being a carrier T
C) He has 75% chance of being a carrier
D) He has 100% chance of being a carrier
The chance of being a carrier (i.e., the chance of carrying
one mutant allele) is 1/2, the chance of having the disease
(i.e., the chance of having two mutant alleles) is ¼, and
the chance of having both normal alleles is ¼.
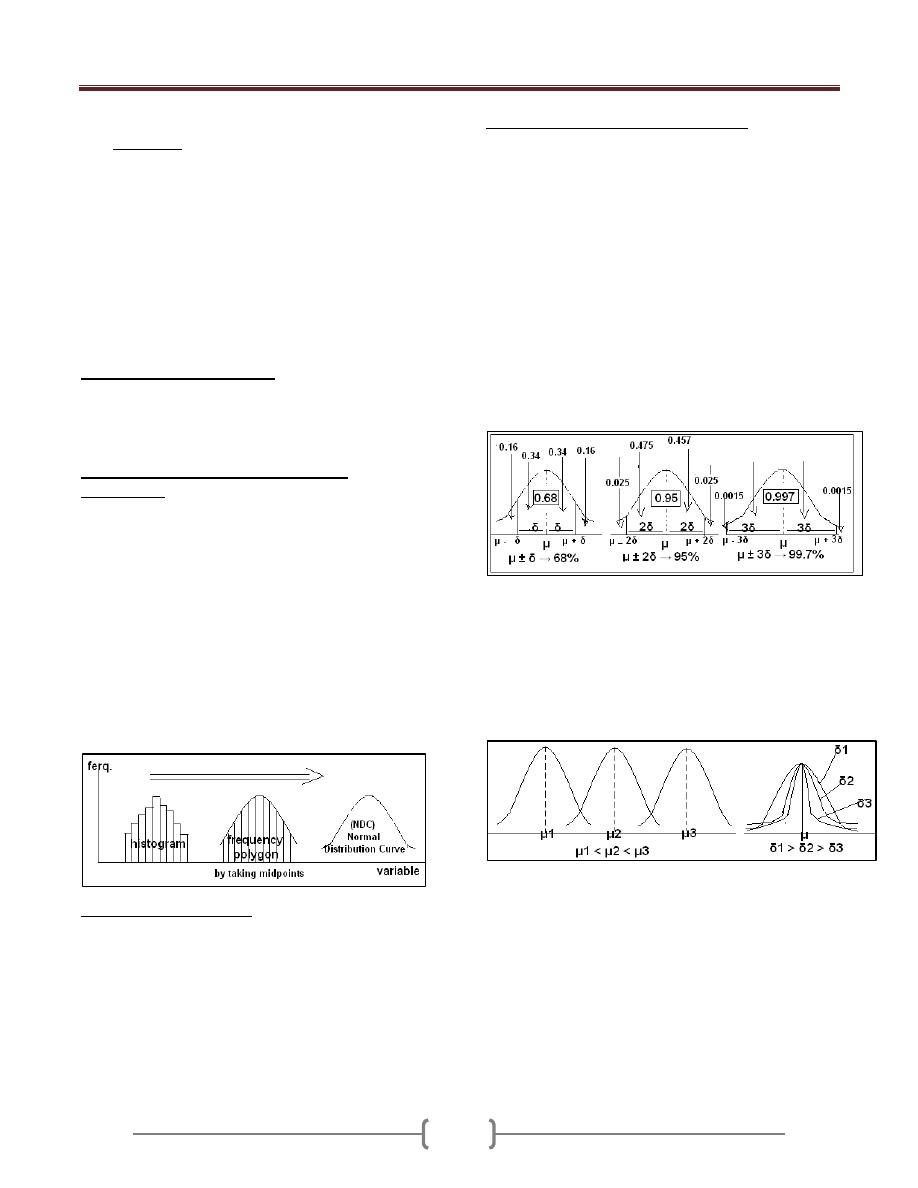
Lecture 7 - Probability distribution
76
One of the most important things to know about a variable
is its distribution. Knowledge of the probability
distribution of the variables provides the clinicians and
researchers with a powerful tool for summarization and
describing a set of data and for reaching conclusion about
population on the basis of a sample drawn from that
population. We have several types of distribution in
statistics, but the "normal distribution" is the most
important one.
A probability distribution defines the relationship between
the outcomes and their likelihood of occurrence.
We have
several types of distribution in statistics:
I. For discrete variables we have
a) Binomial Distribution: dichotomous outcomes (A-B,
heads-tails, yes-no, on-off, is-is not, right-wrong, etc.)
b) Poisson Distribution Useful for studying rare random
events.
II. But the “Normal distribution" "Gaussian
distribution", for continues variables is the most
important one. This is because:
Many human variables naturally have a “bell shaped”
distribution.
The distributions are tied to probabilities, and it is the
probability which will be of interest to us
If we have a group of continuous variables with certain
class interval, we can represent them by histogram and
frequency polygon. But suppose we have a group of
variables which is huge and the class interval is very
small so the frequency polygon will take a shape of very
smooth curve & that curve is called "normal distribution
curve"
The normal distribution
"Gaussian distribution",
"Bell Shaped distribution" is the most important
distribution in the statistics, the parameters of this
distributions are:
1) The mean (µ) → Measure of location.
2) The standard deviation (∂) →Measure of dispersion.
Characteristic of the normal distribution
1) Used for the continuous variables, between
2) Symmetrical about its mean (µ), ((either side of mean is a
mirror image of other side.
3) Mean, median, and mode are equal.
4) The total area under the curve is equal to one, 50% on the
left &50% on the right of a perpendicular erected at the
mean.
5) The normal distribution is completely determined by the
parameters (µ) & (∂). Different values of µ shift the graph
along the X-axis, while different values of ∂ shift the
graph along the Y-axis (determine the degree of flatness
or peakness of the graph).
6) µ ± 1∂ → 68% of the area.
µ ± 2∂ → 95% of the area.
µ ± 3∂ → 99.7% of the area.
Different values of μ and δ shift the graph of distribution
along X & Y axes. If we change μ while keeping δ
constant, the curve will shift to the right on increasing μ
& to the left on decreasing μ. On changing δ and keeping
μ constant; the curve will become more flat on increasing
δ and narrower on decreasing δ without any shifting the
curve to any side. μ1 < μ2 < μ3
Since we know the shape of the curve, we can (using
calculus) calculate the area under the curve
The percentage of that area can be used to determine the
probability that a given value could be pulled from a
given distribution.
Each normal distribution with its own values of m and s
(unit) would need its own calculation of the area under
various points on the curve
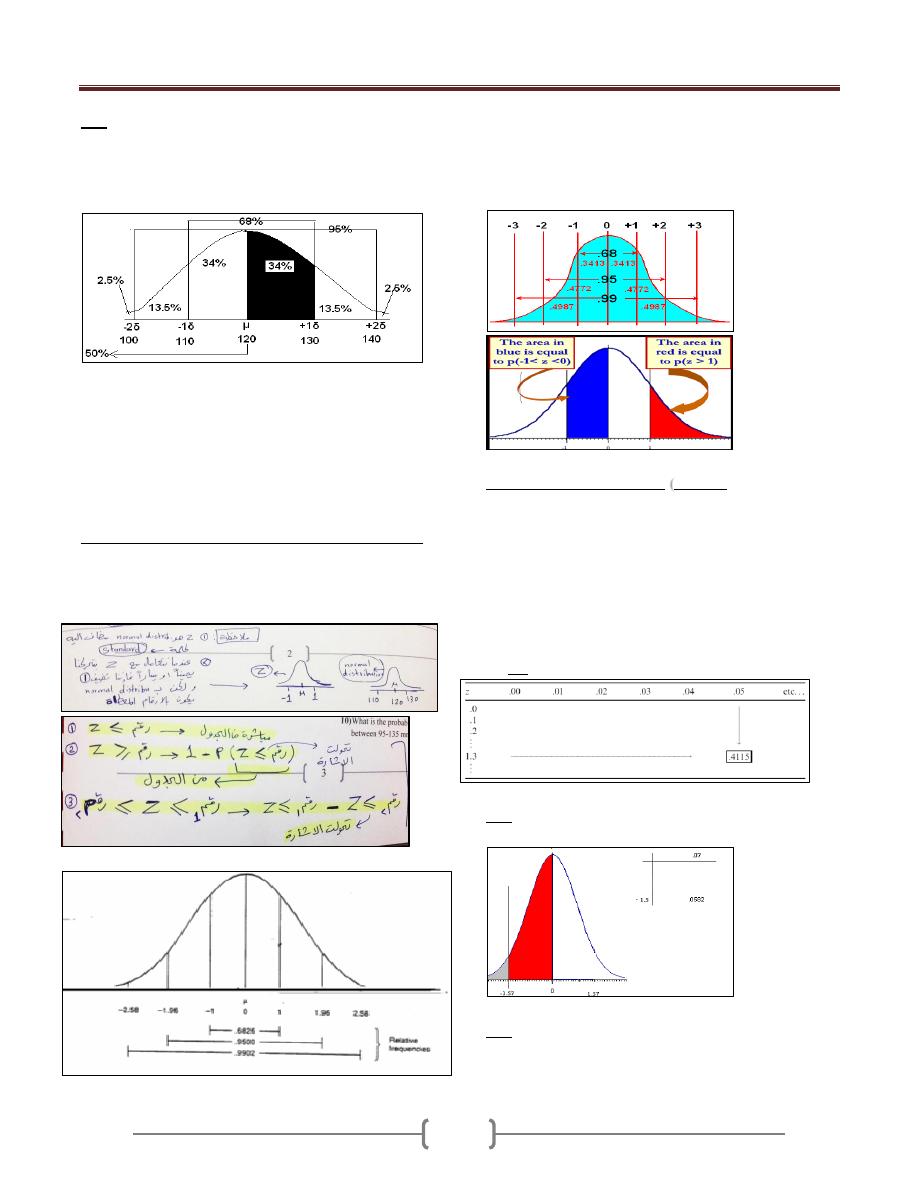
Lecture 7 - Probability distribution
77
If population mean of systolic blood pressure is 120
x:
E
mmHg with population standard deviation of 10 mmHg.
What is the probability of getting a patient with systolic
BP a) between 120 and 130 mmHg, b) < 120mmHg, c) <
100 mmHg d) between 120 and 125 mmHg?
Answers:
a) From 120 to 130 we move one δ, so the probability is
34% (0.34) (i.e. half of 68%).
b) Probability of less than 120 mmHg is 50%.
c) Probability of less than 100 mmHg is 2.5%.
d) Probability of SBP between 120 and 125 mmHg; we
must follow Z scale.
The standard normal distribution
“Z-distribution".
It's the normal distribution curve which has a mean of
zero and a standard deviation of one (µ=0, & ∂ =1). →
Z = x - µ/ ∂
If we know the population means and population standard
deviation, for any value of X we can compute a z-score by
subtracting the population mean and dividing the result by
the population standard deviation
Properties of Z Distribution
Z-score)
(
90% of the values of a normal variable lie within
1.65
sample standard deviations from the sample mean
95% of the values of a normal variable lie within
1.96
sample standard deviations from the sample mean
99% of the values of a normal variable lie within
2.58
sample standard deviations from the sample mean
How to Read Z Table ((Must understand Z table, area to
the left))
Ex: Find p(Z<-1.57)
From Z table=0.0582
EX: From Z table: Find P (z ≥ 1.58)
P(z < 1.58) = 0.9429
P(z > 1.58) = 1 - 0.9429 = 0.0571
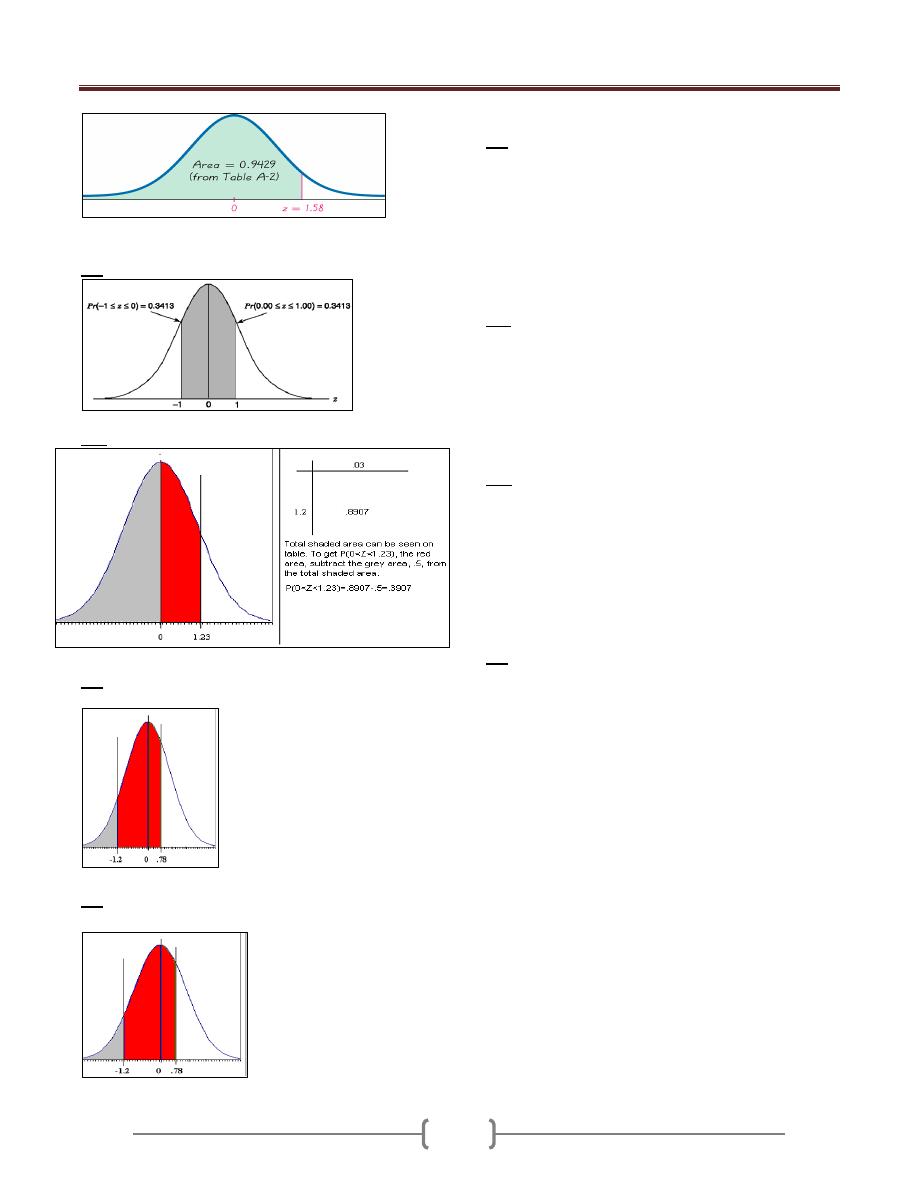
Lecture 7 - Probability distribution
78
Ex: From Z table find: Pr(-1 < z < 1) = 0:6826
Ex: Find p(0<Z<1.23)
Ex:
Calculate p(-1.2<Z<0.78)
p(-1.2<Z<0.78)= 0.7823-0.1151=0.6672
Ex:
Calculate p(-1.2<Z<0.78)
p(-1.2<Z<0.78)= 0.7823-0.1151=0.6672
Ex: What is the probability of having a patient with B.P
between 110-130 mm Hg? µ=120, ∂ =10. ((Suppose the
B.P is normally distributed)).
Z = x - µ/ ∂
= 110-120/10 =-1
= 130-120/10 = +1
P (110≤ x ≤ 130) → P(-1≤ Z ≤+ 1). &From the Z-table,
P=0.68.
Ex2: What is the probability of having a patient with B.P
above 140mm Hg?
Z = x - µ/ ∂
= 140-120/10 = +2
P(x ≥ 140) → P ( Z ≥ +2). &From the Z-table,
P=0.023.
Ex: If the total cholesterol values for a certain target
population are approximately normally distributed with a
mean of 200 (mg/100 mL) and a standard deviation of 20
(mg/100 mL), what is the probability that a person picked
at random from this population will have a cholesterol
value greater than 240 (mg/100 mL)?
Z = x - µ/ ∂ = 240-200/ 20 = 2
P (x >240) → P(Z > 2). = 0:0228 or 2.28%
Ex: in certain population the mean of SBP (µ=120), and ∂
=10mmHg. What is the probability of having a patient
with B.P between 110-130 mm Hg?
1) What is the probability of having a patient with B.P
between 105-125 mm Hg?
2) What is the probability of having a patient with B.P ≤
100 Hg?
3) What is the probability of having a patient with B.P ≥
135 mm Hg?
4) What is the probability of having a patient with B.P
between 120-140 mm Hg?
5) What is the probability of having a patient with B.P
between 100-140 mm Hg?
6) What is the probability of having a patient with B.P
between 90-150 mm Hg?
7) What is the probability of having a patient with B.P
between ≥ 150 mm Hg?
8) What is the probability of having a patient with B.P
between ≤150 mm Hg?
9) What is the probability of having a patient with B.P
between 140-150 mm Hg?
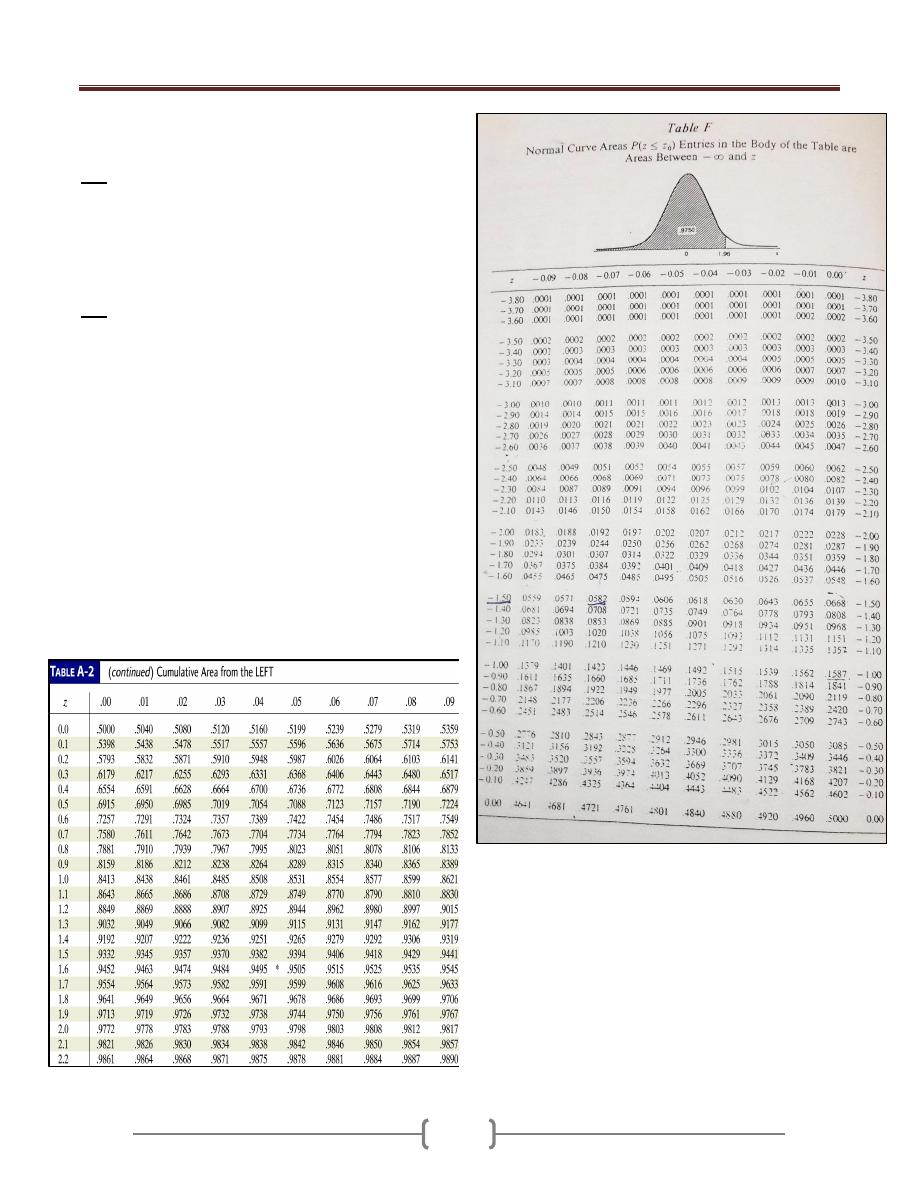
Lecture 7 - Probability distribution
79
10) What is the probability of having a patient with B.P
between 95-135 mm Hg?
EX: IQ’s are normally distributed with mean 100 and
standard deviation 15. Find the probability that a
randomly selected person has an IQ
1) between 100 and 115
2) More than 135.
3) Less than 70.
EX: A survey was done to measure the haemoglobin
(Hb) levels among a group of pregnant women attending
an ante-natal clinic. 10000 women were screened and the
mean Hb was found to be 10.5 gm%.The standard
deviation was 0.5. Compute:
1) Number of women having Hb level between 10 and 11
gm%
2) Number of women having Hb level between 9.5 and
11.5 gm%
3) Number of women having Hb level above 10.5 gm%.
4) Number of women having Hb level below 9 gm%.
5) Number of women having Hb level between 11 gm%
and 11.5 gm%.
6) Number of women having Hb level below 9 gm% and
above 12 gm%.
7) What is the probability of selecting a pregnant woman
with Hb levels below 10 gm%?
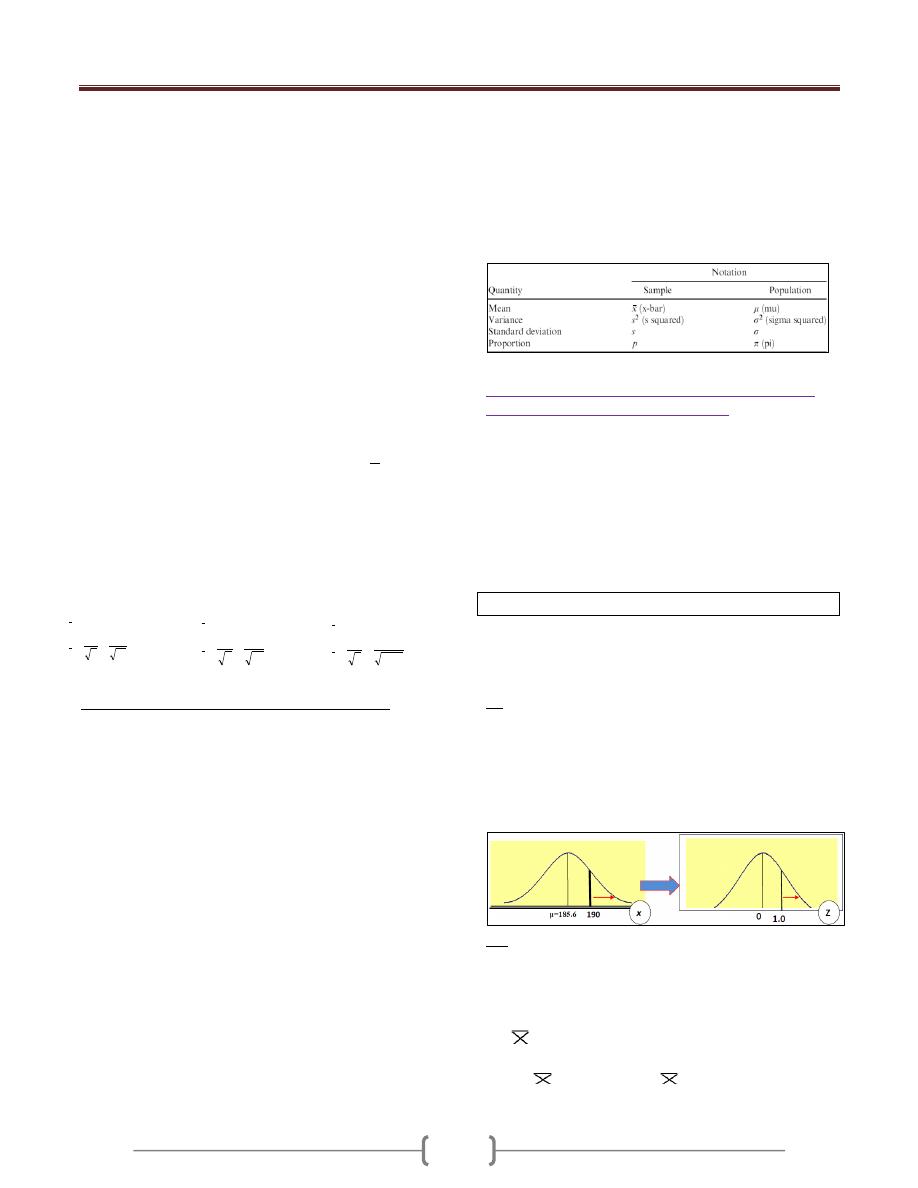
Lecture 8 - Sampling distribution
80
It is the distribution of all possible values of statistics
computed from samples of the same size randomly drawn
from the same population.
When sampling is from normally distributed population,
the distributions of the sample will possess the following
properties:
1) The distribution of the sample means(x) will be normal.
2) The mean of the distribution of the x will be equal to the
mean of population (µ).
3) The variance of the distribution of X will be equal to the
variance of the population divided by the size of the
sample ∂
2
/n = ∂/√n.
As the sample size increase, the following of distribution
of sample mean to normal distribution will be increase.
Sampling error: is the difference between the value of a
sample statistic and the value of the corresponding
population parameter. In the case of the mean,
EX: In a recent exam, assume that the distribution of
scores of all examinees is normal with the mean of 1020
and a standard deviation of 153. Calculate the mean and
standard deviation of and describe the shape of its
sampling distribution when the sample size is 16, 50,
1000
Steps in constructing sampling distribution:
1) Form a population of size (N) and randomly draw all
possible samples of size (n). EX: If there is a population
of 5 individuals & we want to take a sample of size 2,
then we can draw 10 samples, and so 10 probabilities for
a sample of size 2.
2) For each sample we compute the statistic of interest
(sample mean).
3) Make a table for the observed value of the statistic and its
corresponding frequencies. So for every value of a
statistic we have certain frequency and we take the mean
of every sample with its corresponding frequency and by
plotting on the X and Y axes, we will get a normal
distribution curve. So the change is from X to μ
x
curve
and we can convert it into z table and find the
corresponding probability as.
The distribution of μx will be normal.
The mean of the distribution of the values of μ
x
will be
the same as the mean of the population from which the
samples were drawn. (i.e. if we get all the possible
samples and take the mean of each one and them take
the mean of these means; we will get the underlying
population mean).
The variance of the distribution of μ
x
, will be equal to
the variance of the population divided by the sample
size; = δ
2
/n, which is the variance of the underlying
population divided by the sample size. (standard error)
δ
2
x = variance / sample size = δ
2
/n or δ/√n
Z-value for Sampling Distribution of the Mean
(Distribution of the sample mean):
When sampling is from a normally distributed population
then the mean of the sample will follow the normal
distribution, while if sampling is from a non-normally
distributed population it will follow the central limit
theory; with increasing sample size sampling will
approximate the normality or its curve will be similar to
that of NDC, e.g. a sample of 1000 person will follow the
normal distribution more than a sample of 5 persons.
Z = (x - µ) / (∂/√n)
** It is important to know that we use Z-distribution when
the variance (or standard deviation) of the population is
known or the sample size more than 60.
Ex If the cranial length of certain large human population
which is normally distributed µ= 185.5 mm and ∂ = 12.7
mm, what is the probability of a random sample of size
n=10 from this population will have x ≥ 190mm?
Z = (x - µ) / (∂/√n)
= (190-185)/ (12.7/√10) = 1.09.
P(x ≥ 190) → P ( Z ≥ 1.09). & From the Z-table, P=0.1379.
Ex: If the mean and standard deviation of serum iron
values for health men are 120 and 15 μg per 100 ml,
respectively, what is the probability that a random sample
of 50 normal men will yield a mean between 115 and 125
per 100 ml?
Z =
- μ / (δ/√n) = (115-120)/(15/√50) = -2.36
(125-120)/(15/√50) = 2.36
P (115≤
≤ 125) = P(-2.36≤
≤ 2.36) = 0.9909-0.0091=
0.9818
250
.
38
16
153
1020
n
x
x
637
.
21
50
153
1020
n
x
x
838
.
4
1000
153
1020
n
x
x
x
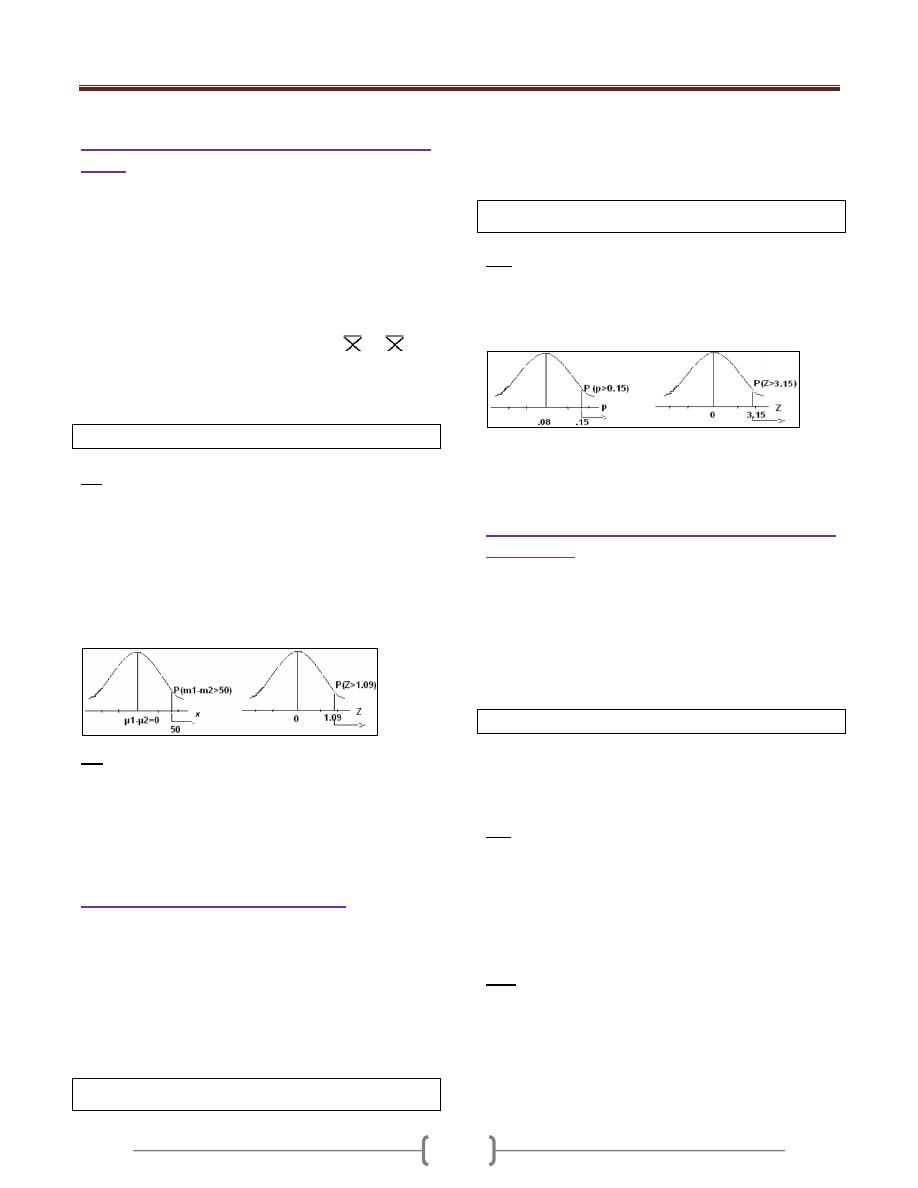
Lecture 8 - Sampling distribution
81
Distribution of the difference between two sample
means
Giving 2 normally distributed population with means of
µ
1
& µ
2
and variances of ∂
1
& ∂
2
, the random samples
drawn from these population with size n
1
& n
2
are
normally distributed and the difference between the
means (x
1
-x
2
) will be also normally distributed, with mean
equal to (µ
1
- µ
2
) and variance equal to (∂
1
2
/ n
1
)+ (∂
2
2
/ n
2
).
Or Tow normally distributed population with means of
(μ
1
) & (μ
2
) and variances of (δ
2
1
) & (δ
2
2
) respectively. The
sampling distribution of the difference of
1
ــ
2
between the means of independent samples of size n
1
& n
2
drawn from these populations is normally distributed with
mean μ
1
-μ
2
and variance of [√(δ
2
1
/n
1
) + ( δ
2
2
/n
2
)].
Z =(x
1
-x
2
) - (µ
1
- µ
2
) / √ (∂
1
2
/ n
1
)+ (∂
2
2
/ n
2
).
Ex. If the level of vit.A in the liver of 2 human population
normally distributed ∂
1
2
= 1900, ∂
2
2
= 8100. What is the
probability that random sample of size n
1
= 15 & n
2
= 10
will give a value of (x
1
-x
2
) ≥50? Suppose there is no
difference in population means.
Z =(x
1
-x
2
) - (µ
1
- µ
2
) / √ (∂
1
2
/ n
1
)+ (∂
2
2
/ n
2
).
= 50- 0 / √ 1900/15 + 8100/10 = 1.09
P(x
1
-x
2
≥ 50) → P (Z ≥ 1.09). & From the Z-table,
P=0.1379.
Ex: For population of 17 year-old, the means & standard
deviations of subscapular skinfold thickness values (in
mm) for boys 9.7 & 6 & for girls 15.6 & 9.6 respectively.
Simple random samples of 40 boys & 35 girls are
selected, what is the probability that the difference
between sample means will be greater than 10? 0.0139
Distribution of the sample proportion
Proportion = part/whole (the numerator is part form the
denominator).
When the sample size is large ((≥30)), the distribution of
sample proportion (P) is approximately normally
distributed. The mean of the distribution will be equal to
the true population proportion, and the variance of the
distribution will be equal to P (1-P)/n. We can use Z-
distribution, and to calculate Z:
Z= [
p
ˆ
-P] / [√P (1-P)/n]
Or The
distribution is binomial, but for larger samples (≥
30) the distribution will be approximately normally
distributed and have the following characteristics:
μ
p
= P, δ
2
p
= {P(1-P)}/n & δ
p
= √[{P(1-P)}/n ],
so Z= [
p
ˆ
-P] / [√P (1-P)/n]
Ex: suppose in a certain human population the proportion
of color blindness is 8%, if randomly we select 150
individuals from this population, what is the probability
that the proportion of color blindness in this sample will
be greater than 15%?
Z= [
p
ˆ
-P] / [√P (1-P)/n]
= [0.15-0.08] / [√o.o8 (1- 0.08) /150] = 3.15
P(P ≥ 15%) → P (Z ≥ 3.15). & From the Z-table, P=0.0008
Distribution of the difference between two sample
proportions:
If independent random samples of size n
1
& n
2
are drawn
from two populations where the proportions of
observation in the two populations are P
1
& P
2
, the
distribution of the difference between samples proportions
(P
1
- P
2
) is approximately normally and the variance of the
distribution will be equal to[ P
1
(1-P
1
)/n
1
]+ [P
2
(1-P
2
)/n
2
] .
We can use Z-distribution, and to calculate Z:
Z= (P
1
-P
2
) - (P
1
-P
2
) / √[P
1
(1-P
1
)/n
1
]+ [P
2
(1-P
2
)/n
2
]
Characterized by: μP
1
-P
2
= P
1
-P
2
δ
2
P
1
-P
2
={P
1
(1-P
1
)}/n
1
+ {P
2
(1-P
2
)}/n
2
→ δP
1
-P
2
=
√[{P
1
(1-P
1
)}/n
1
+ {P
2
(1-P
2
)}/n
2
], so
Z = [(P
1
-P
2
)-(P
1
-P
2
)] / √[{P
1
(1-P
1
)}/n
1
+ {P
2
(1-P
2
)}/n
2
]
Ex: In a certain population of teenagers the proportion of
obese boys (P
1
= 10%), and the proportion of obese girls
(P
2
= 10%), what is the probability that a random sample
of boys n
1
=250 and girls n
2
= 200 will yield P
1
-P
2
≥ 0.06?
Z= (P
1
-P
2
) - (P
1
-P
2
) / √ [P
1
(1-P
1
)/n
1
] + [P
2
(1-P
2
)/n
2
]
= (0.06)-(0.1-0.1) / √ [0.1(1-0.1)/250] + [0.1(1-0.1)/200] = 2.11
P (P
1
-P
2
) ≥ 0.06→ P (Z ≥ 2.11). & From the Z-table, P=0.017
Ex: A random sample of medical students from third &
fifth years was chosen to study the extent of self-
medication practices among them. Out of 110 students in
the 3
rd
year, 38% reported self-medication compared to 60
out of 95 of fifth year students. Apply a suitable statistical
test to confirm apparent difference in self medication
practices between the 2 groups of medical students
.
_ _
~

Lecture 9 - Hypothesis testing
82
Hypothesis; A statement about one or more population.
The hypothesis usually concern with the parameters of the
population about which statement is made.
The purpose of the hypothesis testing is to help the
clinician, researcher, and administrator in reaching a
decision concerning a population based on results of a
sample that drawn from this population.
The procedures of hypothesis testing:
Understand the nature of the data (to determine the
particular test employed).
State the hypothesis
a) Null hypothesis or tested hypothesis (H
0
): Hypothesis
of no difference, hypothesis of equality.
b) Alternative hypothesis (H
A
): It disagree the null
hypothesis (e.g. there is difference).
Find the tabulated Z, t or X
2
values (type of the test
depends on the type of the data) according to
⍺ (usually
0.05).This will present the "critical values" that separate
the acceptance region from rejection regions.
Find the calculated Z, t or X
2
values (type of the test
depends on the type of the data).
Compare between the tabulated and calculated values, If
the calculated value falls in the acceptance area ➨ we
accept the H
0
-hypothesis, but If the calculated value falls
in the rejection area ➨ we reject the H
0
-hypothesis in
favoring the alternative one (H
A
).
Conclusion. We accept the H
0
-hypothesis ➨We conclude
that there is no difference or association, but if we reject
the H0-hypothesis then we favoring the alternative one
(H
A
) and we conclude the H
A
may be true.
1) Hypothesis testing for single population mean and
known population variance. ''Calculated Z-value= (x-
µ) /(∂/√n)''
A certain breed of rats show as a mean weight gain of 65
gm during the first 3 months of life with a variance of 10
gm
2
. A sample of 16 of these rats were fed a new diet
from birth until the age of 3 months, their mean weight
gain was 60.75 gm. Does this mean that the new diet case
reduction in Wt gain at 0.05 level of significant? Test this
hypothesis.
(H
0
): x = µ (no difference).
(H
A
): x ≠ µ (difference exists)
Tabulated Z:
⍺= 0.05 1- ⍺= 95%
Z = ±1.96 (critical value).
Calculated Z = (x-µ) / (∂/√n)
= 60.57- 65 / √10 /√16 = -5.38
Comparison: since the calculated Z value > tabulated Z
(falls in the rejection area), so we reject (H
0
) in favoring
the alternative one (H
A
) which states that the difference
between x & µ is statistically significant.
Conclusion: we may conclude that the new diet cause
reduction in WT (-ve value).
2) Hypothesis testing for single population mean and
unknown population variance (Sample size ≤ 30).
''Calculated t-value= (x-µ) /(S/√n)''
Ex: In the previous example, if the population variance
was unknown and the sample SD= 3.84 gm. Does this
mean that the new diet case reduction in Wt gain at 0.05
level of significant? Test this hypothesis.
(H
0
): x = µ (no difference).
(H
A
): x ≠ µ (difference exists)
Tabulated t:
⍺= 0.05 1- ⍺/2= 0.975, df= n-1
t = ±2.1315 (critical value).
Calculated t = (x-µ) / (S/√n)
= 60.57- 65 / 3.84 /√16 = -4.43
Comparison: since the calculated t value > tabulated t
(falls in the rejection area), so we reject (H
0
) in favoring
the alternative one (H
A
) which states that the difference
between x & µ is statistically significant.
Conclusion: we may conclude that the new diet cause
reduction in Wt (-ve value).
3) Hypothesis testing for the difference between two
population means when population variances are
known.
''Calculated Z-value= (x
1
-x
2
)-(µ
1
-µ
2
) / √
[(∂
2
1
/n
1
) + (∂
2
2
/n
2
)]
Ex: 70 patients suffering from epileptic fit were dividing
into two groups equally. Group 1 placed on treatment
(Tegretol, 200mg x 2) and group 2 placed on placebo. The
mean of the number of seizures experienced during the
period of treatment by the two groups were 15 and 24
consequently, the population variances were 8 and 12, do
these data provide sufficient evidence to indicate that
''Tegretol'' is effective drug in reducing the number of
seizure at 0.05 level of significant
(H
0
): µ
1
=µ
2
(no difference).
(H
A
): µ
1
≠µ
2
(difference exists)
Tabulated Z:
⍺= 0.05 1- ⍺= 95%

Lecture 9 - Hypothesis testing
83
Z = ±1.96 (critical value).
Calculated Z = (x
1
-x
2
)-(µ
1
-µ
2
) / √ [(∂
2
1
/n
1
) + (∂
2
2
/n
2
)]
= (15 – 24) – 0 / √ (8 /35) + (12/35) = -11.9
Comparison: since the calculated Z value > tabulated Z
(falls in the rejection area), so we reject (H
0
) in favoring
the alternative one (H
A
) which states that the difference
between µ
1
and µ
2
is statistically significant.
Conclusion: we may conclude that ''Tegretol'' is
effective in reducing no. of seizures.
4) Hypothesis testing for the difference between two
population means when population variances are
unknown (Sample size ≤ 30).
''Calculated t-value= (x
1
-x
2
)-(µ
1
-µ
2
) / √ [(S
2
1
/n
1
) +
(S
2
2
/n
2
)].
Ex: Median nerve conducting velocity values were
recorded for 10 subjects with a diagnosis of mercury
poisoning, similar determination also were made for 15
apparently healthy subjects. The results were as follow:
Group
N
Mean(sec\mm)
S(sec\mm)
With
poisoning
10 55
6
Healthy
15 63
5
Do these data provide sufficient evidence to indicate that
nerve conducting velocity was affected by mercury
poisoning?
(H
0
): µ
1
=µ
2
(no difference).
(H
A
): µ
1
≠µ
2
(difference exists)
Tabulated t:
⍺= 0.05 1- ⍺/2 = 0.975 df= 10+15-2= 23
t = ±2.068 (critical value).
Calculated t = (x
1
-x
2
)-(µ
1
-µ
2
) / √ [(S
2
1
/n
1
) + (S
2
2
/n
2
)]
= (55 – 63) – 0 / √ (36 /10) + (25/15) = -3.485
Comparison: since the calculated t value > tabulated t
(falls in the rejection area), so we reject (H
0
) in favoring
the alternative one (H
A
) which states that the difference
between µ
1
and µ
2
is statistically significant.
Conclusion: we may conclude that mercury poisoning
reduce nerve conduction.
5) Hypothesis testing for single population proportion
(P)
"Calculated Z= (P-P)/√P (1-P)/n"
Ex: Suppose we are interesting in knowing what
proportion of automobile driver regularly wear seat belts.
In survey of 300 adults, 123 said they regularly were seat
belts. Can we conclude from these data that in this sample
the proportion who regularly wears seat belts is not 50%?
(H
0
): P = P (no difference).
(H
A
): P ≠ P (difference exists)
Tabulated Z:
⍺= 0.05 1- ⍺= 95%
Z = ±1.96 (critical value).
Calculated Z = (P-P)/√P (1-P)/n
(0.41- 0.5) /√0.5 (1-0.5)/300 = -3.11
Comparison: since the calculated Z value > tabulated Z
(falls in the rejection area), so we reject (H
0
) in favoring
the alternative one (H
A
) which states that the difference
between p & p is statistically significant.
Conclusion: we may conclude that in this sample the
proportion who regularly wears seat belts is not 50%
(less, -ve value).
6) Hypothesis testing for the difference between two
populations proportions (P
1
-P
2
). We also use z-test and
the formula is;
Calculated Z = (P
1
-P
2
) - (P
1
-P
2
) /√ [(P
1
(1- P
1
)/ n
1
) + P
2
(1- P
2
)/ n
2
)]
Ex: In a study of DM, we have the following results
obtained from samples of male and female. Male n
1
=150,
no. of DM=21. Female n2=200, no. of DM=48. Can we
conclude from these data that there is a difference in the
proportion of DM between the two samples?
(H
0
): P
1
= P
2
(no difference).
(H
A
): P
1
≠ P
2
(difference exists)
Tabulated Z:
⍺= 0.05 1- ⍺= 95%
Z = ±1.96 (critical value).
Calculated Z = (P
1
-P
2
) - (P
1
-P
2
) /√ [(P
1
(1- P
1
)/ n
1
) + P
2
(1- P
2
)/ n
2
)]
(0.14- 0.24)-0 /√ [0.14 (1-0.14)/150] + [0.24(1-0.24)/200]
= -58.38
Comparison: since the calculated Z value > tabulated Z
(falls in the rejection area), so we reject (H
0
) in favoring
the alternative one (H
A
) which states that the difference
between P
1
& P
2
is statistically significant.
Conclusion: we may conclude that in this sample the
proportion who regularly wears seat belts is not 50%
(less, -ve value).
Lecture 9 - Hypothesis testing
84
7) Hypothesis testing in pair comparison.
Calculated t= [d- µd] / [Sd/√n]
Ex: A group of 15 boys (12 years old), were measured for
height by 2 nurses, the results were as in the table below.
Do these data justify the conclusion that that there is a
difference in the accuracy of the 2 nurses?
d (mean difference) = ∑d / n = 3.7 / 15 = 0.75 Cm
Sd =√ [n ∑d
2
- (∑d)
2
] / [n(n-1)]
= √ [15(3.05) – (3.7)
2
]\ [15(15-1)] = 0.33
(H
0
): µd = 0 (no difference).
(H
A
):µd ≠ µ (difference exists)
Tabulated t:
⍺= 0.05 1- ⍺/2= 0.975, df= n-1
t = ±2.144 (critical value).
Calculated t = [d- µd] / [Sd/√n]
= 0.75- 0 / 0.33 /√15 = 3.125
Comparison: since the calculated t value > tabulated t
(falls in the rejection area), so we reject (H
0
) in favoring
the alternative one (H
A
) which states that µd ≠ µ, the
difference is statistically significant.
Conclusion: we may conclude that there is a difference
in the accuracy of height measurement between the 2
nurses.
8) Hypothesis testing in Chi-Square distribution (X
2
-
test).
Calculated X
2
= ∑ (O-E)
2
/E
Ex: In a study for the association between increasing
diastolic blood pressure and CVA development, 200
individuals were followed for 5 years, the results is shown
in below table. Do these data suggest an association
between increasing diastolic blood pressure and
development of CVA? Test a reasonable hypothesis. (
⍺=
0.05)
Diast. B.P
(mm Hg)
Development of CVA
Yes No
Total
70-79
1
49
50
80-89
4
46
50
90-99
6
44
50
≥ 100
13
37
50
Total
24
176
200
(H
0
): No association between increasing diastolic BP &
CVA.
(H
A
): Association exists.
Tabulated X
2
: (
⍺= 0.05), df =(r-1)(c-1) =3
From X
2
-distribution table ➨The tabulated value is 7.815
Calculated X
2
=
∑ (O-E)
2
/E
From the table above (observed values), we calculate the
expected values for each cell in the table using the
formula: E= [Raw margin X Column margin] / Grand
total.
Expected values (E).
Diast. B.P
(mm Hg)
Development of CVA
Yes No
Total
70-79
6
44
50
80-89
6
44
50
90-99
6
44
50
≥ 100
6
44
50
Total
24
176
200
Calculated X
2
= 14.78
Comparison: since the calculated X
2
value > tabulated X
2
(falls in the rejection area), so we reject (H
0
) in favoring
the alternative one (H
A
) which states that the association
between increasing diastolic blood pressure and
development of CVA is statistically significant.
Conclusion: we may conclude that the increasing in
diastolic blood pressure lead to development of CVA.
No.
Height (cm)
Difference (d)
(N
2
-N
1
)
d
2
Nurse 1
Nurse 2
1
2
3
4
5
6
7
8
9
10
11
12
13
14
15
142.9
150.9
151.9
158.1
151.2
160.2
157.8
150.1
142.1
159.9
141.9
140.8
147.1
143.6
139.9
143
151.5
152.1
158
151.5
160.5
158
150
142.5
160
142
141
148
144
141
0.1
0.6
0.2
-0.1
0.3
0.3
0.2
-0.1
0.4
0.1
0.1
0.2
0.9
0.4
1.1
0.01
0.36
0.04
0.10
0.09
0.09
0.04
0.01
0.16
0.01
0.01
0.04
0.81
0.16
1.21
∑d=3.7
∑d
2
=3.05

Lecture 10 - The t-distribution & t-test ((Student's t-test))
85
In a case when the population variance (∂
2
) is unknown &
the sample size is small (n≤30), we can use the sample
variance (S
2
) as a best point estimator for ∂
2
but in this
situation the distribution will not follow the standard
normal distribution (Z-distribution) but follow the t-
distribution.
The characters of t-distribution:-
1) It has a mean of zero.
2) Symmetrical about the mean.
3) Range between - ∞ & +∞.
4) Compared with the normal distribution, its curve is less
peaked and higher tails.
5) The quantity of (n-1) which is called degree of freedom
(df) is used in computing S
2
[There is a different
distribution for each sample value of (n-1)].
6) The t- distribution approaches normal distribution as (n-1)
value approaches infinity (increase the sample size).
How can we get the t-value?
As in standard normal distribution in which we have the
Z-table, here we have the t-table which depend on the df=
(n-1) → Row of the table &
⍺ (probability of error) = t
1 -
⍺
/2
→ column of the table.
Application of the t-test:
T-test can be applied for the following situations: (Not
much different than of Z- test)
1)
Is the
sample mean differs significantly from the
population mean
. [Small sample size (n≤30), and the
population variance (∂
2
) is a known]. We use the
following formula:
t=(x-µ) /(S/√n)
Ex: A certain breeds of rats show a mean weight gain of
65gm during the first 3 months of life, a sample 16 0f
these rats was taken and feed a new diet from birth until
the age of 3 months, the mean weight was 60.75gm with
S= 3.84gm. Is this mean differ significantly from
population mean?
t=(x-µ) /(S/√n)
= (60.75 – 65) / (3.84/√16) = -4.43
From the t-table (
⍺=0.05): t
1 -
⍺
/2
, df =15.
The difference between x & µ is statistically significant.
2) Comparing the significant difference between two
samples means
. [Small sample size (n≤30) and the
population variance (∂
2
) is a known]. We use the
following formula:
t=(x
1
- x
2
) - (µ
1
-µ
2
) /√ ([S
2
1
/n
1
] + [S
2
2
/n
2
])
df= n
1
+ n
2
-2
Ex: In a comparison between two groups of patients with
diverticulitis on two different types of treatment n
1
=15, n
2
=12. The recovery time in hours x
1
=68.4 hrs & S
1
=286
hrs and x
2
= 83.43 hrs & S
1
=290 hrs. Is the difference
between the means of hrs is statistically significant?
t=(x
1
- x
2
µ
1
) - (µ
1
-µ
2
) /√ ([S
2
1
/n
1
] + [S
2
2
/n
2
])
= (68.4 -83.43)- 0 / √ (286/15) + (290/12) = - 2.28
From the t-table: t
1 -
⍺
/2
, df= n
1
+ n
2
-2 =25. (
⍺≤0.05)
The difference between x
1
& x
2
is statistically significant.
3) Pairing.
Many studies are designed to produce observation in pair
e.g., single individual has pair of reading (before & after),
for example measurement of BP before and after
treatment Or when the same volunteers or participants
pass through 2 different situations (each one has 2
readings e.g. as for 2 drugs, 2 different doses for the same
drug, drug and placebo, or rest & exhaustion…).
To deal with such condition we do:
a) We find the difference (d).
b) We calculate the differences, and find the mean of
differences (d).
c) We calculate the Sd of the difference using the following
formula:
Sd =√ [n ∑d
2
- (∑d)
2
] / [n(n-1)]
d) The df =n-1, because we have one sample although
having two readings.
e) To calculate the value of t we use the following formula;
t= [d- µd] / [Sd/√n]

Lecture 10 - The t-distribution & t-test ((Student's t-test))
86
Ex: In pediatric clinic, a study was done to see the
effectiveness of certain antipyretic drug in 12 years old
children suffering from influenza , their temperature had
taken immediately before and 1 hr after administration of
the drug. The following results were found:
No.
Temperature(c
o
)
before –After
differences(d)
d
2
before
After
1
2
3
4
5
6
7
8
9
10
11
12
39.1
39.6
38.3
39.4
38.4
38.2
39.2
39.5
39.3
39.1
38.8
38.6
37.6
37.8
37.9
38.4
37.7
37.9
38.3
38.8
38.2
38.4
38.5
37.9
1.5
1.8
0.9
1.0
0.7
0.3
0.9
1.7
1.1
0.7
0.3
0.7
2.25
3.24
0.81
1.0
0.49
0.09
0.81
2.89
1.21
0.49
0.09
0.49
∑d=11.6
∑d
2
=13.86
d (mean difference) = ∑d / n = 11.6 / 12 = 0.97 C
o
Sd =√ [n ∑d
2
- (∑d)
2
] / [n(n-1)]
= √ [12(13.86) – (11.6)
2
]\ [12(12-1)] = 0.49
t= [d- µd] / [Sd/√n] = [0.97-0] / [0.49/√12] = 6.9
From the t-table (
⍺≤0.05): t
1 -
⍺
/2
, df =11.
The difference between before and after is statistically
significant.
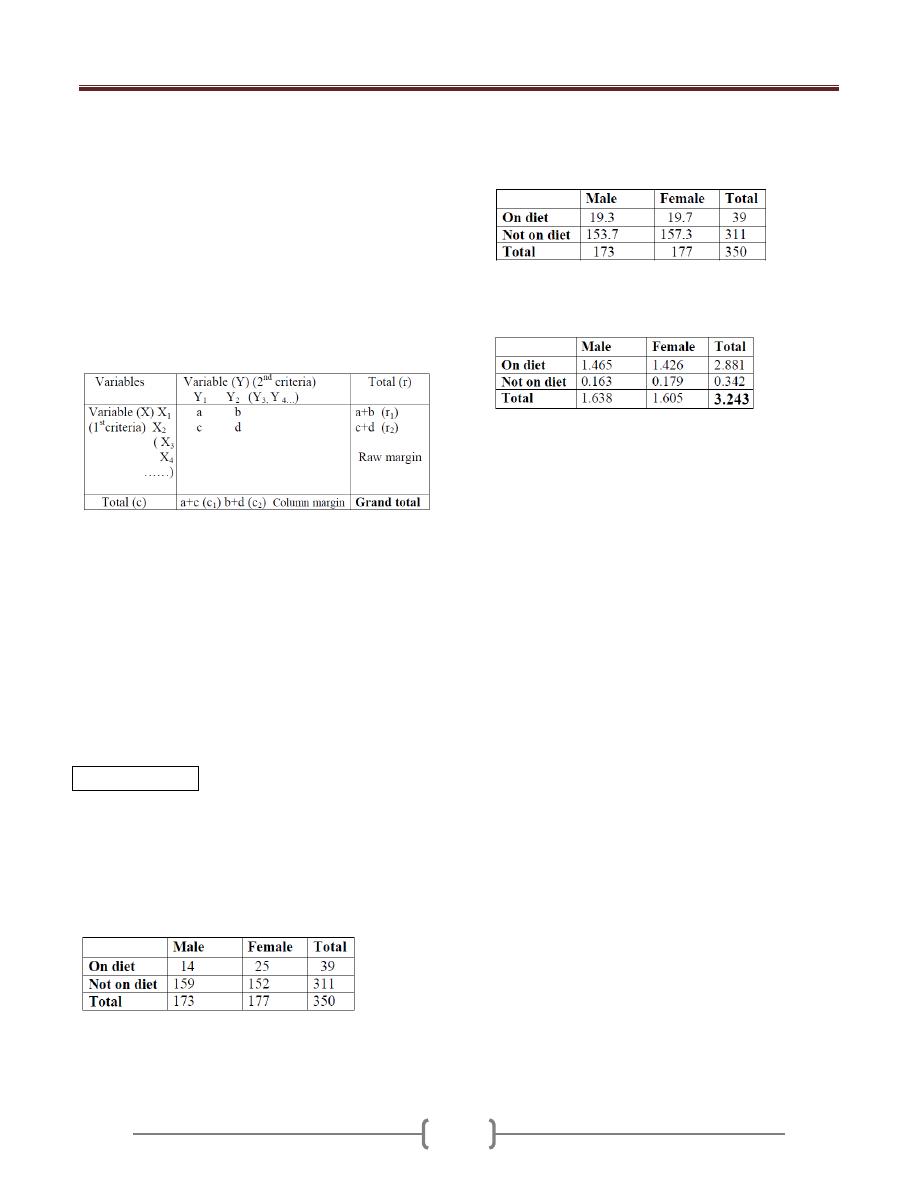
Lecture 11 - The Chi-Square distribution (X2-test)
87
Is the most frequently employed statistical technique for
analysis of count or frequency data to find the
association between two variables or more.
X
2
-test statistic is most appropriate for use with
qualitative (categorical) variables e.g. marital status
(single, married, widowed), or with discrete numerical
variable ➨ Used for the frequencies associated with these
variables (most accurate when the variable is
dichotomous e.g. life or death, disease or not, male or
female….etc.).
X
2
-test is used to whether there is an association between
the raw variable and the column variable.
Chi-Square distribution may be derived from the normal
distribution, but it is a skewed distribution (not normal),
started from zero and has only one tail (only positive
values). It depends on:
1) Observed values (O); number of subjects in our sample
that fall into the various categories of the variable of
interest (data of the sample).
2) Expected values (E); number of subjects that we would
expect to observe in our sample if the null hypothesis is
true. To calculate the expected values: (E)= [Raw margin
X Column margin] / Grand total
* Always ∑ (O) = ∑ (E).
X
2
= (O-E)
2
/E
* df=(r-1)(c-1)
⍺
=
0.05 and from X
2
-distribution table
we find p-value.
Ex: A group of 350 adults who participated in a health
survey were asked whether or not they were on diet, there
responses by sex were as in the table.
Regarding the above data is the association between sex
and being on diet is statistically significant (
⍺=
0.05)?
-From the table above (observed values), we calculate the
expected values using the formula: E= [Raw margin X
Column margin] / Grand total.
-we calculate the X
2
-value for each cell using the formula:
X
2
= (O-E)
2
/E.
- We calculate the total X
2
-value for the table (3.243),
- The df=(r-1)(c-1) ➨ (2-1)(2-1) = 1,
⍺=
0.05 and from
X
2
-distribution table we find p-value for df=1 and
⍺=
0.05
(3.841). Thus, 3.841>3.243➨The association is not
significant.
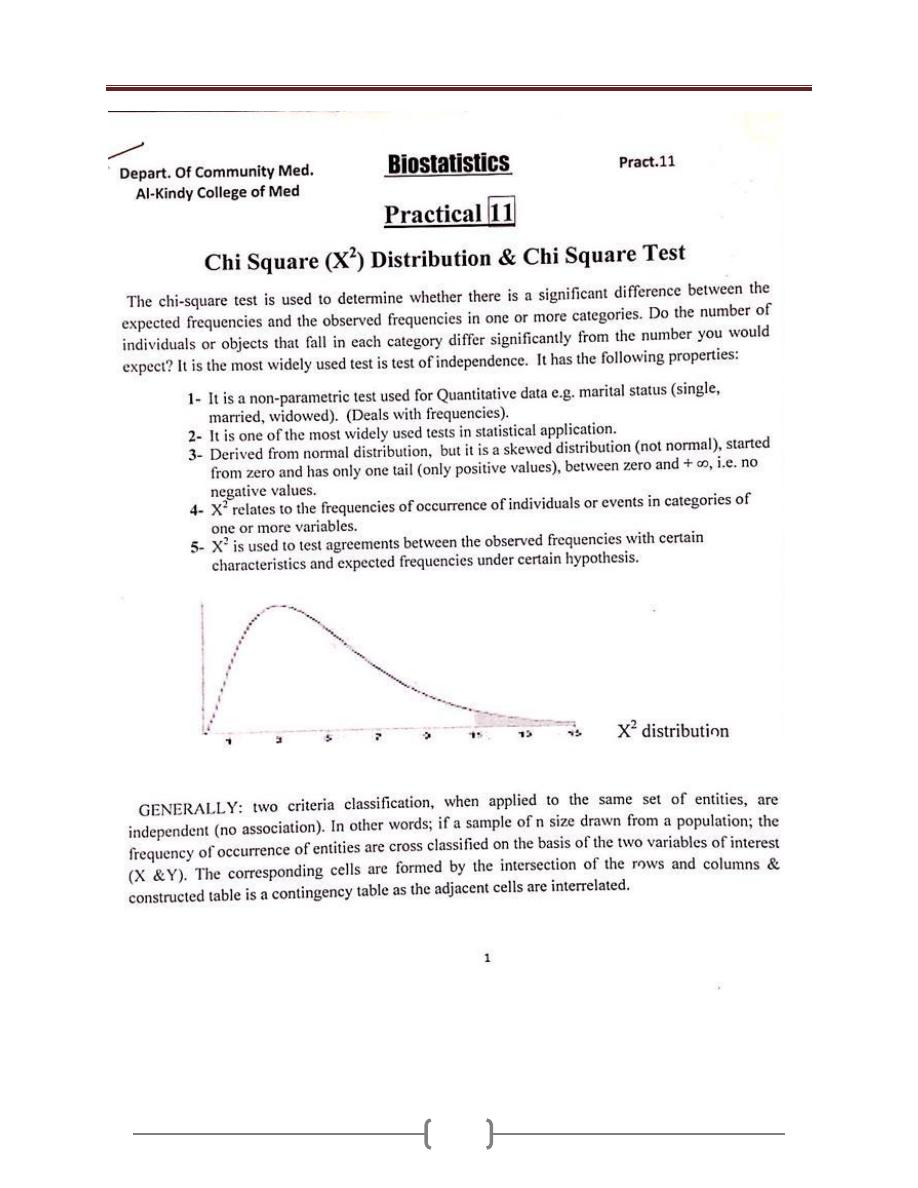
Lecture 11 - The Chi-Square distribution (X2-test)
88
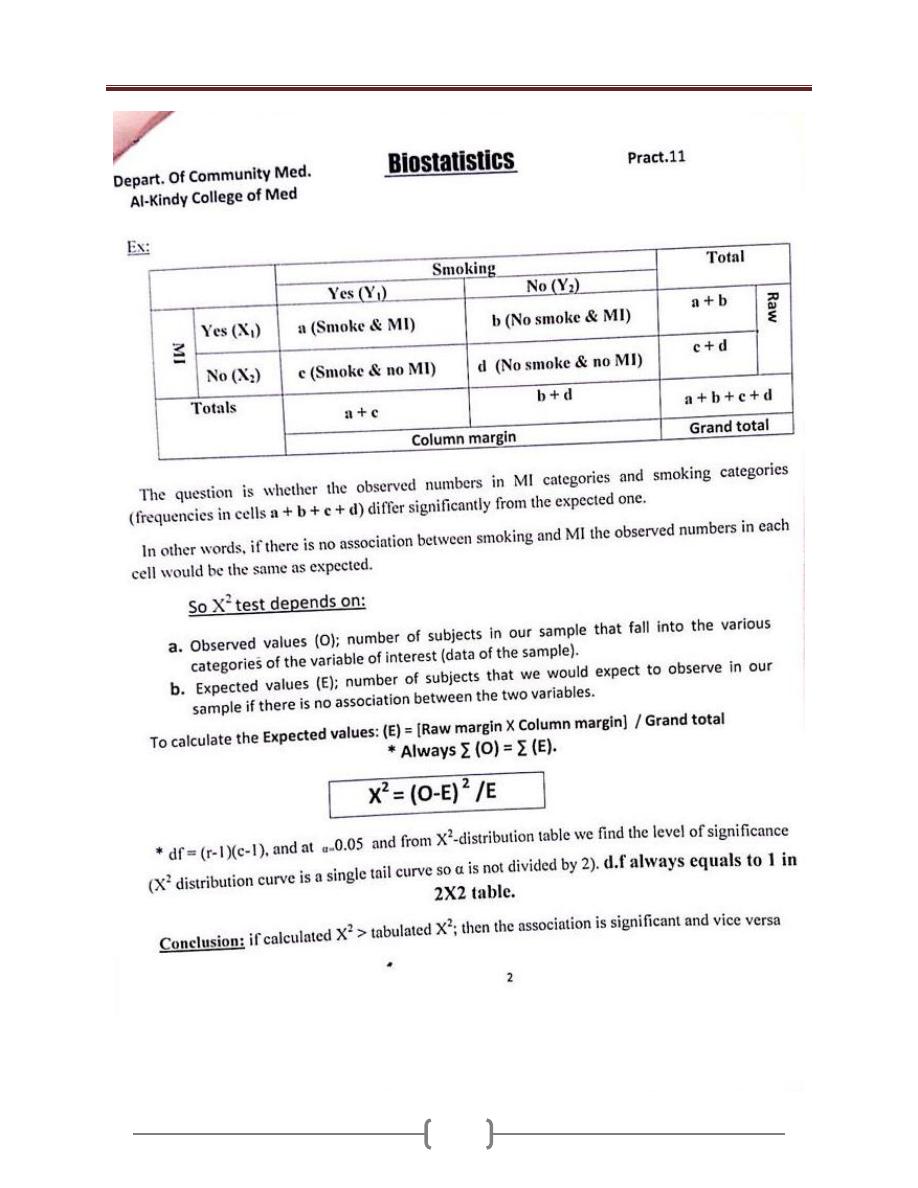
Lecture 11 - The Chi-Square distribution (X2-test)
89
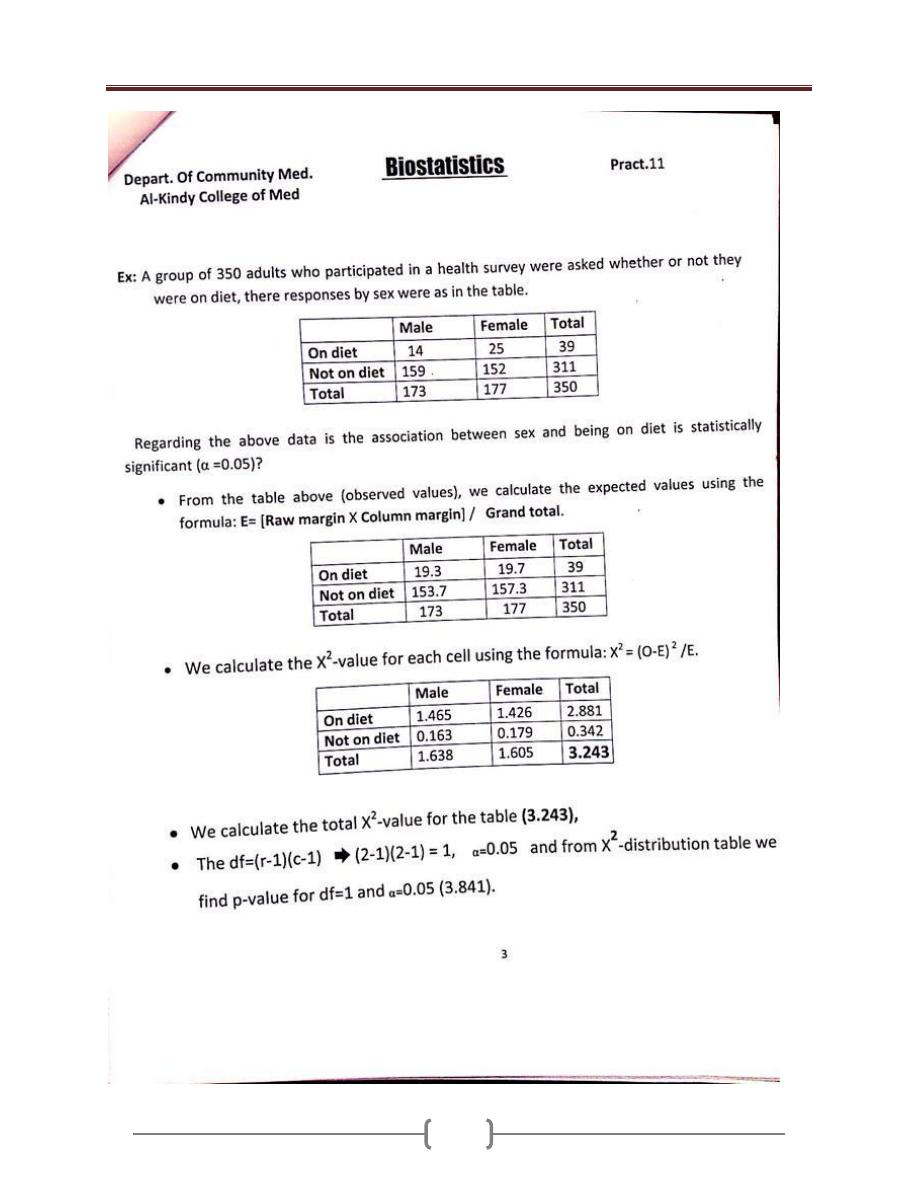
Lecture 11 - The Chi-Square distribution (X2-test)
90
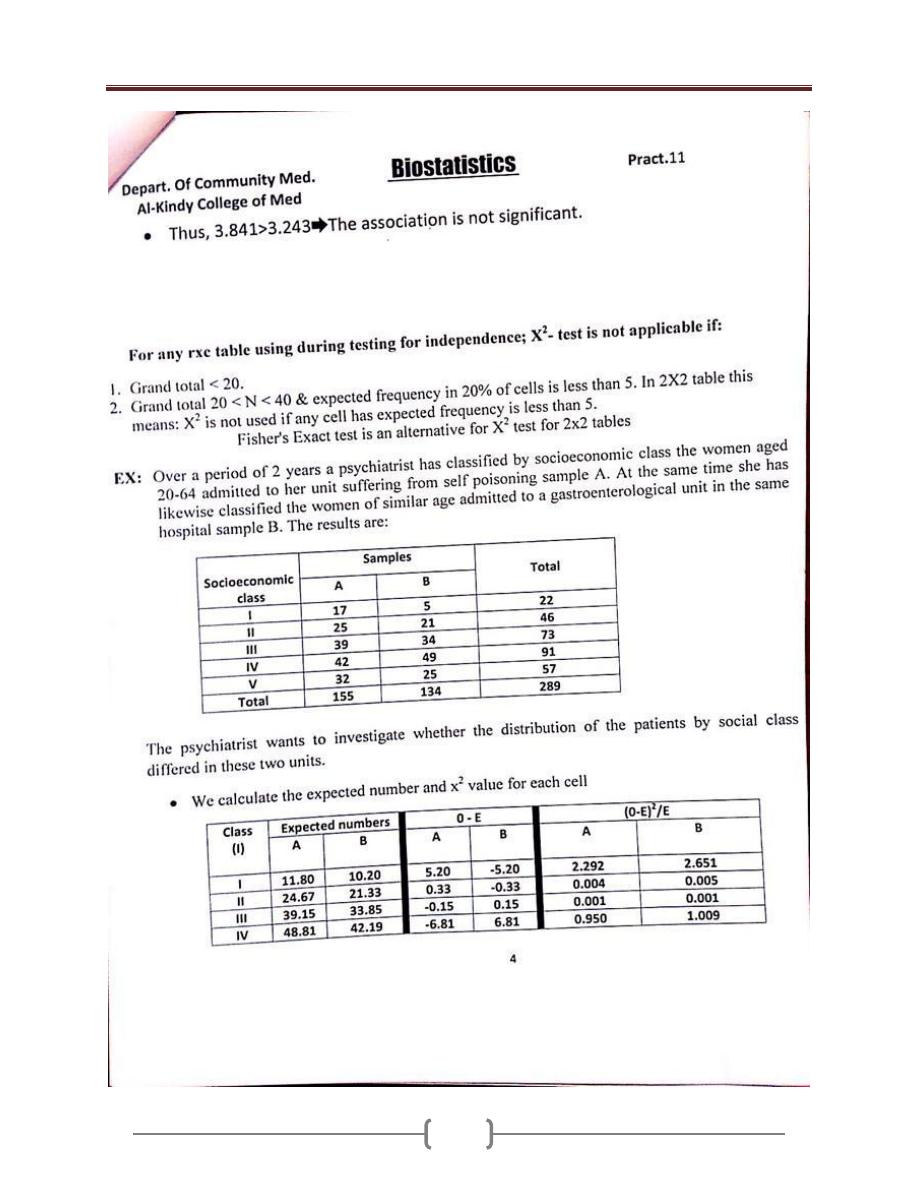
Lecture 11 - The Chi-Square distribution (X2-test)
91
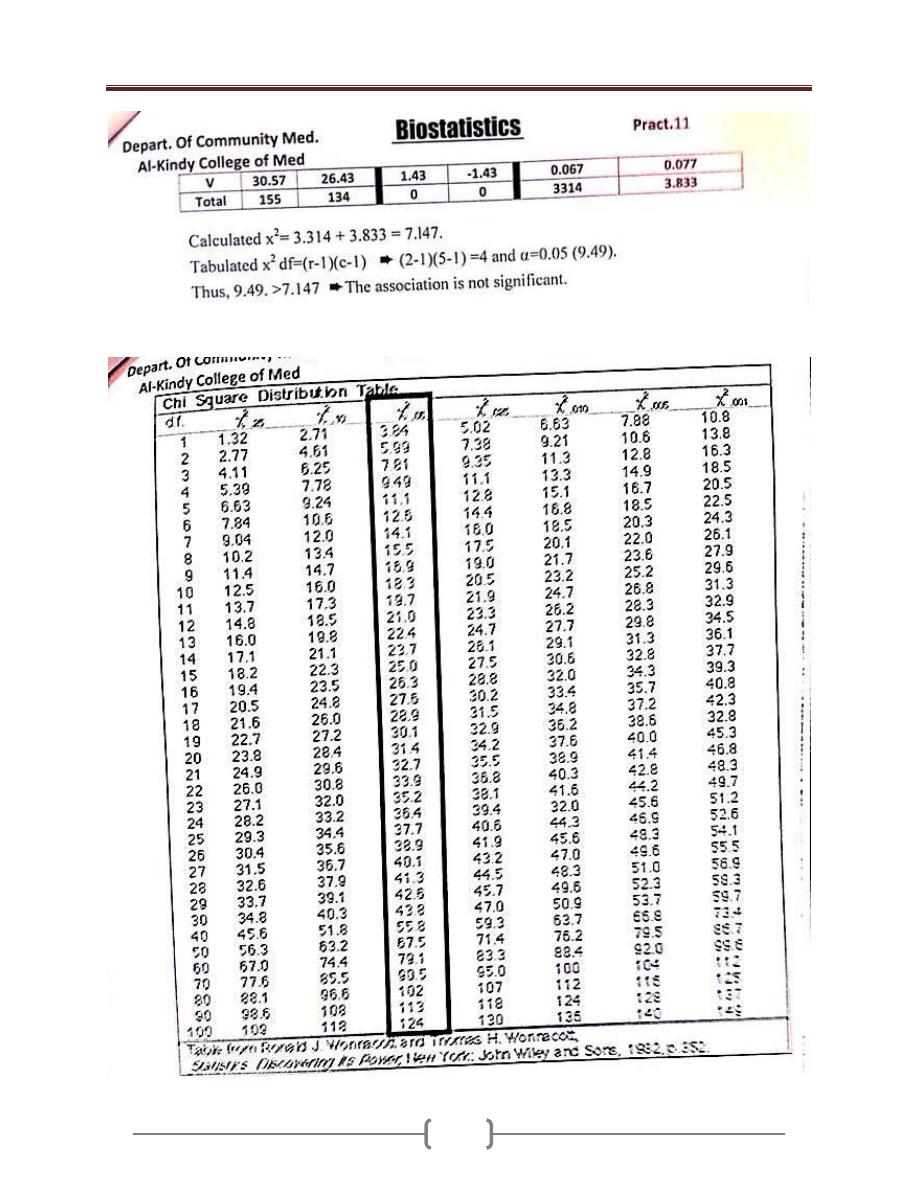
Lecture 11 - The Chi-Square distribution (X2-test)
92
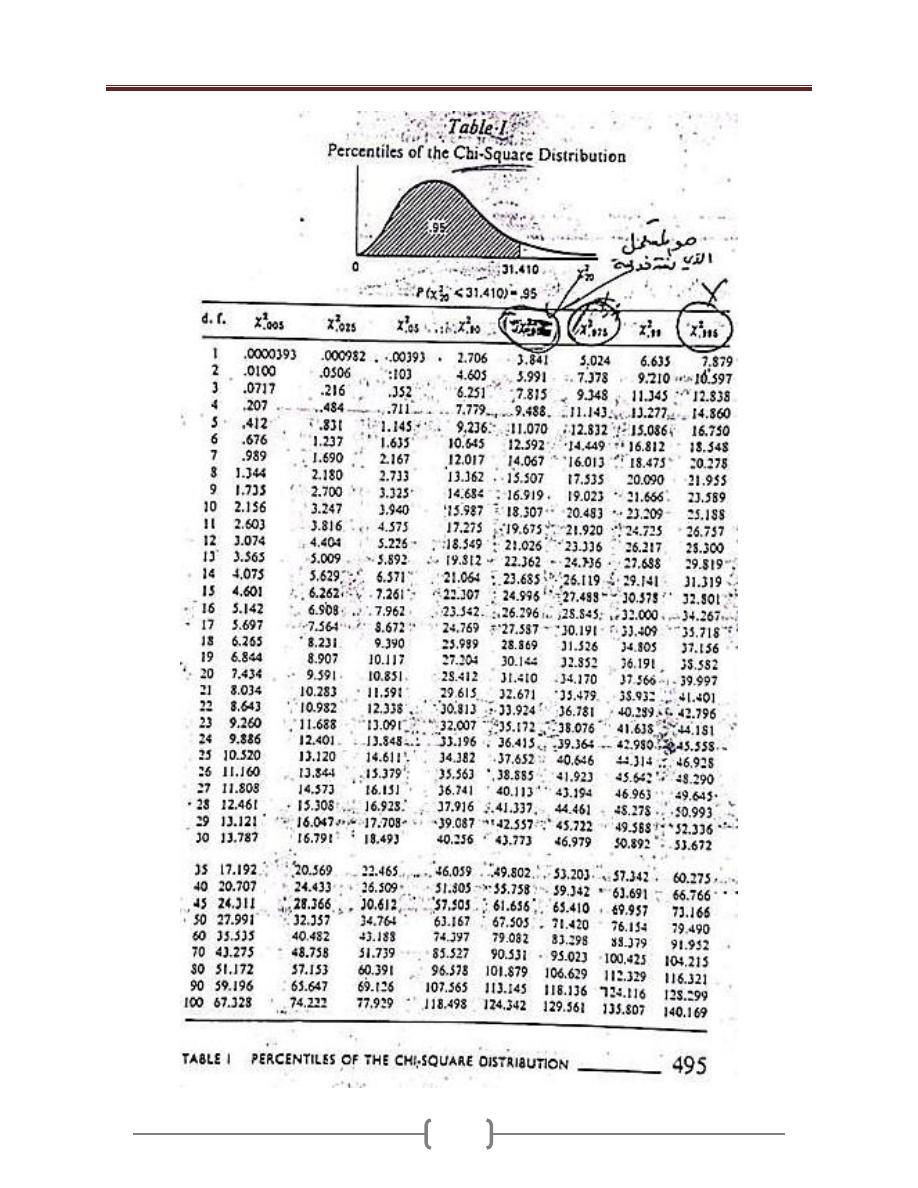
Lecture 11 - The Chi-Square distribution (X2-test)
93
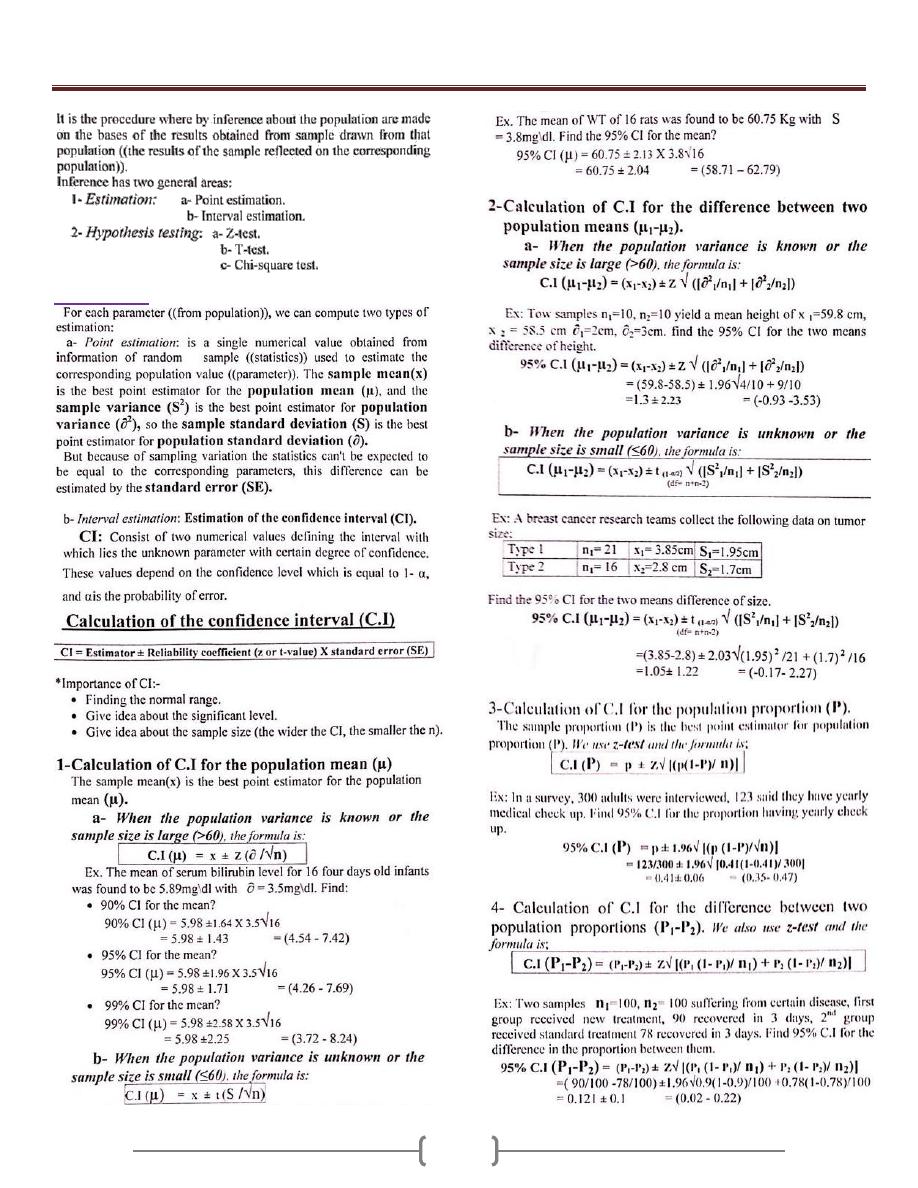
Lecture 12+13 - Inferential Statistics “Statistical Inference”
94
1- Estimation
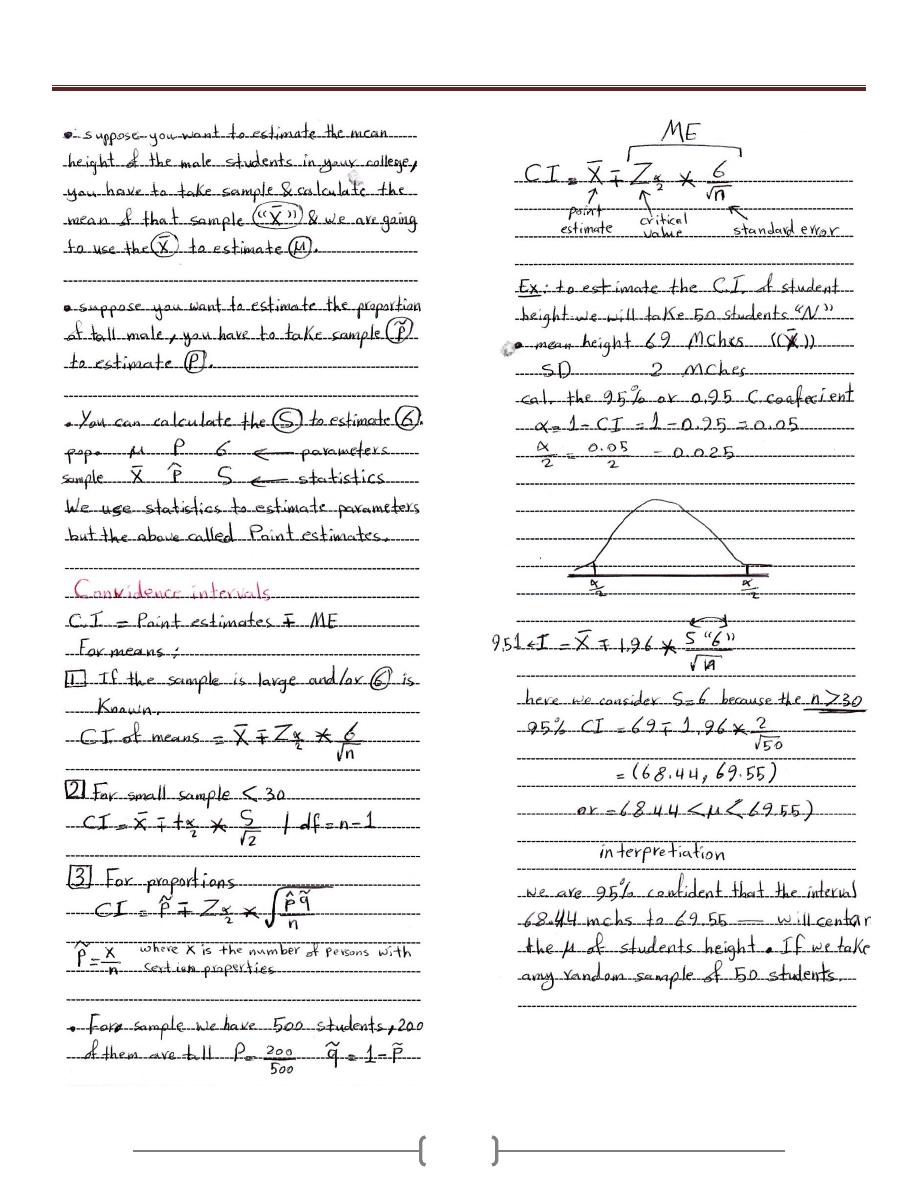
Lecture 12+13 - Inferential Statistics “Statistical Inference”
95
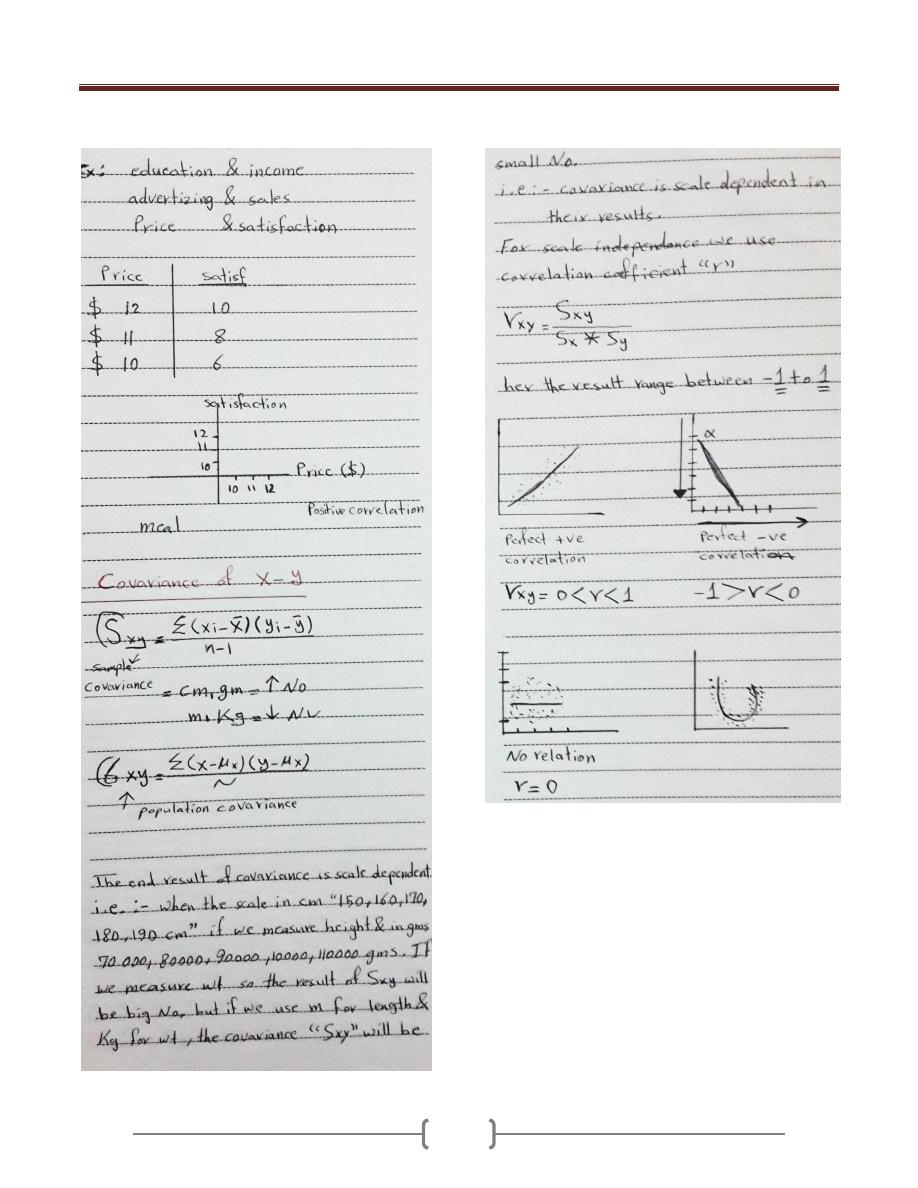
Lecture 14 - Covariance & Correlation “Relation between 2 variables”
96