Descriptive study design
Overview of epidemiologic design strategiesI. Observational
• Descriptive
• Populations{Correlational studies}
• Individual
• Case report
• Case series
• Cross sectional studies
• Analytic studies
• Case control
• Cohort
• Retrospective
• Prospective
• II. Interventional/Experimental
• Randomized controlled trial
• Field trial
• Clinical trial
Descriptive Studies
Relatively inexpensive and less time-consuming than analytic studies, they describe,
Patterns of disease occurrence, in terms of,
Who gets sick and/or who does notWhere rates are highest and lowest
Temporal patterns of disease
Data provided are useful for,
Public health administrators (for allocation of resources)Epidemiologists (first step in risk factor determination)
Case Report
Case SeriesCross sectional
One case of unusual
findings
Multiple cases of
findings
Population-based
cases with denominator
Case report/Case series
Report of a single individual or a group of individuals with the same diagnosis
Important interface between clinical medicine & epidemiology
Most common type of studies published in medical journals{1/3rd of all}
AIDS ~ b/w oct1980-may81, 5 cases of P.carinii pneumonia were diagnosed among previously healthy young homosexual males in L.A.Case Reports
Detailed presentation of a single case or handful of casesGenerally report a new or unique finding
e.g. previous undescribed disease
e.g. unexpected link between diseases
e.g. unexpected new therapeutic effect
e.g. adverse events
Case Series
Experience of a group of patients with a similar diagnosisAssesses prevalent disease
Cases may be identified from a single or multiple sources
Generally report on new/unique condition
May be only realistic design for rare disorders
Case Series
Advantages
Useful for hypothesis generation We can aggregate cases from disparate sources to generate hypotheses and describe new syndromes Example: hepatitis, AIDS
Informative for very rare disease with few established risk factors
Disadvantages
Cannot study cause and effect relationships because there is no relevant comparison groupCannot assess disease frequency
Cross sectional studya cross-sectional study (also known as prevalence study) is a type of observational study that involves the analysis of data collected from a population, at one specific point in time.
Cross-sectional studies are most familiar to us as surveys
Cross-sectional studies
An “observational” design that surveys exposures and disease status at a single point in time (simultaneously) in a defined population)time
Study only exists at this point in timeFeatures of C-S Studies
It a “snapshot” or “still life portrait”.
e.g. - cholesterol measurement and ECG measured at same time
Determines prevalence at a point in time
It can be used to measure any factor that can be reported by respondents or assayed noninvasively and that does not require follow-up to assess. Cross-sectional studies are the source of most of what we know about the population other than vital statistics.

A type of cross-sectional study, not usually described as such, is a population census, where an entire population is enumerated. A census provides denominator data for many purposes, such as estimation of birth and mortality rates, assessing the generalizability of studies conducted in subpopulations, and projecting the results from smaller studies. Population censuses involve a huge effort. People can be difficult to find and to count, and may not want to provide data.
Cross-Sectional Studies
AdvantageRelatively cheap, easy and quick.
It assesses the prevalence of several diseases / exposures in the population
It provides clues for further research into the etiology of diseases (identifying associations)
Can be useful for comparison of different groups of people with certain disease among countries or different geographical areas
Provide data for health planning and priority setting of health problems
Disadvantages
• Cannot establish temporal relationship between exposure and disease• Not suitable to study rare disease or disease with short duration
• It considers prevalent rather than incident cases, results will be influenced by survival factors
Ecologic Studies
An observational study in which at least one variable is measured at the group level.
It is appropriate for initial investigation of causal hypothesis.
Measurements made at population rather than individual level
.
Ecological (correlation) study
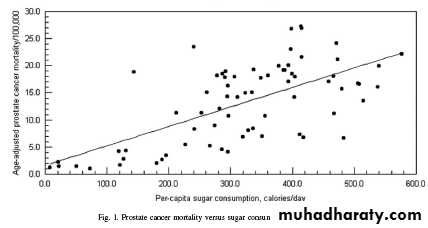
The x-axis indicates per capita sugar calories consumed per day.
The y-axis represent the age-adjusted mortality rate for prostate cancer.Each dot represents a country, plotting the per-capita sugar consumption and the age-adjusted prostate cancer mortality rate for that particular country.
Per-capita sugar consumption is an ecological variable because it is the average measure of exposure to sugar for all the people in the country. It does not mean that every person in the country ate exactly the same amount of sugar.
Similarly, the mortality rate is a group-level variable because it represents the country's experience, not any individual person's experience in the country.
Do the data support the hypothesis that increased sugar consumption is associated with increased prostate cancer mortality? - YES! Do the data determine that sugar consumption causes prostate cancer death? NO!
Correlational Studies (Ecological Studies)
ADVANTAGES
Weaker inference, but easier to gather data
We can generate hypotheses for case-control studies and environmental studies
We can target high-risk populations, time-periods, or geographic regions for future studies
Correlational Studies
LIMITATIONSBecause data are for groups, we cannot link disease and exposure in individual
We cannot control for potential confounders
Data represent average exposures rather than individual exposures, so we cannot determine a dose-response relationshipCaution must be taken to avoid drawing inappropriate conclusions, or ecological fallacy
Ecological fallacy“The bias that may occur because an association observed between variables on aggregate levels does no necessarily represent the association that exists at the individual level.”