
Preparation of Standard Curves
Principle
Many laboratory tests require the measurement of concentration be
evaluated or read in a photometer (colorimeter or spectrophotometer).
Since these instruments are capable of only measuring the amount of light
being allowed to pass through the cuvette, their readout devices display %
of light transmitted or mathematically derived absorbance.
One method of obtaining concentration from % transmittance or
absorbance is through the use of a standard curve. For our purposes,
standard curves are defined as a graphs with absorption or %T plotted on
the Y axis, and increasing concentrations of standard along the X axis.
If Beer’s Law is followed, the resulting line representing absorbance vs
concentration will be straight. A standard curve is constructed after
obtaining the %T/Abs readings from a number of solutions of known
concentration (standards) used in a reaction or procedure. After the
readings are obtained each is plotted on semi-log (% transmittance) or
linear (absorbance) paper against the corresponding concentration.
If the procedure follows Beer's Law, the points plotted will generally
lie such that a straight line can be drawn through them. The concentration
of controls and other unknowns (patient samples) can be determined by
locating their %T/Abs reading on the line, then dropping an imaginary
line down from that point to intersect the concentration axis.
Once the curve is drawn, a number of things must be considered to
determine its acceptability. The majority of the curve’s points should be
on or close to the line. There could be many reasons for a point not being
on the line. If the standards are formed from a series of dilutions, the
accuracy of the dilutions must be suspect. Calculations of the dilutions
and spectrophotometer errores are other possibilities. Whether or not the
curve passes through the point of origin (the “0"), varies with the
procedure. If Beer’s law is followed and the procedure is linear at the
lower concentrations, the curve’s line generally goes through the zero.
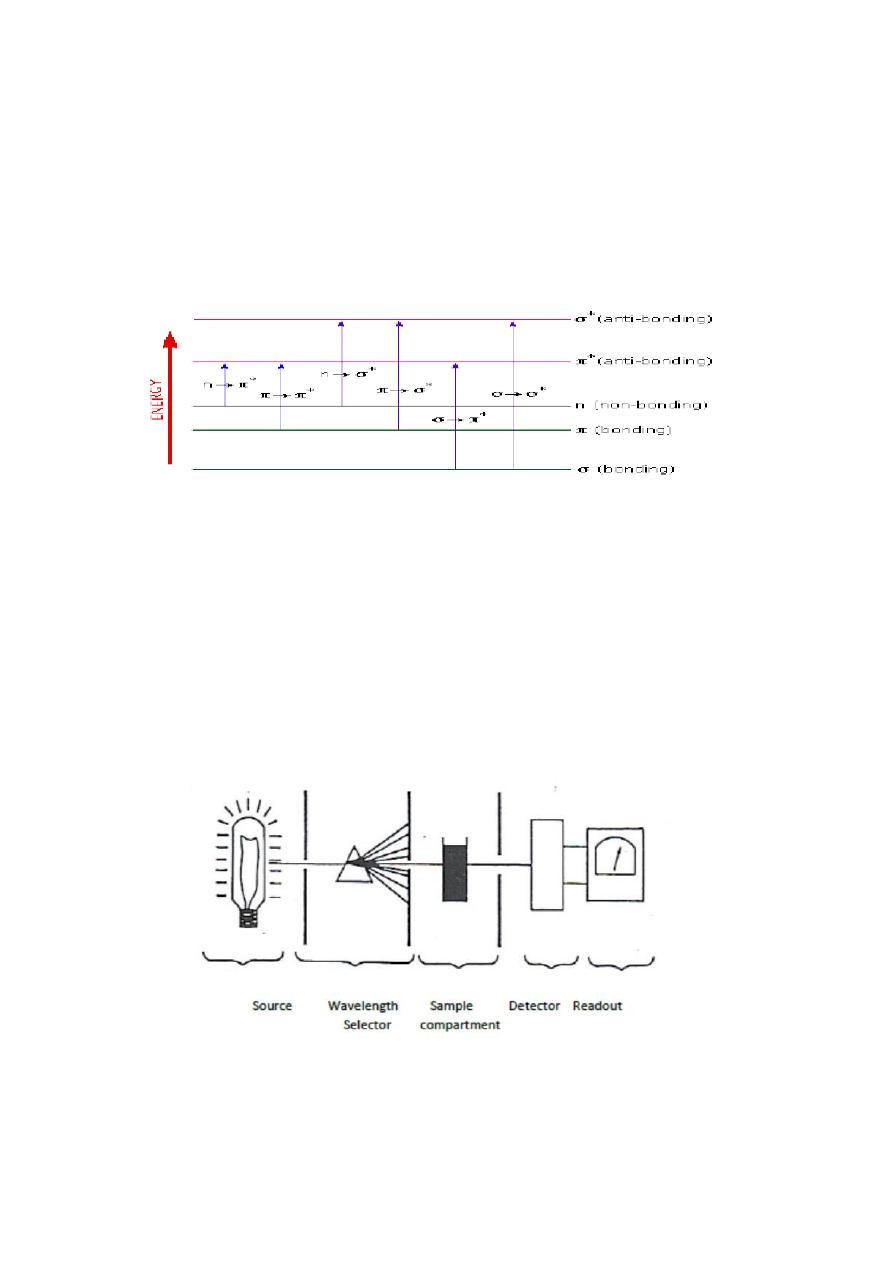
Uv/ Vis. Spectrophotometry
when a beam of radiation passes through matter, apportion is
frequently absorbed; this process involves a transfer of radiant energy to
the system, thus electrons of atoms or molecules are excited to higher
energy levels.
The quantity of the absorbed radiation by a certain species is a function
of its concentration. The relationship between energy absorption
(Absorbance: A) and the concentration (C) of the absorbing species is
given by:
A= ε c l (ε = molar absorbtivity l = path length )
Components of a Spectrophotometer
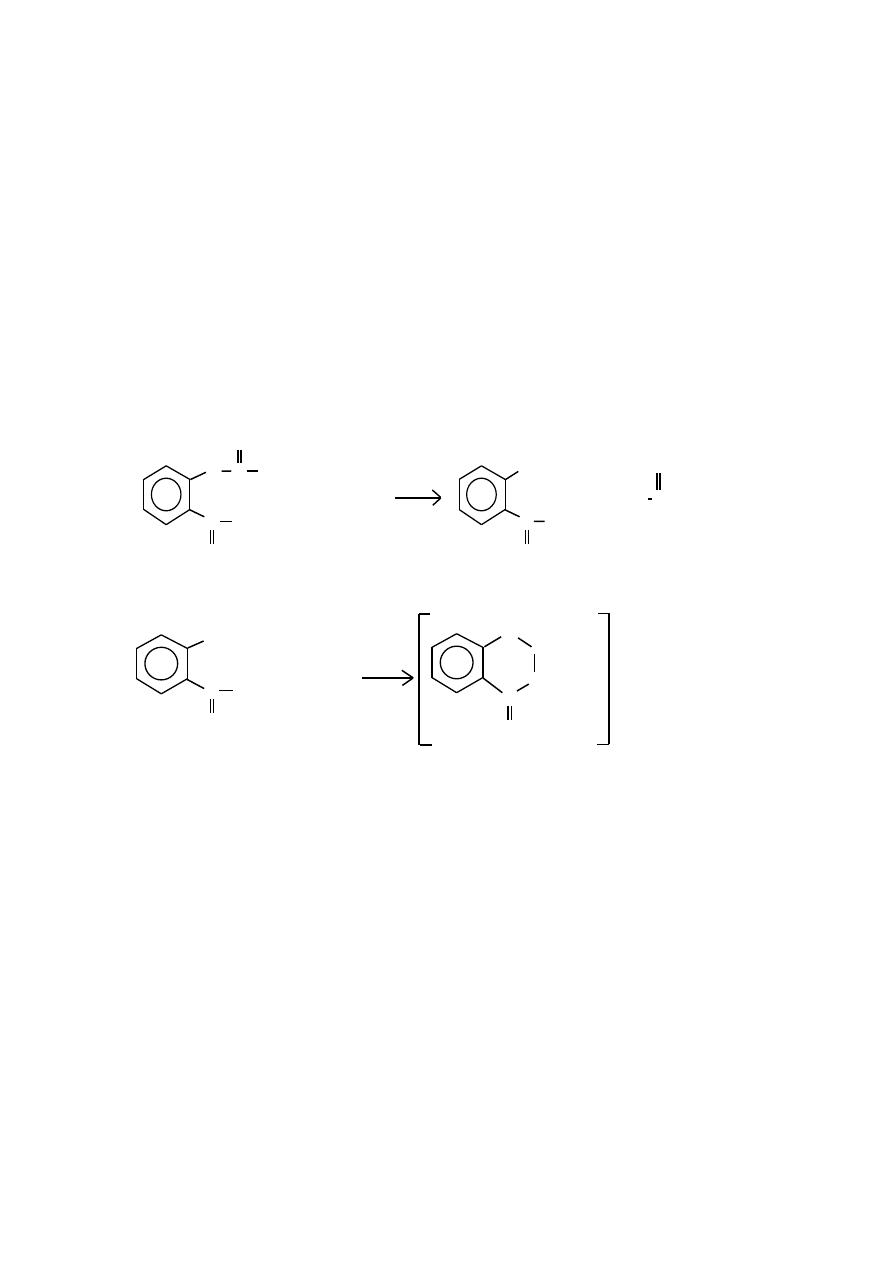
SPECTROPHOTOMETRIC ANALYSIS OF ASPIRIN
The chemical name for aspirin is acetylsalicylic acid. It is an ester
derivative of salicylic acid
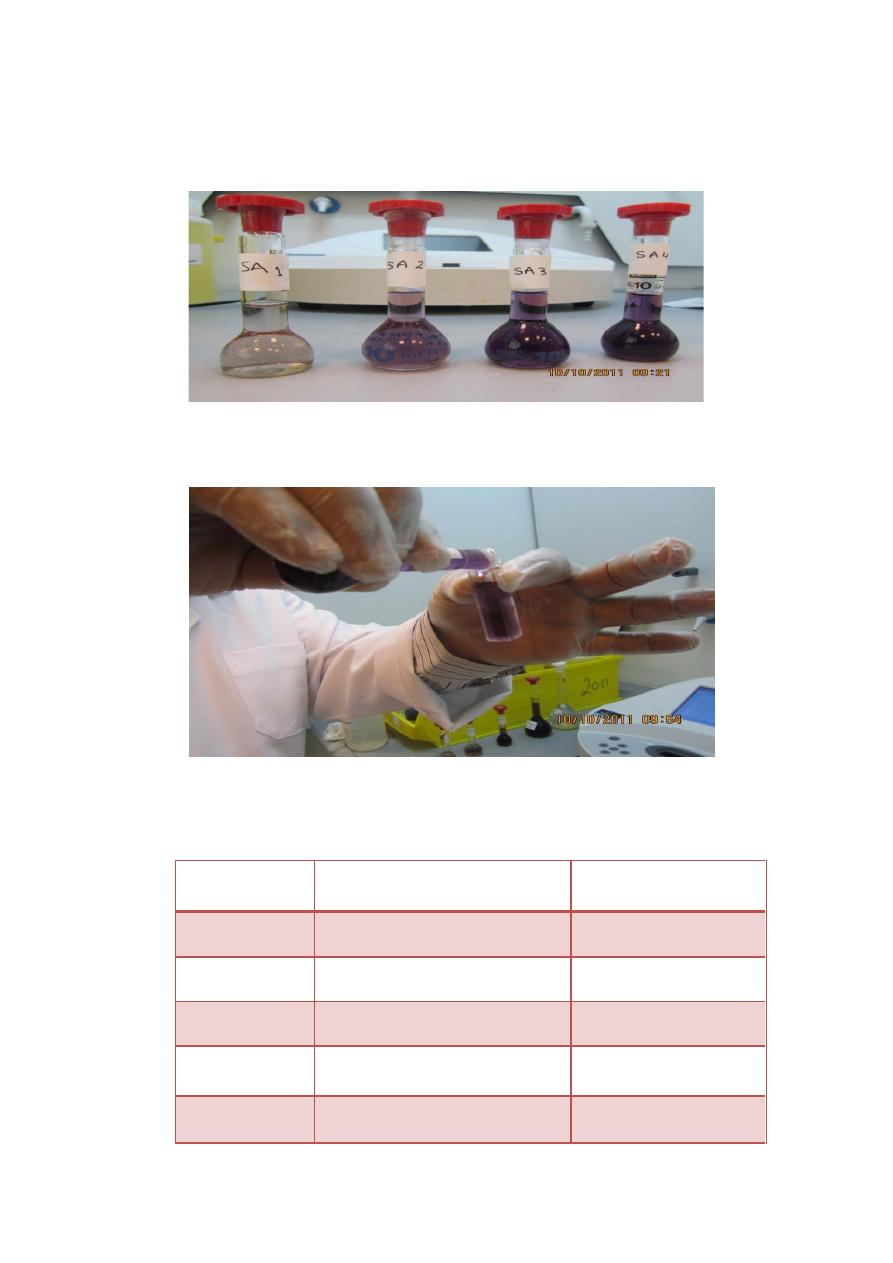
A colored complex is formed between aspirin and the iron (III) ion.
The intensity of the color is directly related to the concentration of aspirin
present; therefore, spectrophotometric analysis can be used. A series of
solutions with different aspirin concentrations will be prepared and
complexed. The absorbance of each solution will be measured and a
calibration curve will be constructed. Using the standard curve, the
amount of aspirin in a commercial aspirin product can be determined
O C CH
O
C
O
OH
3
(aq) + CH C O (aq) + 2H O(l)
O
C
O
O
-
-
(s) + 3OH (aq)
-
O
-
3
2
O
C
O
O
-
- + [Fe(H O) ]
2
6
+3
O
C
O
O
+
2
4
Fe(H O)
2
3
+
+ H O + H O
First the acetylsalicylic acid is reacted with sodium hydroxide to form the
salicylate dianion. Then the addition of acidified iron(III) ion produces
the violet tetraaquosalicylatroiron (III) complex.
Procedure
Part I / STANDARD CURVE
1- Mass 100 mg of acetylsalicylic acid in a 125 mL Erlenmeyer flask.
Add 10 mL of a 1 M NaOH solution to the flask and heat to
boiling.
2- Quantitatively transfer the solution to a 250 mL volumetric flask
and dilute with distilled water to the mark.
3- transfer 1,2,3,4 and 5 ml of standard aspirin solution to a (10for
group A and 15ml for group B) mL volumetric flask or graduated
cylinder. Dilute to the 10 mL mark with buffered 0.02 M iron(III)
chloride solution.
4- Measure the absorbance of each solution starting with lower
concentration first with a spectrophotometer set at 530 nm. Use the
iron (III) solution as a blank. Record the results on the data sheet.
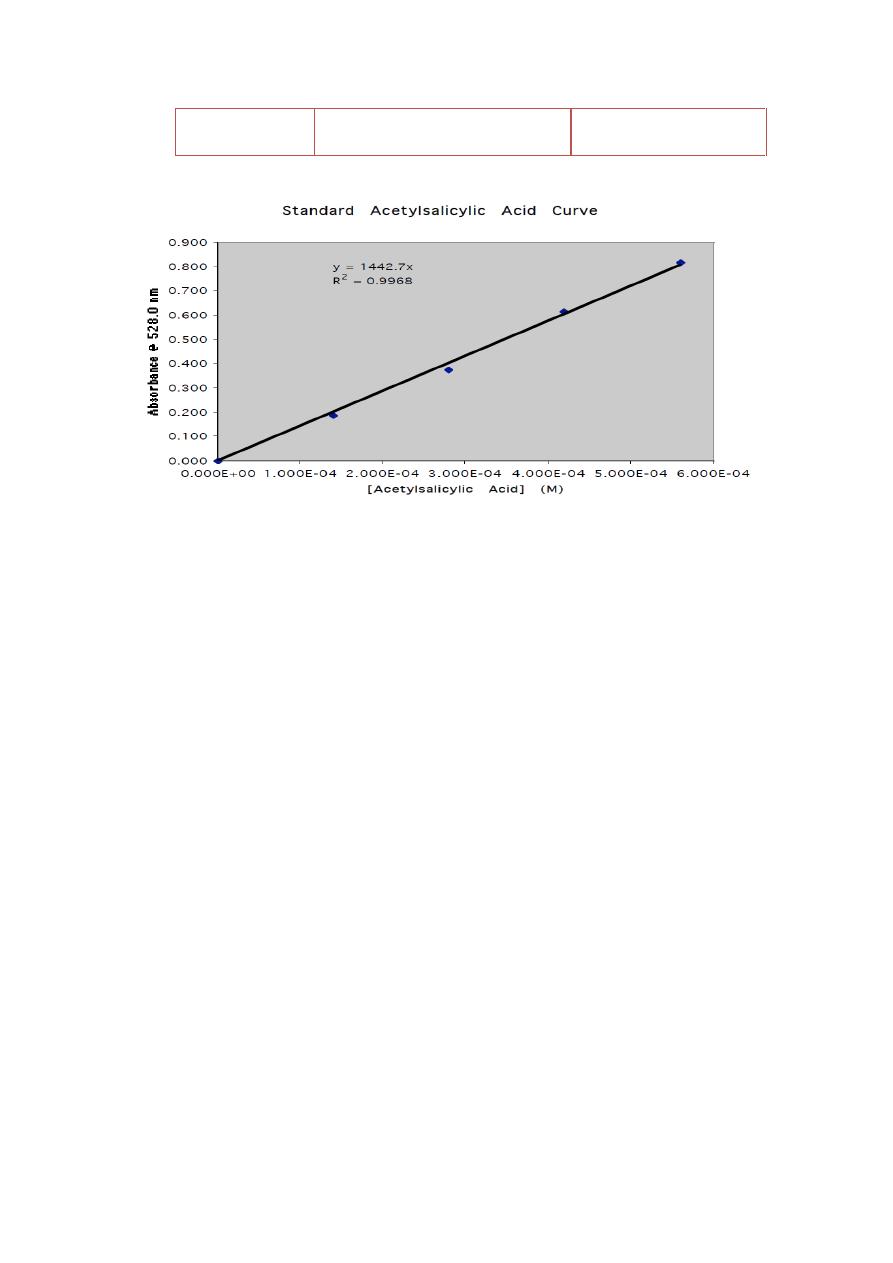
5- Draw the standard curve using excel program on your computer or
ordinary sheet
Stock
solution ml
Concentration
(mg/ml) after dilution
Absorbance
0
0
0
1
2
3
4
5
Part II: Making a Solution of Unknown Concentration from a Tablet.
1. Place one aspirin tablet (record the brand and mg of ASA as indicated
on the bottle) in a 125 mL flask. Add 10 mL of 1 M NaOH solution to
the flask, and heat until the contents begin to boil and the entire tablet has
dissolved.
2. Quantitatively transfer the solution to a 250 mL volumetric flask, and
dilute with distilled water to the mark.
3. Pipet a 1.00 mL sample of this aspirin tablet solution to a 10 mL
volumetric flask. Dilute to the mark with a 0.02 M Fe3+ solution. Label
this solution "unknown,"
Note : 7g FeCl3 in 2 L H2O
H.W.
1-Explain why the wavelength of 530 nm was used.
2.How did the concentration of your aspirin solution compare to the
accepted value?
3. Is it better to buy generic or brand name aspirin? Support your
conclusion.
