Dr Hadi Al-Sagur
1

1. Introduction
•The audible sound :range is usually defined as 20 Hz to 20.000 Hz (20 kHz).
Older people often lose the ability to hear the frequencies above 10 kHz.
• Infrasound :refers to sound frequencies below the normal hearing range, or
less than 20 Hz.
It produced by natural phenomena like earthquake waves and atmospheric
pressure changes.
• Ultrasound :sound with the frequency range above 20 kHz. It is used
clinically in number of specialties.
it is often gives more information than an X-ray , and it is
less hazardous
for the fetus
.
CH 12 Sound
2

2. General properties of sound
• A sound wave is mechanical disturbance in a gas, liquid, or solid.
• It is caused by a vibrating body or a diaphragm.
• The vibrations cause local increases and decreases in pressure relative
(compressions & rarefactions)
• The relationship between the frequency of vibration of the sound wave
v= λf
• Energy is carried by the wave as potential and kinetic energy.
The intensity (I)
of sound wave is the energy passing through 1 m
2
/sec.
• A special unit, the bel has been developed for comparing the intensities of two
Sound waves (I2 /I1) (1 bel = 10 dB ) decibel.
CH 12 Sound
3
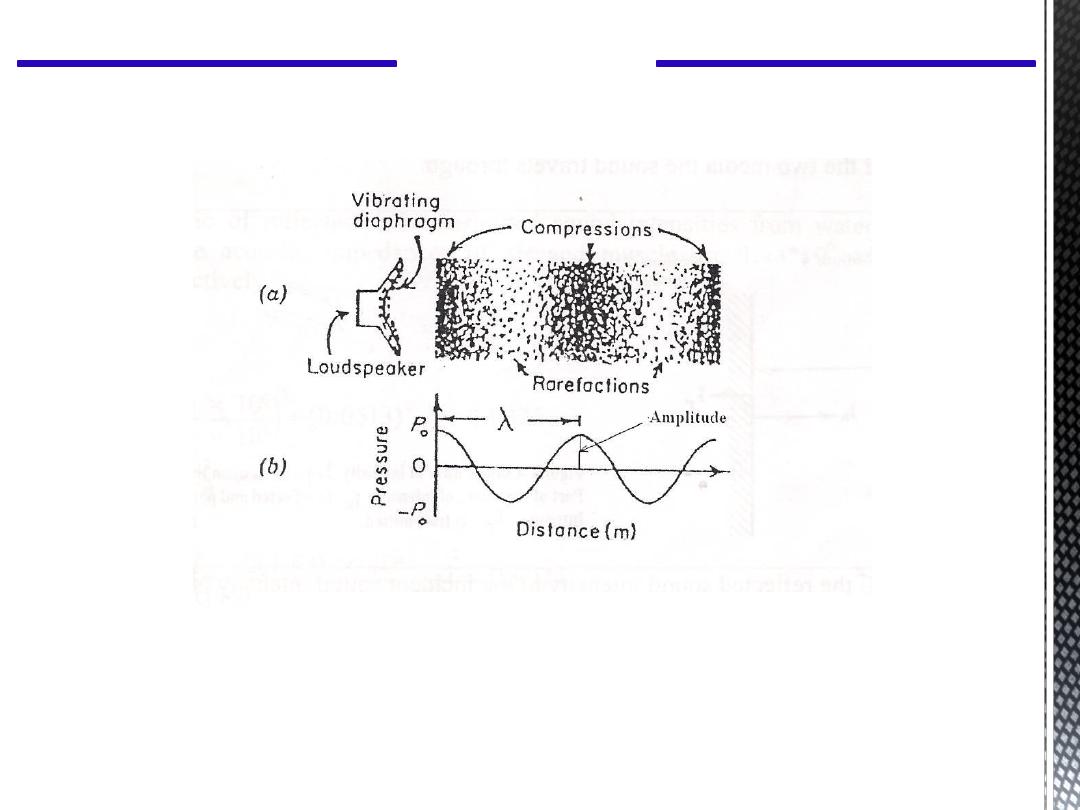
The Schematic is representation of a sound wave from a loudspeaker.
(a): a diaphragm vibrates at a frequency f and produces compressions and
rarefactions in air.
(b): the pressure relative to atmospheric pressure versus distance.
CH 12 Sound
4

The intensity (I) of sound wave is the energy passing through 1 m
2
/sec
, or
Watts per square meter. For a plane wave; I is given by :
Z
P
I
2
2
0
Where Po : is the maximum change in pressure
Z : is the acoustic impedance of the medium which is given in
3
m
kg
Z
Where ρ: is the density of the medium
v: is the velocity of sound in the medium (m/sec)
CH 12 Sound
3. Sound intensity and acoustic impedance
5

Z
P
I
2
2
0
2
1
2ZI
P
o
Example: the
sound intensity
that ear can tolerate at 1000 Hz is approximately
1 W/m
2
and the faintest
sound intensity
that ear can hear at this frequency is
approximately
10
-12
W/m
2
. If you know that the acoustic impedance
for air is 430 kg/m
2
.sec then calculates the sound pressure at these two intensities.
P
oa
= (2x430x1)
1/2
=29N/m
2
P
ob
= (2x430x10
-12
)
1/2
=2.9x10
-5
N/m
2
CH 12 Sound
6
4. Reflection and transmission of sound wave
First // When the wave was perpendicular to the surface
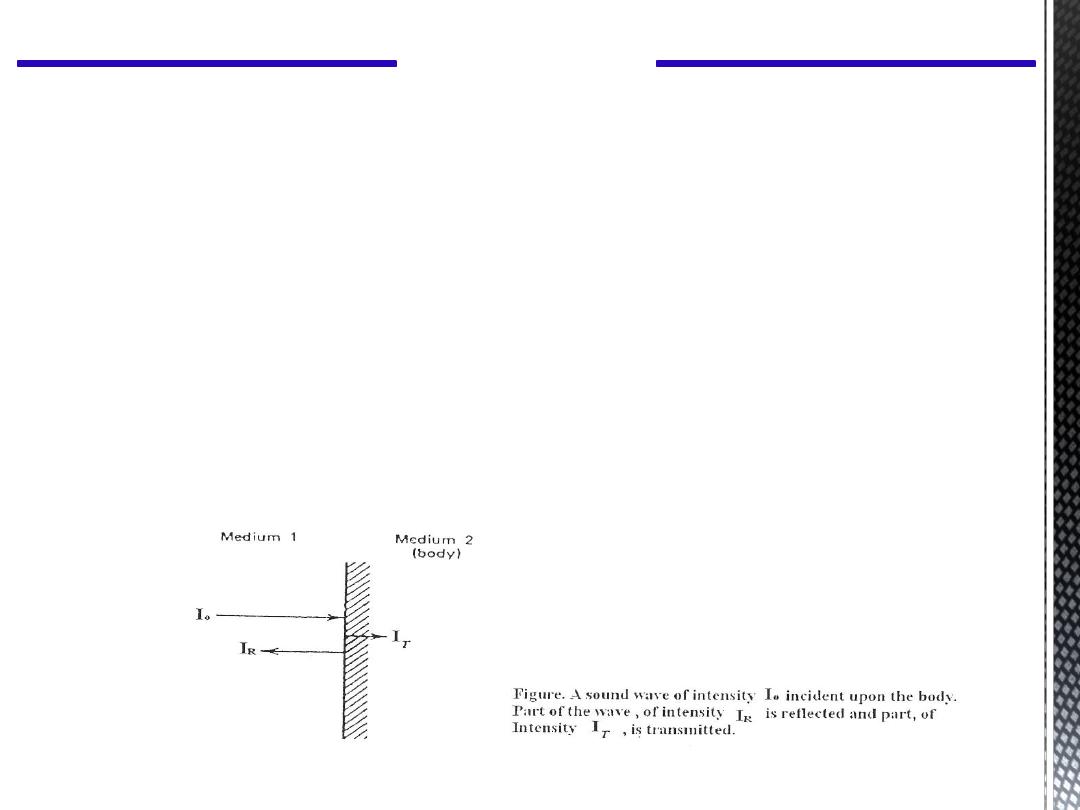
When a sound wave hits the body, part of the wave is reflected and part is
transmitted into the body.
The percentage of the reflected part and the transmitted part depend on the
acoustic impedance of the two media the sound travels through.
CH 12 Sound
7

The ratio of the reflected sound intensity to the incident sound intensity is given
by:
2
1
2
1
2
0
Z
Z
Z
Z
I
I
R
While the ratio of the transmitted intensity to the incident sound intensity is
calculated from :
2
1
2
2
2
1
0
2
Z
Z
Z
Z
Z
I
I
T
Whenever acoustic impedances differ greatly there is almost complete reflection
of the sound intensity. This is true regardless of which medium the sound originates in
and is the reason heart sounds are poorly transmitted into the air adjacent to the chest.
When the acoustic impedances of the two media are similar, almost all of the sound is
transmitted into the second medium. Choosing materials with similar acoustic impedance
Is called impedance matching. Getting sound energy into the body requires impedance
matching.
CH 12 Sound
8

CH 12 Sound
2
1
2
1
2
0
Z
Z
Z
Z
I
I
R
9990
.
0
9995
.
0
430
10
64
.
1
430
10
64
.
1
2
2
6
6
2
1
2
2
2
1
0
2
Z
Z
Z
Z
Z
I
I
T
0010
.
0
430
10
64
.
1
10
64
.
1
2
10
64
.
1
430
2
6
6
6
Example:
Calculate the ratio of reflected and transmitted sound intensities from air to muscle,
knowing that the acoustic impedances of air and muscle are 430 and 1.64x10
6
kg/m
2
.sec respectively.
9

CH 12 Sound
2
1
2
1
2
0
Z
Z
Z
Z
I
I
R
0026
.
0
0513
.
0
10
48
.
1
64
.
1
10
48
.
1
64
.
1
2
2
6
6
2
1
2
2
2
1
0
2
Z
Z
Z
Z
Z
I
I
T
9974
.
0
10
48
.
1
64
.
1
10
64
.
1
2
10
64
.
1
10
48
.
1
2
6
6
6
6
Example:
Calculate the ratio of reflected and transmitted sound intensities from water to
muscle are 1.48x10
6
and 1.64x10
6
kg/m
2
.sec respectively.
10
The previous discussion of reflection of sound waves assumed that the wave was
perpendicular to the surface.
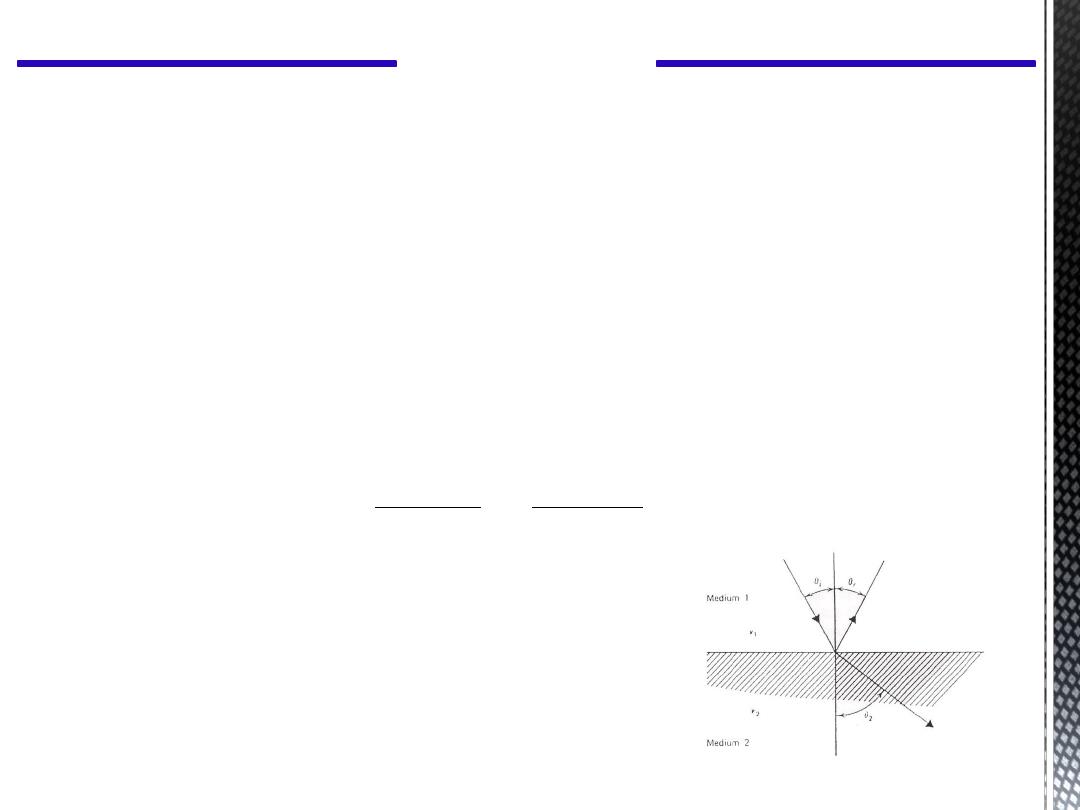
Second // When the wave was not perpendicular to the surface
► The geometric laws involving the reflection and refraction (bending) of sound waves
when hits at an angle θi to boundary between two media are:
1. θ incident = θ reflected (θi = θr)
2. The angle of the refracted sound wave θ
2
is determined by the velocities of the
sound in the two media v
1
and v
2
from the equation:
2
2
1
1
v
Sin
v
Sin
Figure explains the behavior of a sound wave at an interface
between two substances where reflection and refraction
(bending) take place. The velocity of sound in medium 2 (
v
2
) is
greater than that in medium
1
(
v
1
).
CH 12 Sound
11

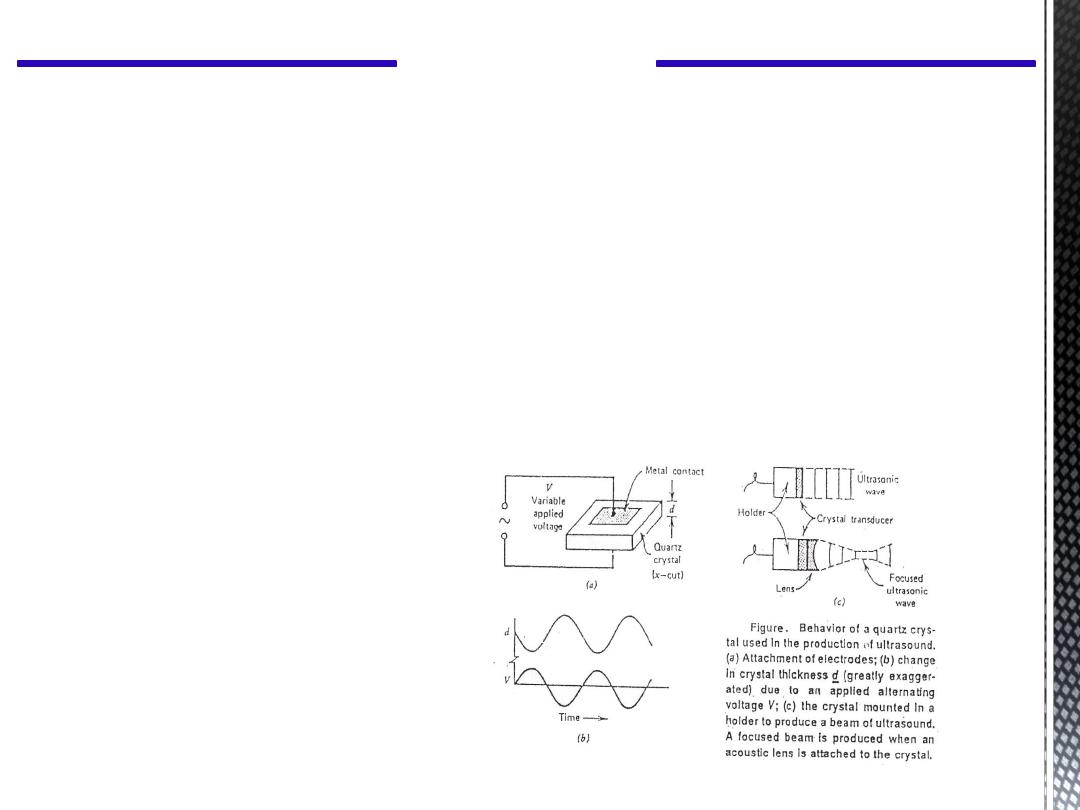
► Because sound can be refracted, acoustic lenses can be constructed to focus sound waves
► When a sound wave passes through tissue, there is some loss of energy due to frictional
effects which causes a reduction in the amplitude of the sound wave. But the intensity
decreases more rapidly than the amplitude due to this effect.
► The absorption increases as the density increases. Thus the bone absorbs much more than
other tissues. The absorption also increases as the frequency of sound wave increases.
► Spreading out or divergence of sound causes sound intensity to decrease. The intensity is
decreased according to the inverse square law.
Where : r is the distance from the source to the measuring point.
2
1
r
I
CH 12 Sound
12
CH 12 Sound
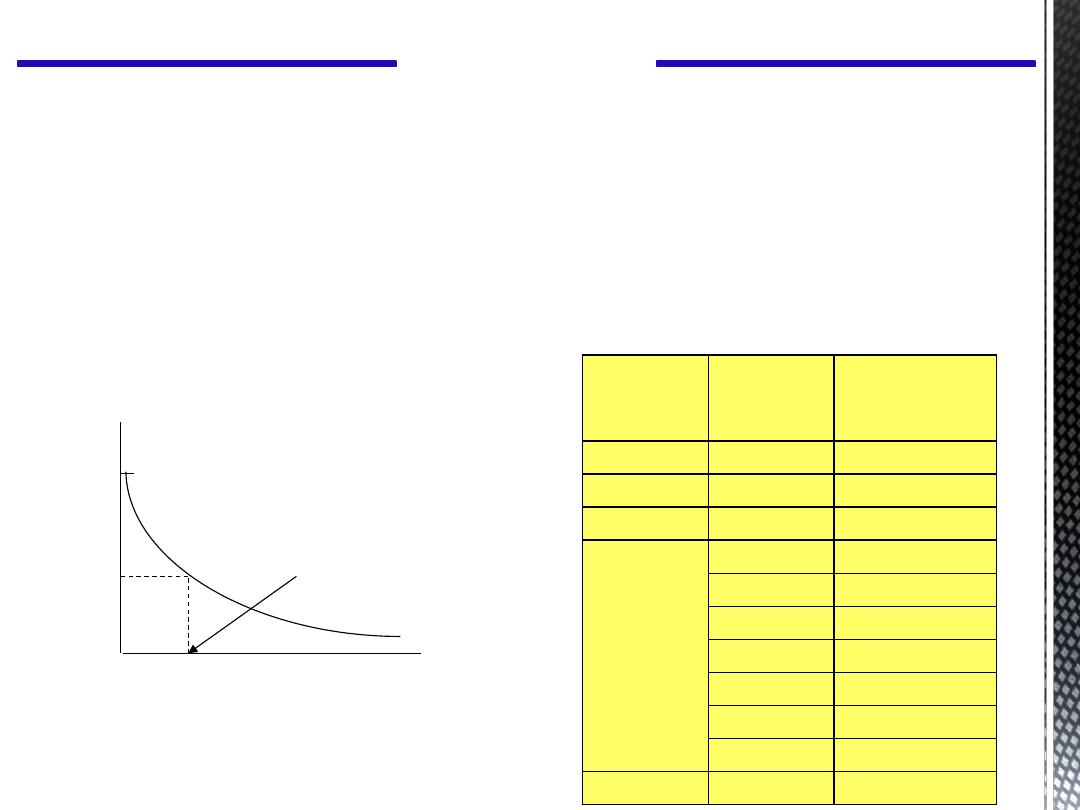
►The half – value thickness (HVT) is the tissue thickness needed to
decrease I
o
to I
o/2
or original sound intensity to half its value.
►From table you note the high absorption in the human skull and that the
absorption increases as the frequency of the sound increases.
►This increasing absorption with frequency also occurs for other body
tissues and limits the maximum frequencies that can be used clinically.
Where the half – value thickness is the path length through tissue that
reduces the beam to 50% of its original intensity I
o
.
Half-Value
Thickness
(cm)
Frequency
(MHz)
Material
2.7
1
Muscle
6.9
0.8
Fat
3.2
1
Brain (ave)
0.95
0.6
Bone (human
skull)
0.34
0.8
0.21
1.2
0.11
1.6
0.08
1.8
0.06
2.25
0.045
3.5
1.4 x10
3
1
Water
Half – value
thickness
Distance
I
o
Sound
intensity
Figure : where explain the half – value thickness is the
path length through tissue that reduces the beam to 50%
of its original intensity Io.
13

CH 12 Sound
Example
: If you know that the HVT of the bone at ultrasound frequency
0.8MHz is 0.34 cm then what is the attenuation of intensity by 1 cm of
bone?
1/0.34 = 3
This mean: 1cm = 3HVT
The intensity will be reduced by a factor of 2
3
=8
So that remain is 12.5 %
14

CH 12 Sound
5. The body as a drum (percussion in medicine)
In 1761, Leopold Auenbrugger (Austrian physician) stated that with percussion he could
diagnose tumors, the presence of abnormal cavities in an organ, and those diseases
involving fluids in the chest region. He confirmed many of these diagnoses by examining
bodies after death.
Percussion Sounds
Three basic medical percussion sounds are described:
resonant, tympanic, and dull.
The resonant sound is heard over normal lung tissue.
The tympanic sound is heard over most portions of the normal abdominal cavity.
The dull sound is elicited over solid organs (e.g., the liver) as well as muscles.
15
CH 12 Sound
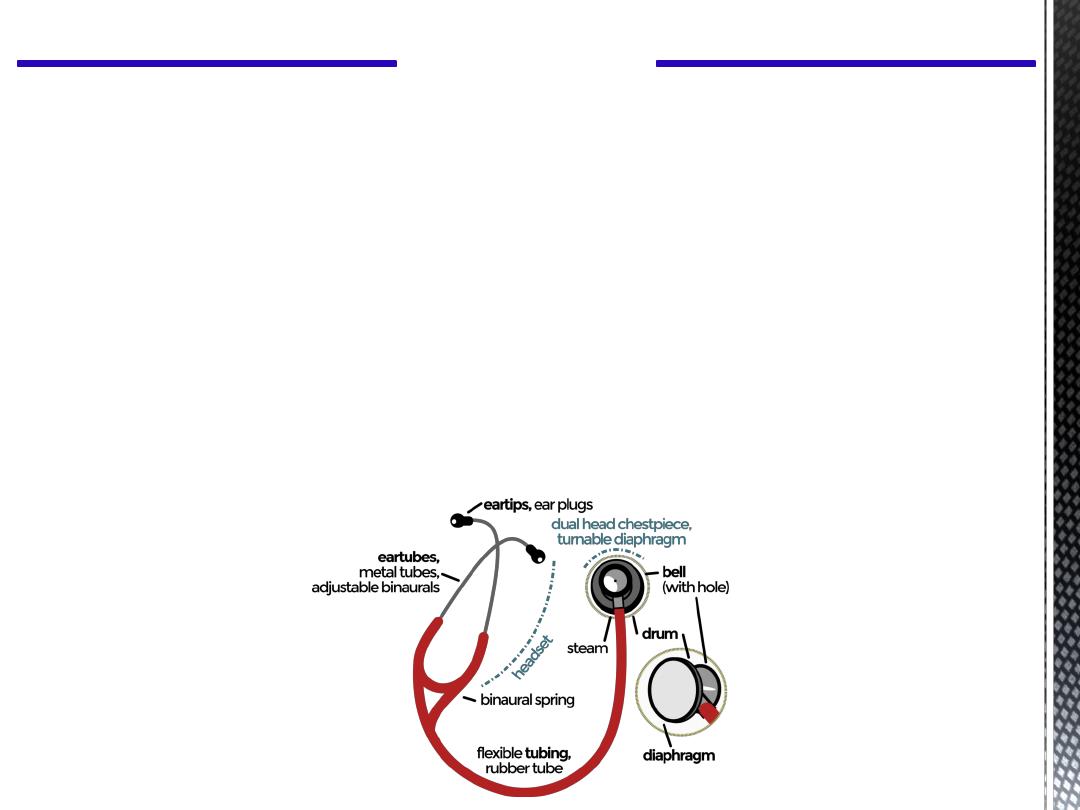
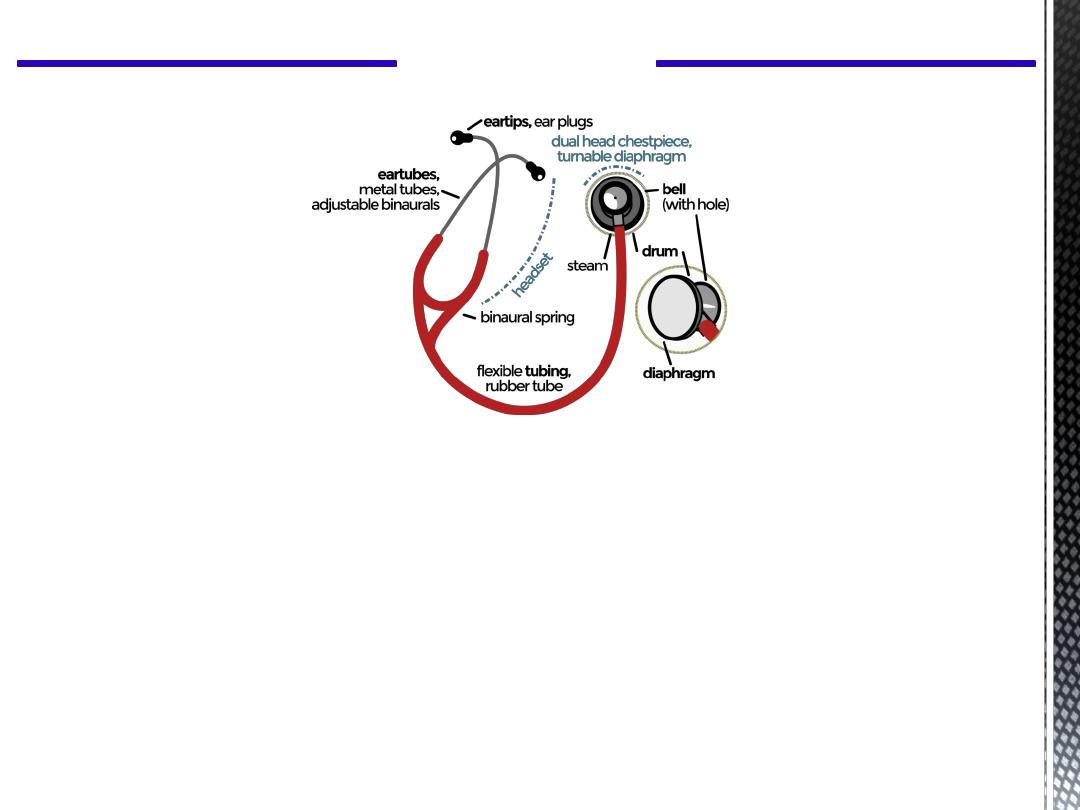
6. Stethoscope
A stethoscope is a medical device that is used, generally, by doctors, nurses and other
medical professionals.
Bell: The bell of a stethoscope is the cup shaped part at the end of the
tubing, usually opposite to the diaphragm. Not all stethoscopes have a
bell. The bell is used to listen to low pitched sounds.
Diaphragm: The diaphragm of a stethoscope is the flat part at the
end of the tubing, with the thin plastic “drum-like” covering. The
diaphragm is used to listen to high pitched sounds. Some stethoscopes
have a diaphragm but no bell.
16
CH 12 Sound
Tubing: The stethoscope tubing transmits sound from the bell or
diaphragm to the earpieces. Some stethoscopes have single tubes, some
have double tubes. Double tubes are more sensitive, but may rub against
one another causing “squeaks” to be heard.
Earpieces: Earpieces (gasp!) fit into the ears. They should angle slightly
forward for the best fit. Earpieces made of soft rubber are more comfortable
and may prevent outside sounds from interfering with your listening.
17
CH 12 Sound
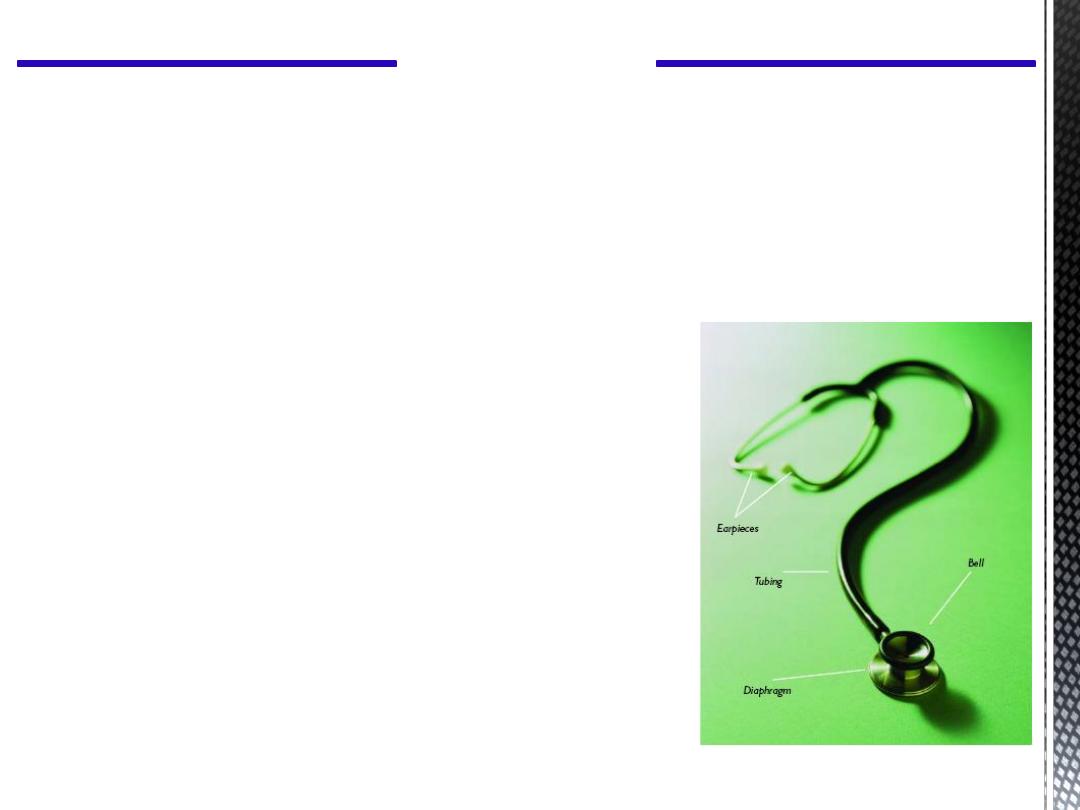
What is the stethoscope for?
Stethoscopes are used to hear sounds
generated from within the body.
They are used to listen to the heart, lungs and intestinal tract.
They are also used for measuring blood pressure.
18
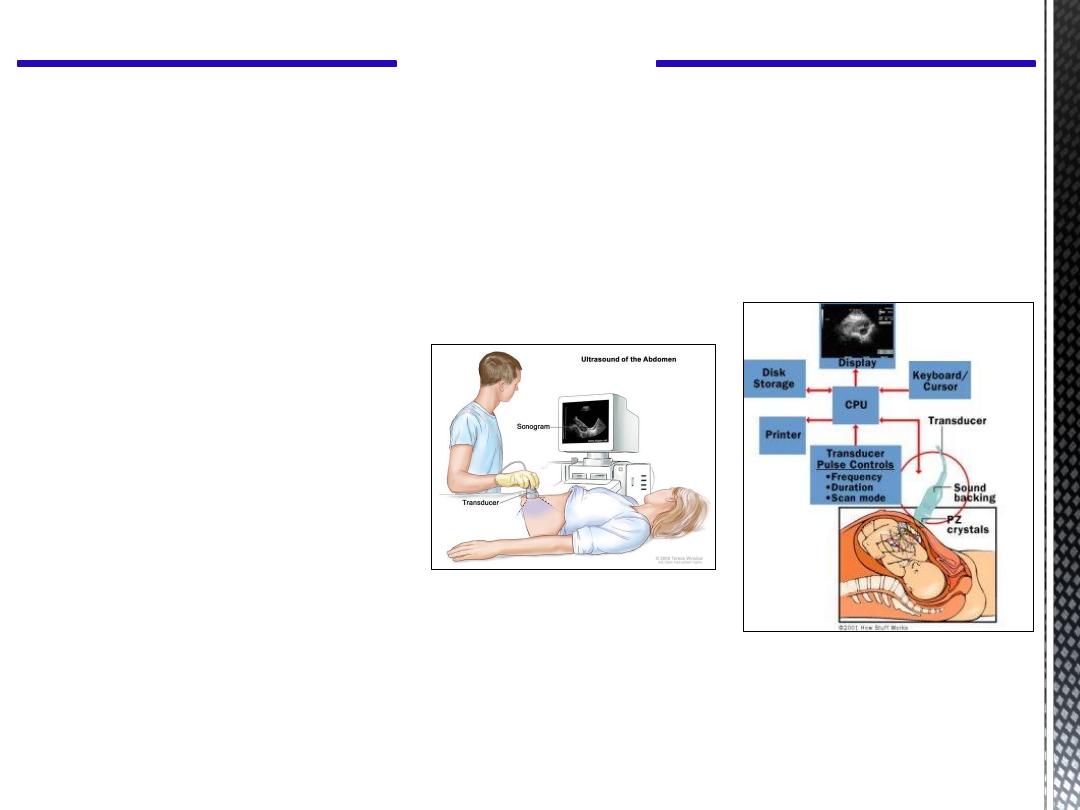
7. Ultrasound pictures of the body:
Basically an ultrasound source sends a beam of pulses of 1 to 5 MHz sound into
the body. The time required for the sound pulses to be reflected gives information
on the distance to various structures or organs in the path of ultrasound beam.
Generation of Ultrasound:
The most important method of generating ultrasound involves the piezoelectric
effect. Many crystals can be cut so that an oscillating voltage across the crystal
will produce a similar vibration of the crystal, thus generating a sound wave,
CH 12 Sound
19
Ultrasound generators are often simply referred to as
transducers
because they
convert
electrical energy into mechanical energy
and vice versa. Each transducer has a natural
resonance of vibration. The thinner the crystal, the higher the frequency at which it will
oscillate.
The same transducer that produces the pulse serves as the detector; the vibration of the
crystal produced
by the echoes generates
a voltage across it.
Transmitting Ultrasound Pulses:
Pulses of ultrasound are transmitted into the body by placing the vibrating crystal
in close contact with the skin, using water or a jelly paste to eliminate the air. this
gives a good coupling at the skin and greatly increases the transmission of ultrasound
into the body and of echoes back to the detector.
CH 12 Sound
20
To obtain diagnostic information about the depth of the structures in the body, we send
pulses of ultrasound into the body and from the time required to receive the reflected
sound (echoes) where equal (10
-6
sec) and the known velocity of sound in the body (1540
m/s), the distance to the reflecting structure can be determined. Pulses of
A scan
work are
typically a few microseconds long. They are usually emitted at 400 to 1000 pulses/sec.
Ultrasound Scanning Modes:
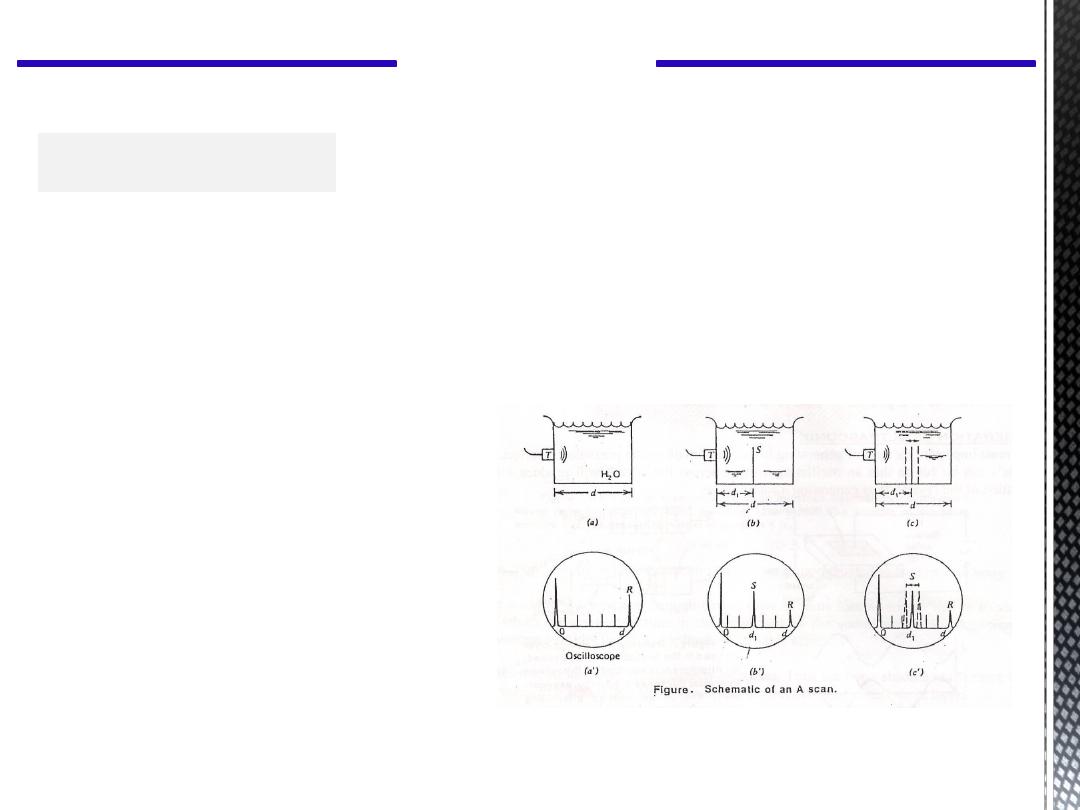
1.
A Scan :
Since the echo has been attenuated by
water, R is smaller in amplitude than
the initial pulse shown on the screen.
When the surface vibrates (the figure)
the position of the echo on the screen
also moves.
CH 12 Sound
The amount of reflection depends primarily on:
1.The difference in acoustic impedance of the two materials.
2. The orientation of the surface with respect to the beam.
21
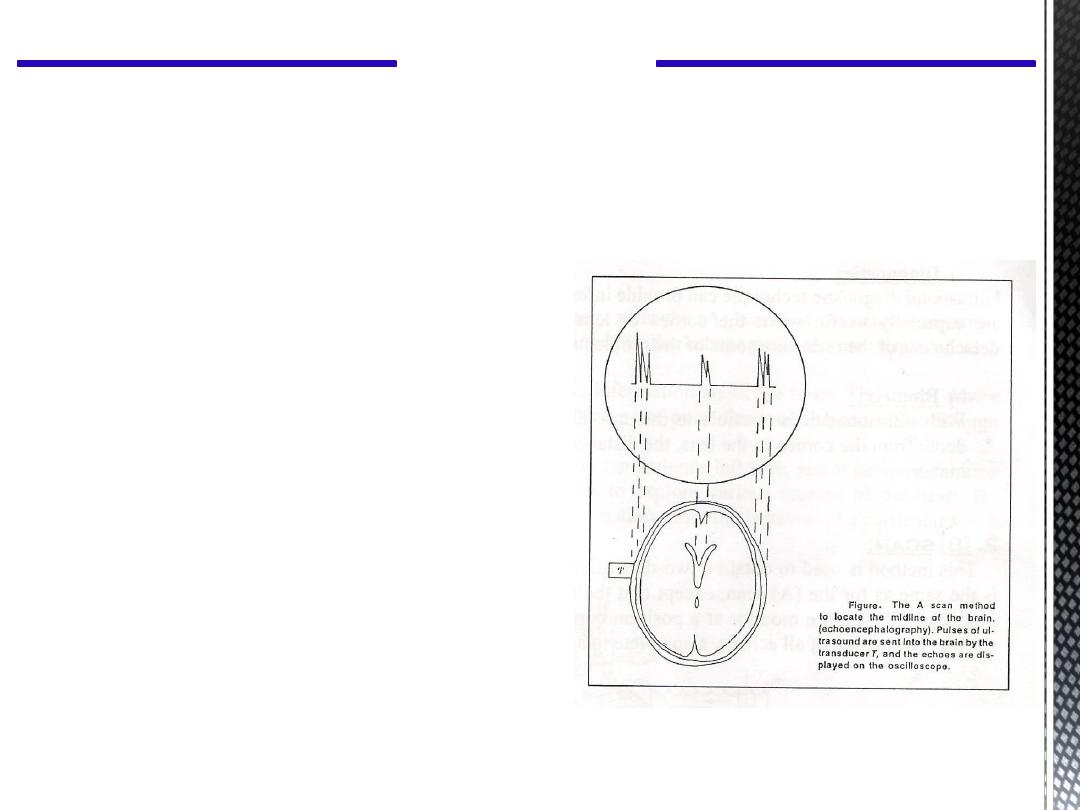
Pulses of ultrasound are sent into a thin
region of the skull slightly above the ear and
echoes from different structures within the head
are displayed on a screen.
The usual procedure is to compare the echoes
from the left side of the head to those from the
right side and to look for a shift in the midline
structure.
A tumor on one side of the brain tends to shift
midline toward the other side. Generally, a shift
of more than 3mm for adult, or 2mm for a child
is considered abnormal.
Applications of A scan:
1. Echoencephalography:
CH 12 Sound
22
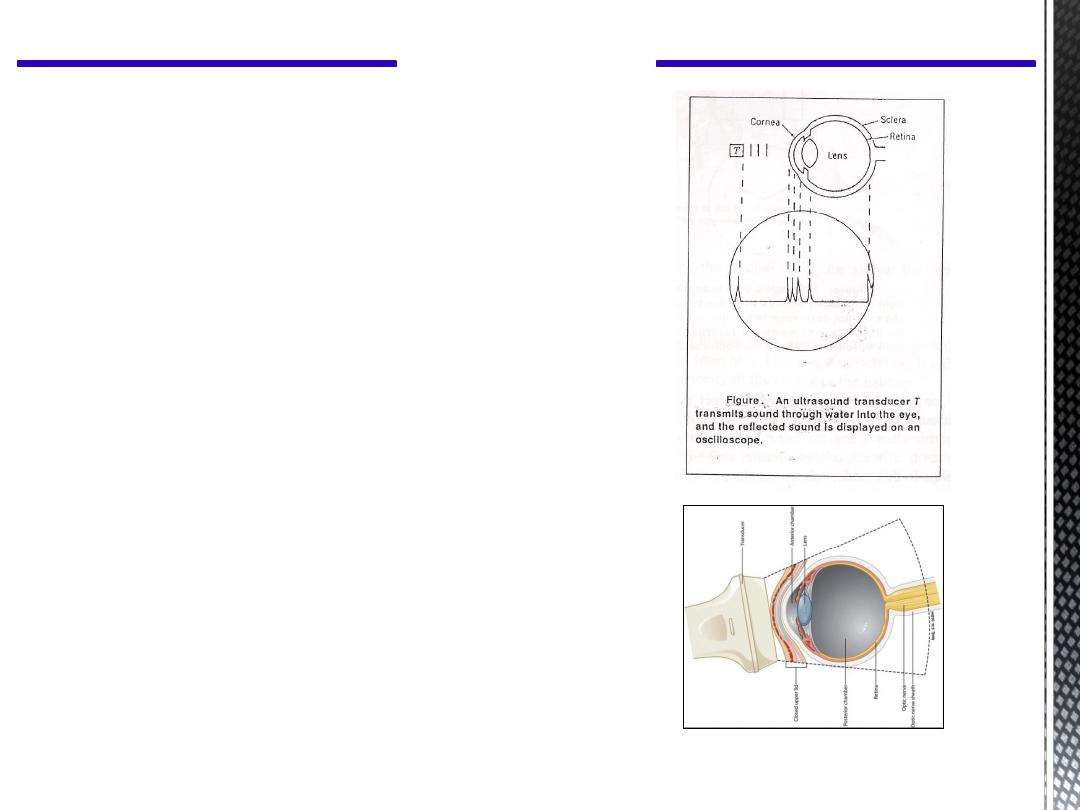
At low power levels of ultrasound, there is no
danger to the patient’s eye.
Ultrasound of high frequencies of up to 20 MHz
is used to produce better resolution.
Ophthalmologic applications are:
a)
Diagnostic:
ultrasound diagnostic
technique can provide information about
deeper regions of the eye and are
especially useful when the cornea or lens
is opaque. Tumors, foreign bodies, and
detachment of the retina are some of the
problems that can be diagnosed with
ultrasound.
b)
Biometry:
with ultrasound it is possible to
measure distance in the eye such as lens
thickness, depth from the cornea to the
lens, the distance to the retina, and the
thickness of vitreous humor.
2. Ophthalmology:
CH 12 Sound
23
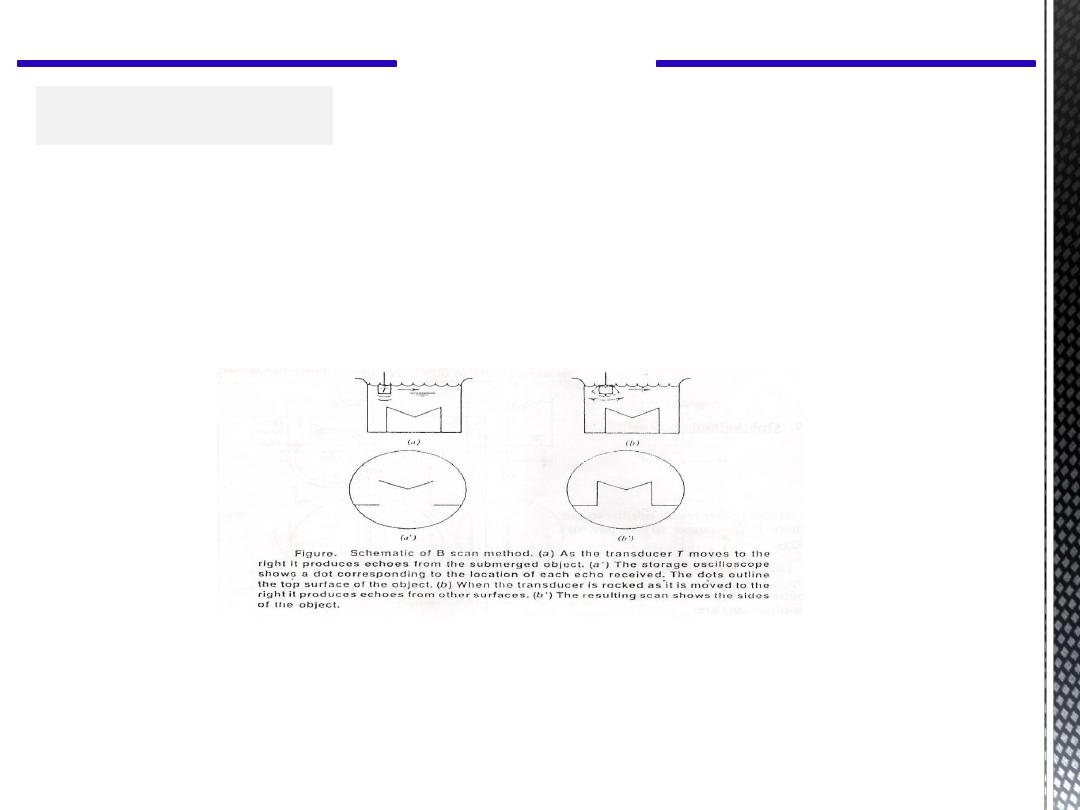
CH 12 Sound
This method is used to obtain a two-dimensional view of parts of the body. The
principle is the same as for the (A) scan, except that the transducer is moved. As a
result each echo produces a dot on the monitor at a position corresponding to the
location of the reflecting surface. By storage of all echoes, a complete image can be
made.
2.
B Scan
:
Conventional X-rays can only detect cysts that take up radio-opaque solutions, while
ultrasound can be used to quantitatively image many types of cysts. Tumors can be easily
detected when using
an improved gray-scale
display in which the large echoes appear
brighter than weak echoes. Greater range of echoes can be displayed when using the
color
display
. In this mode, echoes are electronically processed and fed to a computer.
24

CH 12 Sound
Diagnostic Imaging
Also called: Imaging
►Diagnostic imaging refers to technologies that doctors use to look inside
your body for clues about a medical condition. A variety of machines and
techniques can create pictures of the structures and activities inside your
body. The technology your doctor uses will depend on your symptoms and
the part of your body being examined.
X-rays, nuclear medicine scans,
MRI scans and ultrasound
are all types of diagnostic imaging.
►Many imaging tests are painless and easy.
25
CH 12 Sound
Ultrasound to measure motion
This is can be done by two ways:
1. M (Motion) Scan:
In this mode, the transducer is held stationary
as in the (A) scan and the echoes appear as dots
as in the (B) scan. But here, the changes in the
echoes positions are displayed as a function with
time.
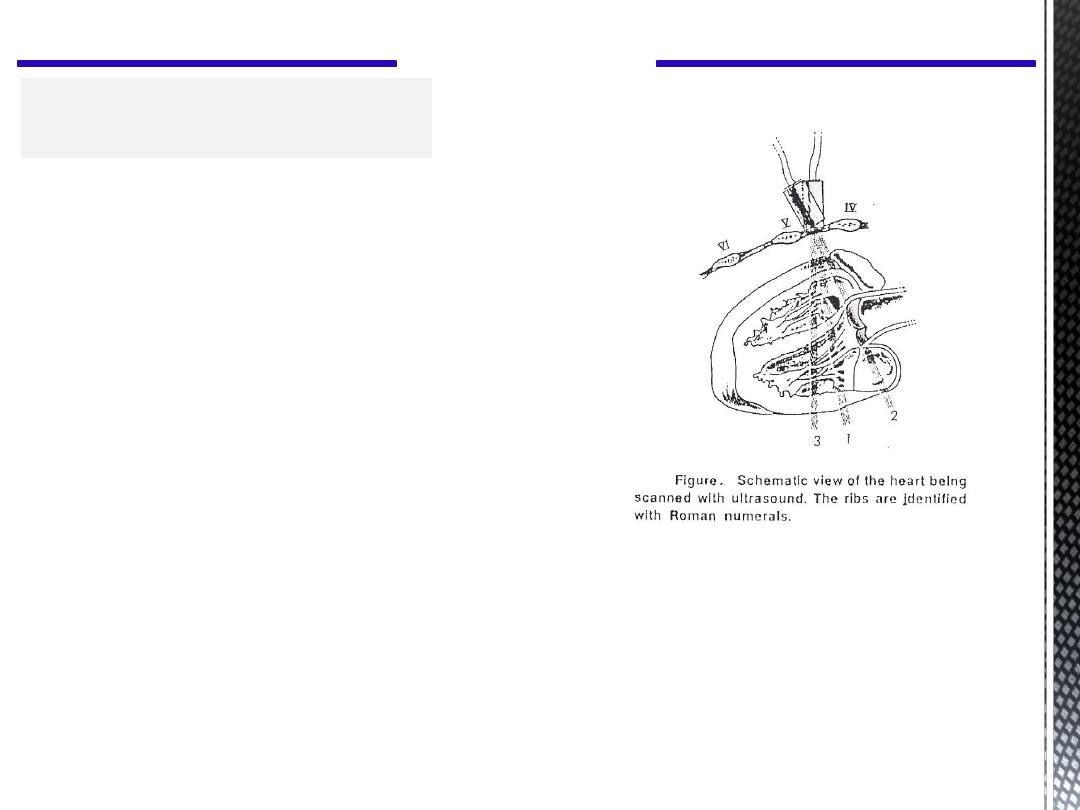
(M) Scan are used to obtain diagnostic
information about the heart. The places where the
heart can be probed are quite limited because of
poor ultrasound transmission through lung tissue
and the bone.
The usual method is to put the transducer on the patient's left side, aim it between the ribs over
the heart, and tip it at different angels to explore various regions of the heart. By moving the
probe it is possible to obtain information about the behavior of a particular valve or section of
the heart.
The information of interest is the rate of closing the studied valve; the slower the rate of
closure, the larger the amount of stenosis.
26
CH 12 Sound
2. Doppler Effect:
A source of sound with frequency
ƒ
o
will have a higher pitch when it is moving
towards a listener and a lower pitch when it is moving away from him. This
frequency change is called the
Doppler shift
. This shift will depend on the
velocity of the source or the listener.
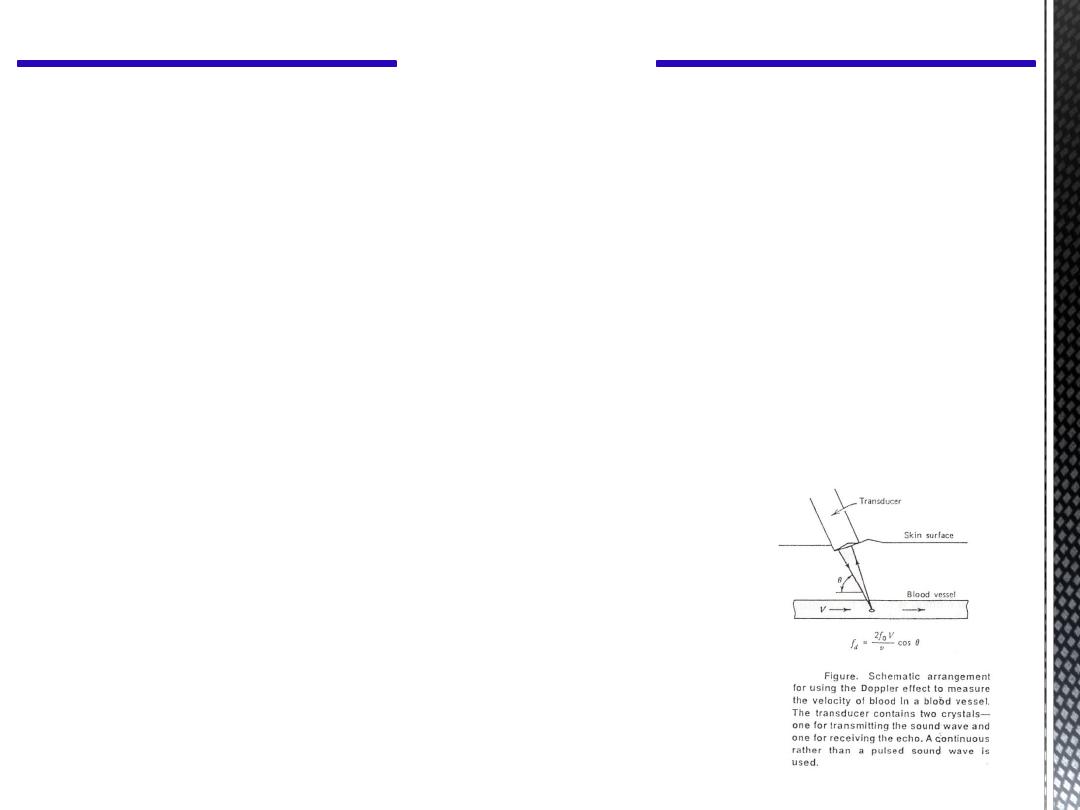
The Doppler effect can be used to measure the speed of moving objects or fluids
within the body, such as blood. When a continuous ultrasound beam is “received”
by some of red blood cells in a artery moving away from the source, the blood
“hears” a slightly lower frequency than the original frequency ƒ
o
The blood sends back scattered echoes of the sound
it “hears” , but since it is now a source of sound
moving away from the detector, there is another shift
to a still lower frequency. The detector receives a
back – scattered signal that has undergone a double
Doppler shift.
27

CH 12 Sound
When the blood is moving at an angle θ from the direction of the sound waves, the
frequency change ƒ
d
is:
cos
2
v
V
f
fd
o
Where:
ƒo is the frequency of the initial ultrasound wave
V is the velocity of blood
v is the velocity of sound
And θ is the angle between V and v .
The Doppler Effect is also used to detect motion of fetal heart, umbilical
cord, and placenta in order to establish fetal life during 12 to 20 week period
of gestation when radiological and clinical signs are unreliable.
28

CH 12 Sound
8. Physiological effects of ultrasound in therapy :
Various physical and chemical effects occur
when ultrasonic waves pass through
the body
, and they can cause physiological effects.
The magnitude of physiological effects
depends on the frequency and amplitude of
sound
.
At the very low intensity levels used for diagnostic work (0.01 W/cm2 average power and
20 W/cm2 peak power) no harmful effects have been observed.
The primary physical effects produced by ultrasound are temperature increase and
pressure variations. This effects used for therapy is the temperature rise due to the
absorption of acoustic energy in the tissue.
29

CH 12 Sound
Ultrasound waves interact with tissue primarily by
microscopic motion of the tissue
particles
. As a sound wave moves through tissue, the regions of compression and
rarefaction cause pressure differences in adjacent regions of tissue. Stretching occurs
in this region;
if the stretching exceeds the elastic limit of tissue
, tearing results. This
is why an eardrum can be ruptured by a very intense sound source.
30

Thank you
31

Questions
32