© 2012 Cengage Learning. All Rights Reserved. May not scanned, copied or duplicated, or posted to a publicly accessible website, in whole or in part.
Chapter 1: An Overview of the Investment Process
Analysis of Investments &
Management of Portfolios10TH EDITION
Reilly & Brown
What Is An Investment?Defining Investment: A current commitment of $ for a period of time in order to derive future payments that will compensate for:
The time the funds are committed
The expected rate of inflation
Uncertainty of future flow of funds
Reason for Investing: By investing (saving money now instead of spending it), individuals can tradeoff present consumption for a larger future consumption.
1-2
© 2012 Cengage Learning. All Rights Reserved. May not scanned, copied or duplicated, or posted to a publicly accessible website, in whole or in part.
What Is An Investment?
Pure Rate of Interest
It is the exchange rate between future consumption (future dollars) and present consumption (current dollars). Market forces determine this rate.
Example: If you can exchange $100 today for $104 next year, this rate is 4% (104/100-1).
Pure Time Value of Money
The fact that people are willing to pay more for the money borrowed and lenders desire to receive a surplus on their savings (money invested) gives rise to the value of time referred to as the pure time value of money.
1-3
© 2012 Cengage Learning. All Rights Reserved. May not scanned, copied or duplicated, or posted to a publicly accessible website, in whole or in part.
What Is An Investment?
Other Factors Affecting Investment ValueInflation: If the future payment will be diminished in value because of inflation, then the investor will demand an interest rate higher than the pure time value of money to also cover the expected inflation expense.
Uncertainty: If the future payment from the investment is not certain, the investor will demand an interest rate that exceeds the pure time value of money plus the inflation rate to provide a risk premium to cover the investment risk Pure Time Value of Money.
1-4
© 2012 Cengage Learning. All Rights Reserved. May not scanned, copied or duplicated, or posted to a publicly accessible website, in whole or in part.
What Is An Investment?
The Notion of Required Rate of ReturnThe minimum rate of return an investor require on an investment, including the pure rate of interest and all other risk premiums to compensate the investor for taking the investment risk.
Investors may expect to receive a rate of return different from the required rate of return, which is called expected rate of return. What would occur if these two rates of returns are not the same?
1-5
© 2012 Cengage Learning. All Rights Reserved. May not scanned, copied or duplicated, or posted to a publicly accessible website, in whole or in part.
Historical Rates of Return
Return over A Holding Period
Holding Period Return (HPR)
Holding Period Yield (HPY)
HPY=HPR-1Annual HPR and HPY
Annual HPR=HPR1/n
Annual HPY= Annual HPR -1=HPR1/n – 1
where n=number of years of the investment
1-6
Investment
of
Value
Beginning
Investment
of
Value
Ending
HPR
=
© 2012 Cengage Learning. All Rights Reserved. May not scanned, copied or duplicated, or posted to a publicly accessible website, in whole or in part.
Historical Rates of Return
• Example: Assume that you invest $200 at the beginning of the year and get back $220 at the end of the year. What are the HPR and the HPY for your investment?
1-7
• HPR=Ending value / Beginning value
• =$220/200
• =1.1
• HPY=HPR-1=1.1-1=0.1
• =10%
© 2012 Cengage Learning. All Rights Reserved. May not scanned, copied or duplicated, or posted to a publicly accessible website, in whole or in part.
Historical Rates of Return
• Example: Your investment of $250 in Stock A is worth $350 in two years while the investment of $100 in Stock B is worth $120 in six months. What are the annual HPRs and the HPYs on these two stocks?1-8
• Stock A
• Annual HPR=HPR1/n = ($350/$250)1/2 =1.1832
• Annual HPY=Annual HPR-1=1.1832-1=18.32%
• Stock B
• Annual HPR=HPR1/n = ($120/$100)1/0.5 =1.2544
• Annual HPY=Annual HPR-1=1.2544-1=25.44%
© 2012 Cengage Learning. All Rights Reserved. May not scanned, copied or duplicated, or posted to a publicly accessible website, in whole or in part.
Historical Rates of Return
• Computing Mean Historical Returns
• Suppose you have a set of annual rates of return (HPYs or HPRs) for an investment. How do you measure the mean annual return?
• Arithmetic Mean Return (AM)
• AM= HPY / n
• where HPY=the sum of all the annual HPYs
• n=number of years
• Geometric Mean Return (GM)
• GM= [ HPY] 1/n -1
• where HPR=the product of all the annual HPRs
• n=number of years
1-9
© 2012 Cengage Learning. All Rights Reserved. May not scanned, copied or duplicated, or posted to a publicly accessible website, in whole or in part.
Historical Rates of Return
• Suppose you invested $100 three years ago and it is worth $110.40 today. The information below shows the annual ending values and HPR and HPY. This example illustrates the computation of the AM and the GM over a three-year period for an investment.1-10
• Year Beginning Ending HPR HPY
• Value Value
• 1 100 115.0 1.15 0.15
• 2 115 138.0 1.20 0.20
• 3 138 110.4 0.80 -0.20
© 2012 Cengage Learning. All Rights Reserved. May not scanned, copied or duplicated, or posted to a publicly accessible website, in whole or in part.
Historical Rates of Return
• AM=[(0.15)+(0.20)+(-0.20)] / 3• = 0.15/3=5%
• GM=[(1.15) x (1.20) x (0.80)]1/3 – 1
• =(1.104)1/3 -1=1.03353 -1 =3.353%
Comparison of AM and GM
When rates of return are the same for all years, the AM and the GM will be equal.
When rates of return are not the same for all years, the AM will always be higher than the GM.
While the AM is best used as an “expected value” for an individual year, while the GM is the best measure of an asset’s long-term performance.
1-11
© 2012 Cengage Learning. All Rights Reserved. May not scanned, copied or duplicated, or posted to a publicly accessible website, in whole or in part.
Historical Rates of Return
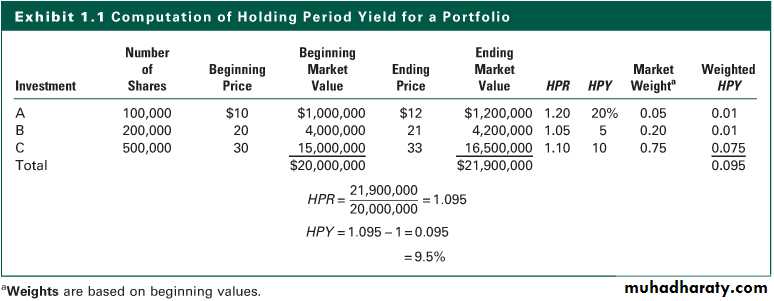
• A Portfolio of Investments• Portfolio HPY: The mean historical rate of return for a portfolio of investments is measured as the weighted average of the HPYs for the individual investments in the portfolio, or the overall change in the value of the original portfolio.
• The weights used in the computation are the relative beginning market values for each investment, which is often referred to as dollar-weighted or value-weighted mean rate of return.
• See Exhibit 1.1
1-12
© 2012 Cengage Learning. All Rights Reserved. May not scanned, copied or duplicated, or posted to a publicly accessible website, in whole or in part.
© 2012 Cengage Learning. All Rights Reserved. May not scanned, copied or duplicated, or posted to a publicly accessible website, in whole or in part.
1-13
Exhibit 1.1
Expected Rates of Return
In previous examples, we discussed realized historical rates of return. In contrast, an investor would be more interested in the expected return on a future risky investment.Risk refers to the uncertainty of the future outcomes of an investment
There are many possible returns/outcomes from an investment due to the uncertainty
Probability is the likelihood of an outcome
The sum of the probabilities of all the possible outcomes is equal to 1.0.
1-14
© 2012 Cengage Learning. All Rights Reserved. May not scanned, copied or duplicated, or posted to a publicly accessible website, in whole or in part.
Expected Rates of Return
Computing Expected Rate of Returnwhere P i = Probability for possible return i
R i = Possible return i1-15
© 2012 Cengage Learning. All Rights Reserved. May not scanned, copied or duplicated, or posted to a publicly accessible website, in whole or in part.
Probability Distributions
Exhibit 1.2Risk-free Investment
1-16
© 2012 Cengage Learning. All Rights Reserved. May not scanned, copied or duplicated, or posted to a publicly accessible website, in whole or in part.
Probability Distributions
Exhibit 1.3Risky Investment with 3 Possible Returns
1-17
© 2012 Cengage Learning. All Rights Reserved. May not scanned, copied or duplicated, or posted to a publicly accessible website, in whole or in part.
Probability Distributions
Exhibit 1.4Risky investment with ten possible returns
1-18
© 2012 Cengage Learning. All Rights Reserved. May not scanned, copied or duplicated, or posted to a publicly accessible website, in whole or in part.
Risk of Expected Return
Risk refers to the uncertainty of an investment; therefore the measure of risk should reflect the degree of the uncertainty.
The risk of expected return reflect the degree of uncertainty that actual return will be different from the expect return.
The common measures of risk are based on the variance of rates of return distribution of an investment
1-19
© 2012 Cengage Learning. All Rights Reserved. May not scanned, copied or duplicated, or posted to a publicly accessible website, in whole or in part.Risk of Expected Return
Measuring the Risk of Expected ReturnThe Variance Measure
1-20
å
å
=
=
-
=
-
=
n
i
i
i
i
n
i
R
E
R
P
turn
Expected
turn
Possible
x
obability
Variance
1
2
2
1
)]
(
[
)
Re
Re
(
)
(Pr
)
(
s
© 2012 Cengage Learning. All Rights Reserved. May not scanned, copied or duplicated, or posted to a publicly accessible website, in whole or in part.
Risk of Expected Return
Standard Deviation (σ): It is the square root of the variance and measures the total risk
1-21
å
=
-
=
n
i
i
i
i
R
E
R
P
1
2
)]
(
[
s
• Coefficient of Variation (CV): It measures the risk per unit of expected return and is a relative measure of risk.
•
)
(
R
E
Return
of
Rate
Expected
Return
of
Deviation
Standard
CV
s
=
=
© 2012 Cengage Learning. All Rights Reserved. May not scanned, copied or duplicated, or posted to a publicly accessible website, in whole or in part.
Risk of Historical Rates of Return
where, σ 2 = the variance of the seriesHPY i = the holding period yield during period i
E(HPY) = the expected value of the HPY equal to the arithmetic mean of the series (AM)
n = the number of observations
1-22
Given a series of historical returns measured by HPY, the risk of returns is measured as:
© 2012 Cengage Learning. All Rights Reserved. May not scanned, copied or duplicated, or posted to a publicly accessible website, in whole or in part.
Determinants of Required Returns
Three Components of Required Return:
The time value of money during the time period
The expected rate of inflation during the period
The risk involved
See Exhibit 1.5
Complications of Estimating Required Return
A wide range of rates is available for alternative investments at any time.
The rates of return on specific assets change dramatically over time.
The difference between the rates available on different assets change over time.
1-23
© 2012 Cengage Learning. All Rights Reserved. May not scanned, copied or duplicated, or posted to a publicly accessible website, in whole or in part.
Determinants of Required Returns
The Real Risk Free Rate (RRFR)Assumes no inflation.
Assumes no uncertainty about future cash flows.
Influenced by time preference for consumption of income and investment opportunities in the economy
Nominal Risk-Free Rate (NRFR)
Conditions in the capital market
Expected rate of inflation
NRFR=(1+RRFR) x (1+ Rate of Inflation) - 1
RRFR=[(1+NRFR) / (1+ Rate of Inflation)] - 1
1-24
© 2012 Cengage Learning. All Rights Reserved. May not scanned, copied or duplicated, or posted to a publicly accessible website, in whole or in part.
Determinants of Required Returns
Business Risk
Uncertainty of income flows caused by the nature of a firm’s business
Sales volatility and operating leverage determine the level of business risk.
Financial Risk
Uncertainty caused by the use of debt financing.
Borrowing requires fixed payments which must be paid ahead of payments to stockholders.
The use of debt increases uncertainty of stockholder income and causes an increase in the stock’s risk premium.
1-25
© 2012 Cengage Learning. All Rights Reserved. May not scanned, copied or duplicated, or posted to a publicly accessible website, in whole or in part.
Determinants of Required Returns
Liquidity RiskHow long will it take to convert an investment into cash?
How certain is the price that will be received?
Exchange Rate Risk
Uncertainty of return is introduced by acquiring securities denominated in a currency different from that of the investor.
Changes in exchange rates affect the investors return when converting an investment back into the “home” currency.
1-26
© 2012 Cengage Learning. All Rights Reserved. May not scanned, copied or duplicated, or posted to a publicly accessible website, in whole or in part.
Determinants of Required Returns
Country Risk
Political risk is the uncertainty of returns caused by the possibility of a major change in the political or economic environment in a country.
Individuals who invest in countries that have unstable political-economic systems must include a country risk-premium when determining their required rate of return.
1-27
© 2012 Cengage Learning. All Rights Reserved. May not scanned, copied or duplicated, or posted to a publicly accessible website, in whole or in part.
Determinants of Required Returns
Risk Premium and Portfolio TheoryFrom a portfolio theory perspective, the relevant risk measure for an individual asset is its co-movement with the market portfolio.
Systematic risk relates the variance of the investment to the variance of the market.
Beta measures this systematic risk of an asset.
According to the portfolio theory, the risk premium depends on the systematic risk.
1-28
© 2012 Cengage Learning. All Rights Reserved. May not scanned, copied or duplicated, or posted to a publicly accessible website, in whole or in part.
Determinants of Required Returns
Fundamental Risk versus Systematic RiskFundamental risk comprises business risk, financial risk, liquidity risk, exchange rate risk, and country risk.
Risk Premium= f ( Business Risk, Financial Risk, Liquidity Risk, Exchange Rate Risk, Country Risk)
Systematic risk refers to the portion of an individual asset’s total variance attributable to the variability of the total market portfolio.
Risk Premium= f (Systematic Market Risk)
1-29
© 2012 Cengage Learning. All Rights Reserved. May not scanned, copied or duplicated, or posted to a publicly accessible website, in whole or in part.
Relationship Between Risk and Return
The Security Market Line (SML)
It shows the relationship between risk and return for all risky assets in the capital market at a given time.
Investors select investments that are consistent with their risk preferences.
1-30
Expected
ReturnRisk
(business risk, etc., or systematic risk-beta)
NRFR
Security
Market Line
Low
Risk
Average
Risk
High
Risk
The slope indicates the
required return per unit of risk
© 2012 Cengage Learning. All Rights Reserved. May not scanned, copied or duplicated, or posted to a publicly accessible website, in whole or in part.
Relationship Between Risk and Return
Movement along the SMLWhen the risk changes, the expected return will also change, moving along the SML.
Risk premium: RPI = E(Ri) - NRFR
1-31
Return
Risk(business risk, etc., or systematic risk-beta)
NRFR
SML
Expected
Movements along the curvethat reflect changes in the
risk of the asset
© 2012 Cengage Learning. All Rights Reserved. May not scanned, copied or duplicated, or posted to a publicly accessible website, in whole or in part.
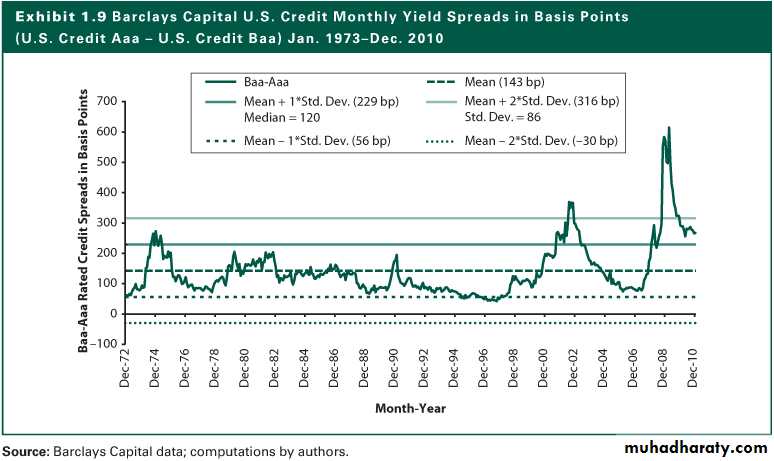
Exhibit 1.9
© 2012 Cengage Learning. All Rights Reserved. May not scanned, copied or duplicated, or posted to a publicly accessible website, in whole or in part.
1-32
Relationship Between Risk and Return
Changes in the Slope of the SMLWhen there is a change in the attitude of investors toward risk, the slope of the SML will also change.
If investors become more risk averse, then the SML will have a steeper slope, indicating a higher risk premium, RPi, for the same risk level.
1-33
Risk
NRFROriginal SML
New SMLR m
R m’
Expected Return
© 2012 Cengage Learning. All Rights Reserved. May not scanned, copied or duplicated, or posted to a publicly accessible website, in whole or in part.
Relationship Between Risk and Return
Changes in Market Condition or Inflation
A change in the RRFR or the expected rate of inflation will cause a parallel shift in the SML.
When nominal risk-free rate increases, the SML will shift up, implying a higher rate of return while still having the same risk premium.
Risk
NRFROriginal SML
New SMLExpected Return
NRFR'
© 2012 Cengage Learning. All Rights Reserved. May not scanned, copied or duplicated, or posted to a publicly accessible website, in whole or in part.
1-34
The Internet Investments Onlinehttp://www.finpipe.com
http://www.investorguide.com
http://www.aaii.com
http://www.economist.com
http://online.wsj.com
http://www.forbes.com
http://www.barrons.com
http://fisher.osu.edu/fin/journal/jofsites.htm
http://www.ft.com
http://www.fortune.com
http://www.smartmoney.com
http://www.worth.com
http://money.cnn.com
1-35
© 2012 Cengage Learning. All Rights Reserved. May not scanned, copied or duplicated, or posted to a publicly accessible website, in whole or in part.