
ECG

An ECG is a series of waves and deflections recording the heart’s
electrical activity from a certain “view.”
Indication of ECG
1. Ischemic heart disease
2. Rhythm disorders
3. Chamber size
4. Non cardiac disease ; electrolyte disturbance

CLINICAL TIPS
ECG should be interpreted in the appropriate clinical setting.
Normal ECG not exclude cardiac disease
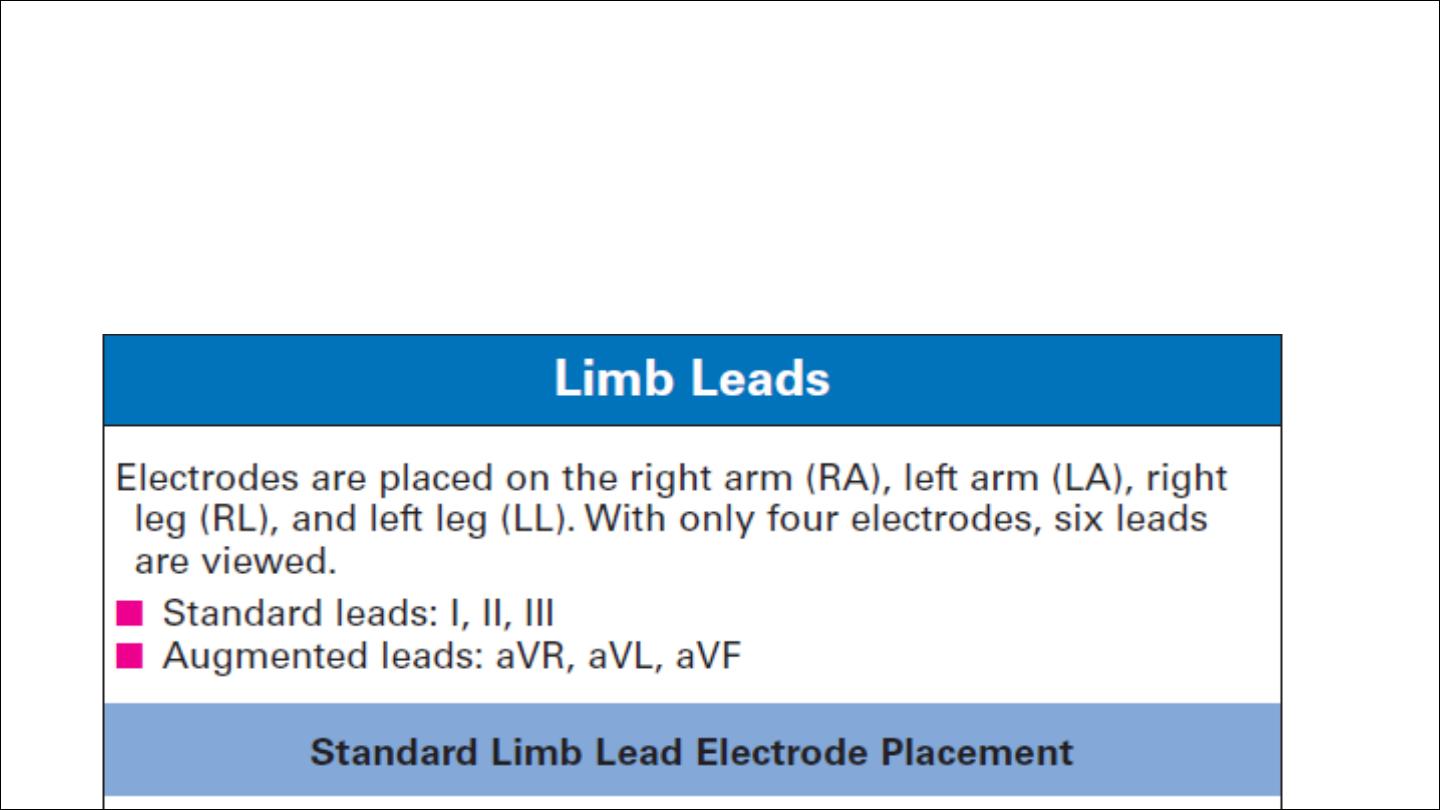
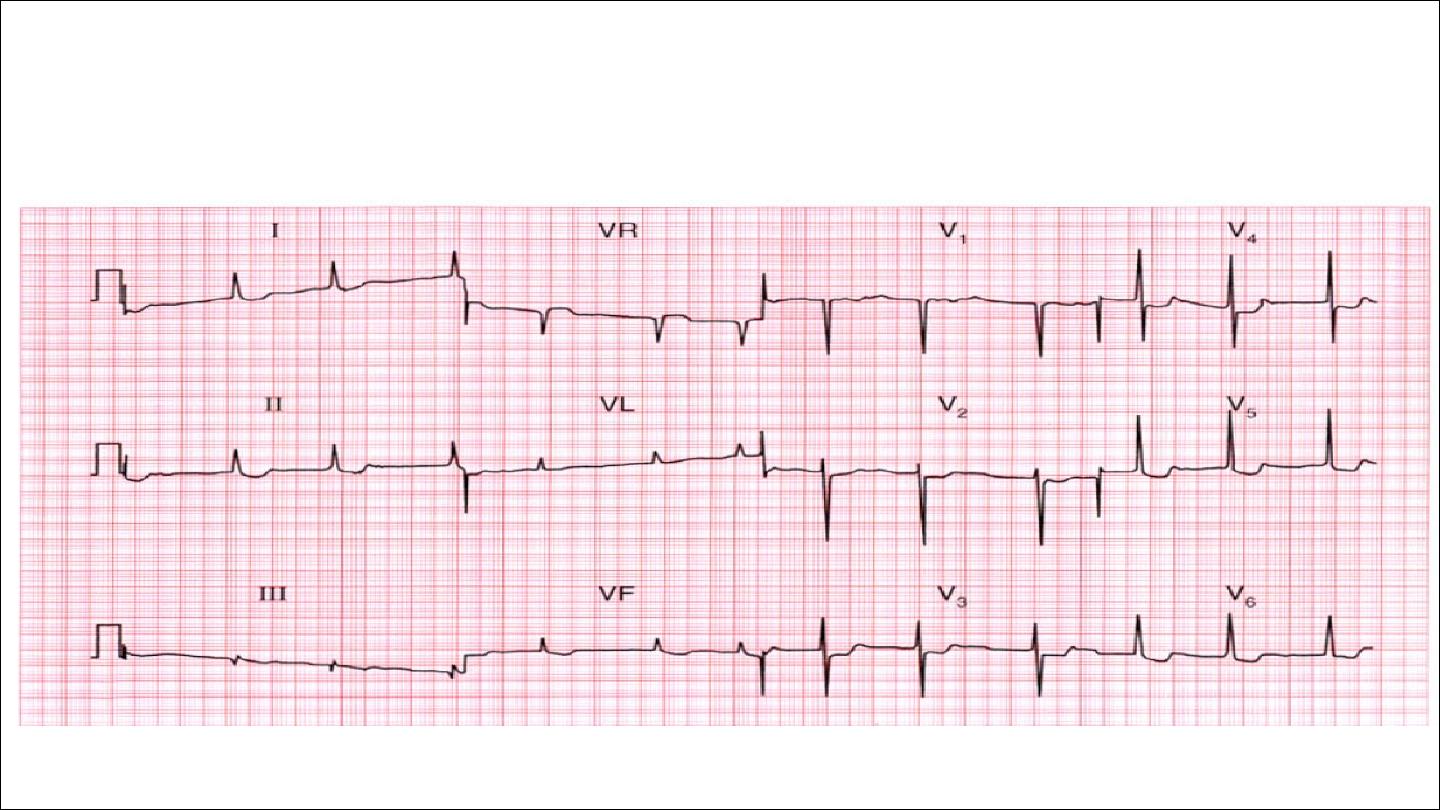
ECG leads
Limbs electrode : 4
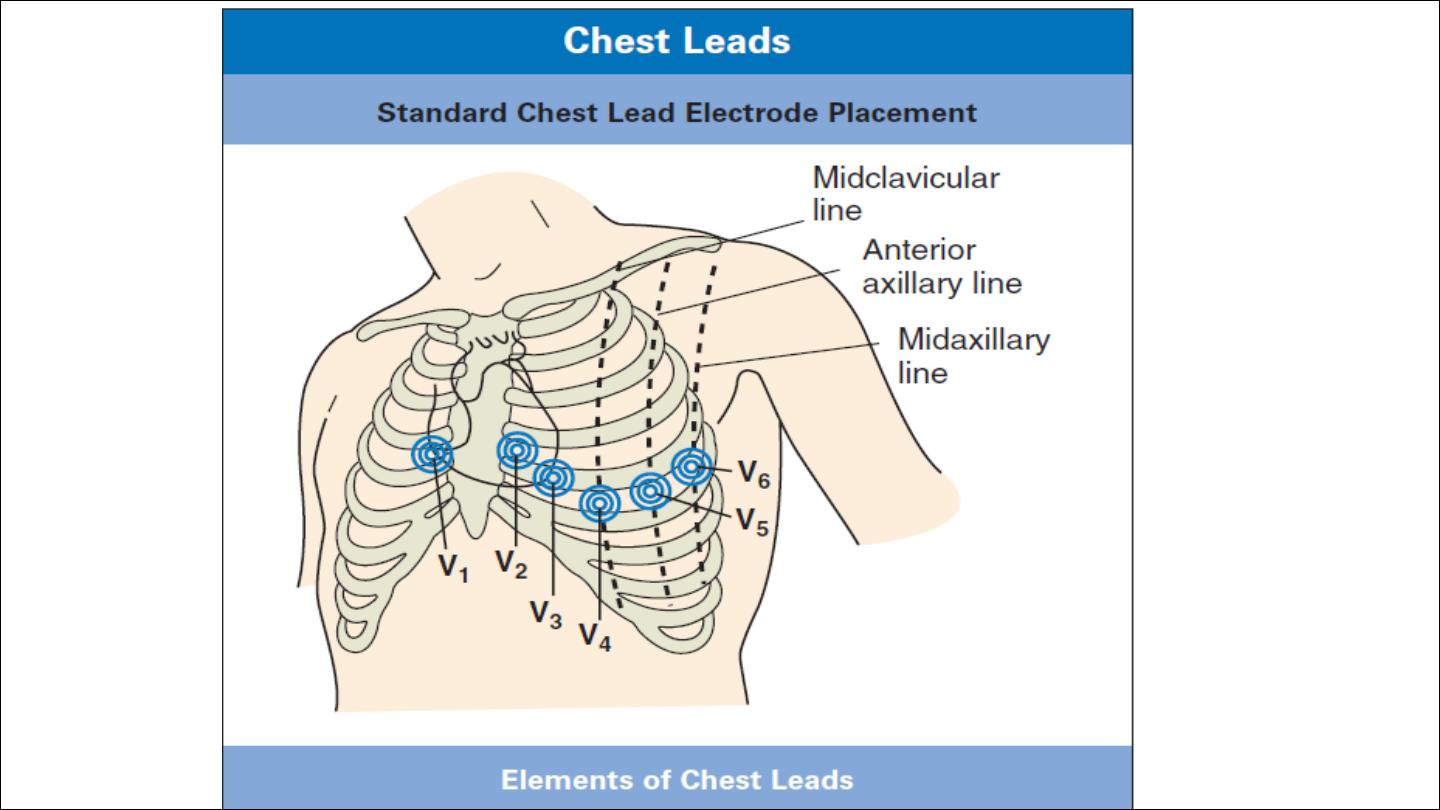
Chest electrode : 6
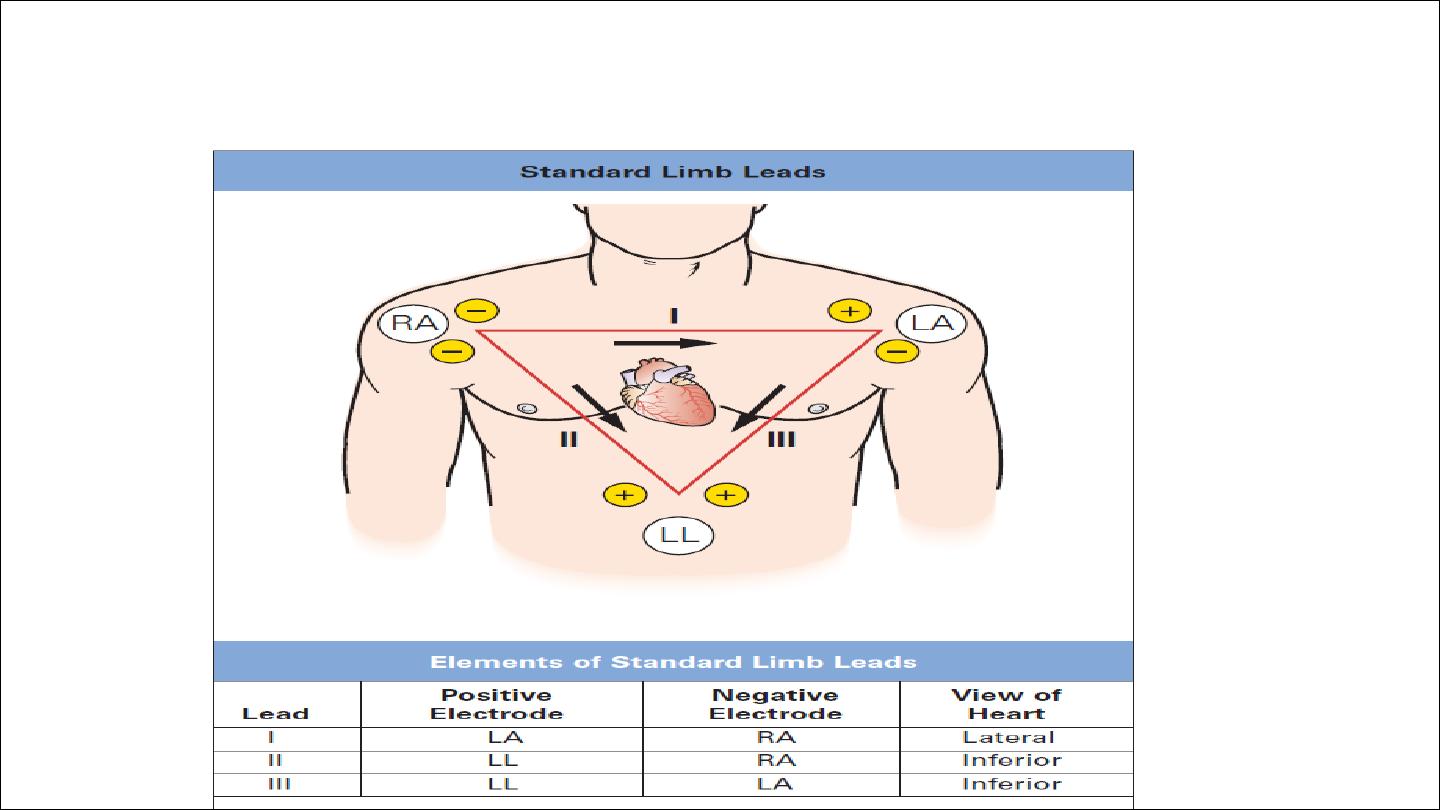
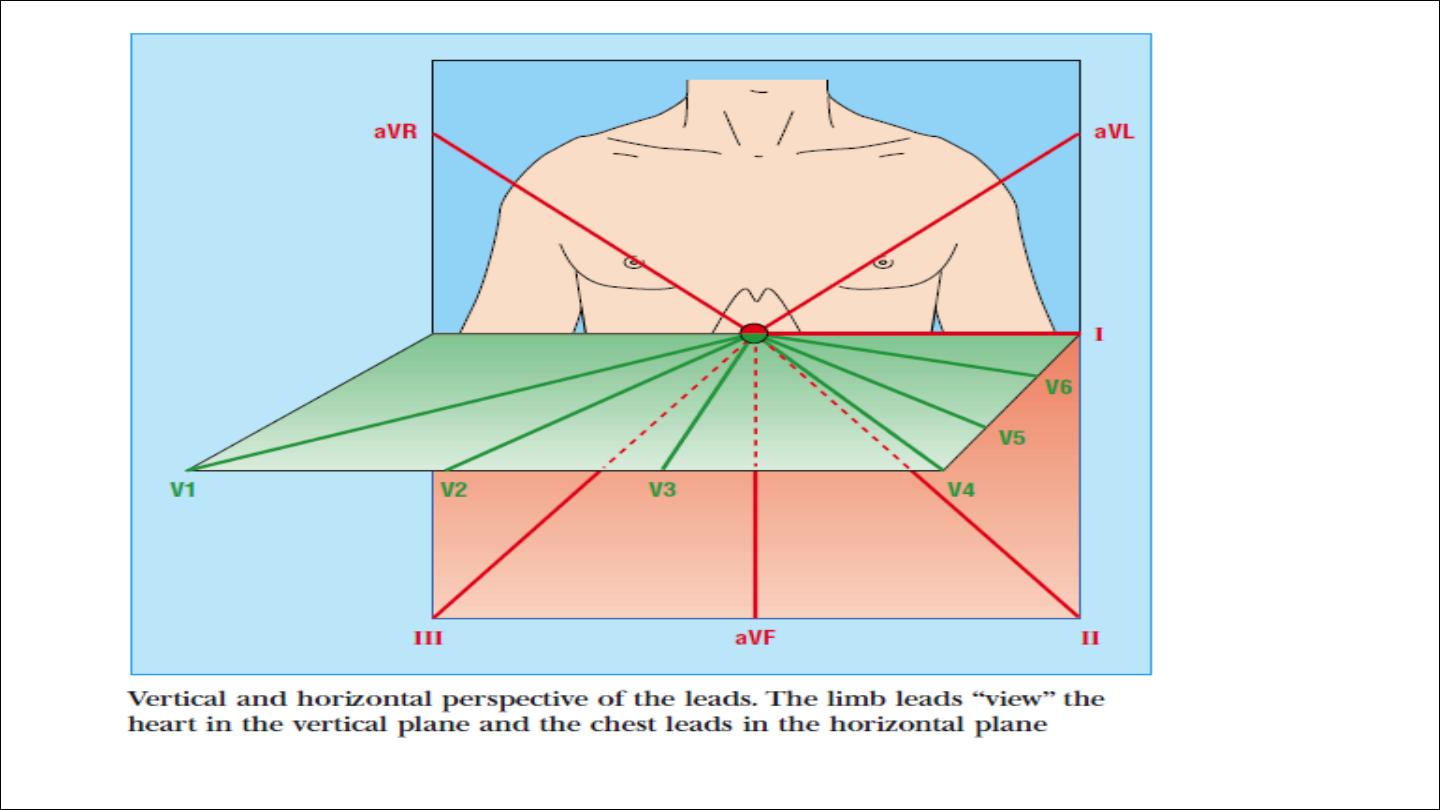
Einthoven Triangle

Leads I, II, and III are bipolar leads, which consist of two electrodes
of opposite polarity (positive and negative). The third (ground)
electrode minimizes electrical activity from other sources.
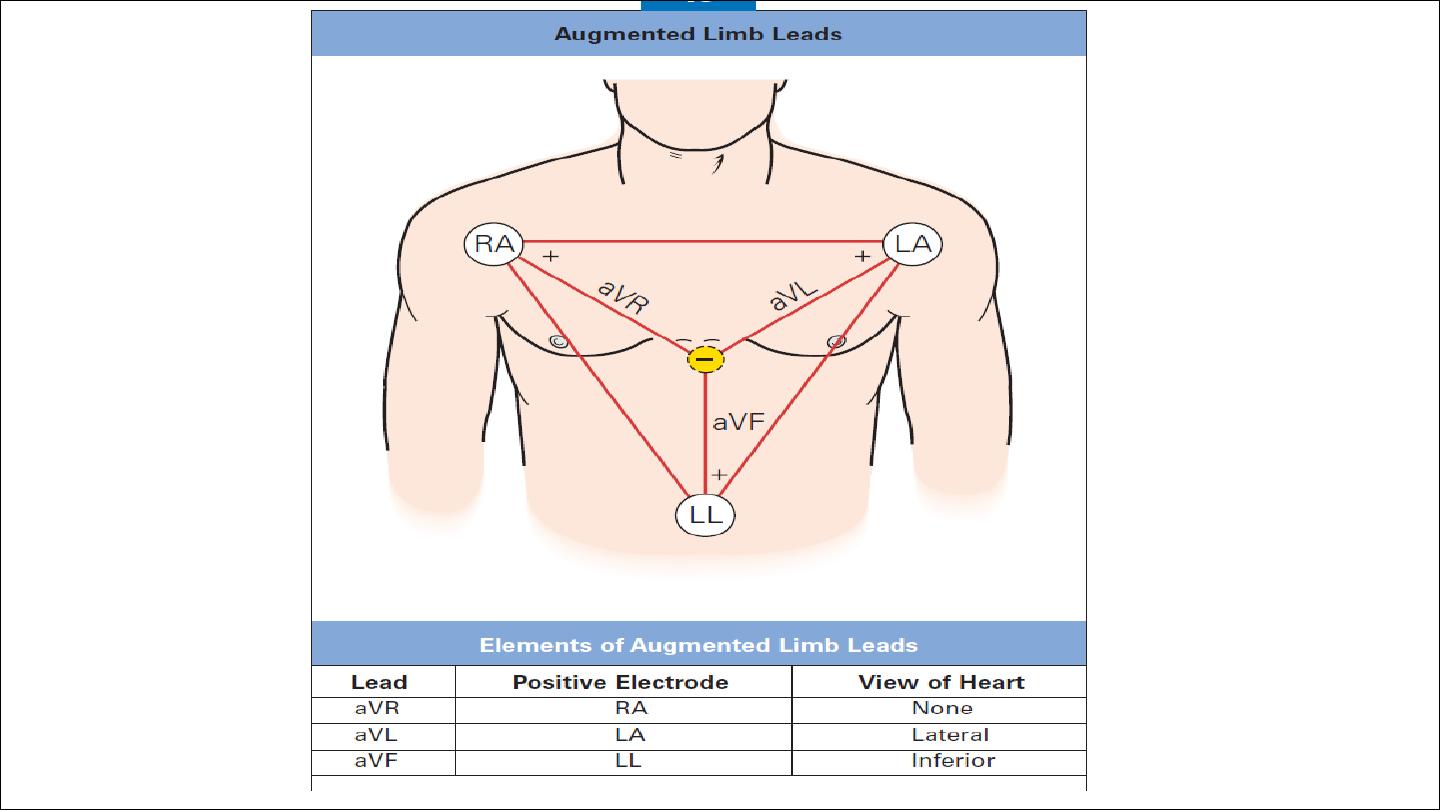
Leads aVR, aVL, and aVF are unipolar leads and consist of a single
positive electrode and a reference point (with zero electrical
potential) that lies in the center of the heart’s electrical field.
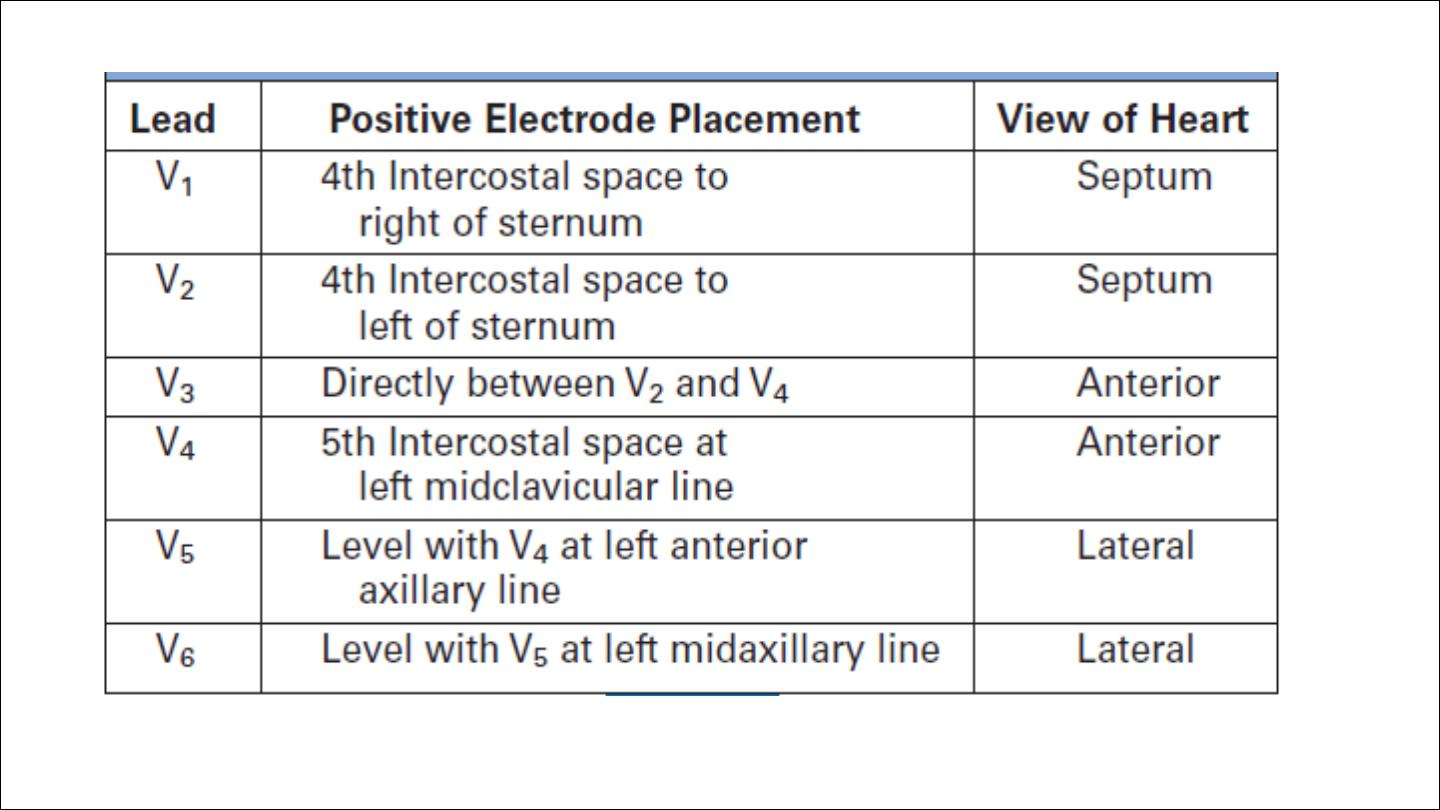
Leads V1–V6 are unipolar leads and consist of a single positive
electrode with a negative reference point found at the electrical
center of the heart.

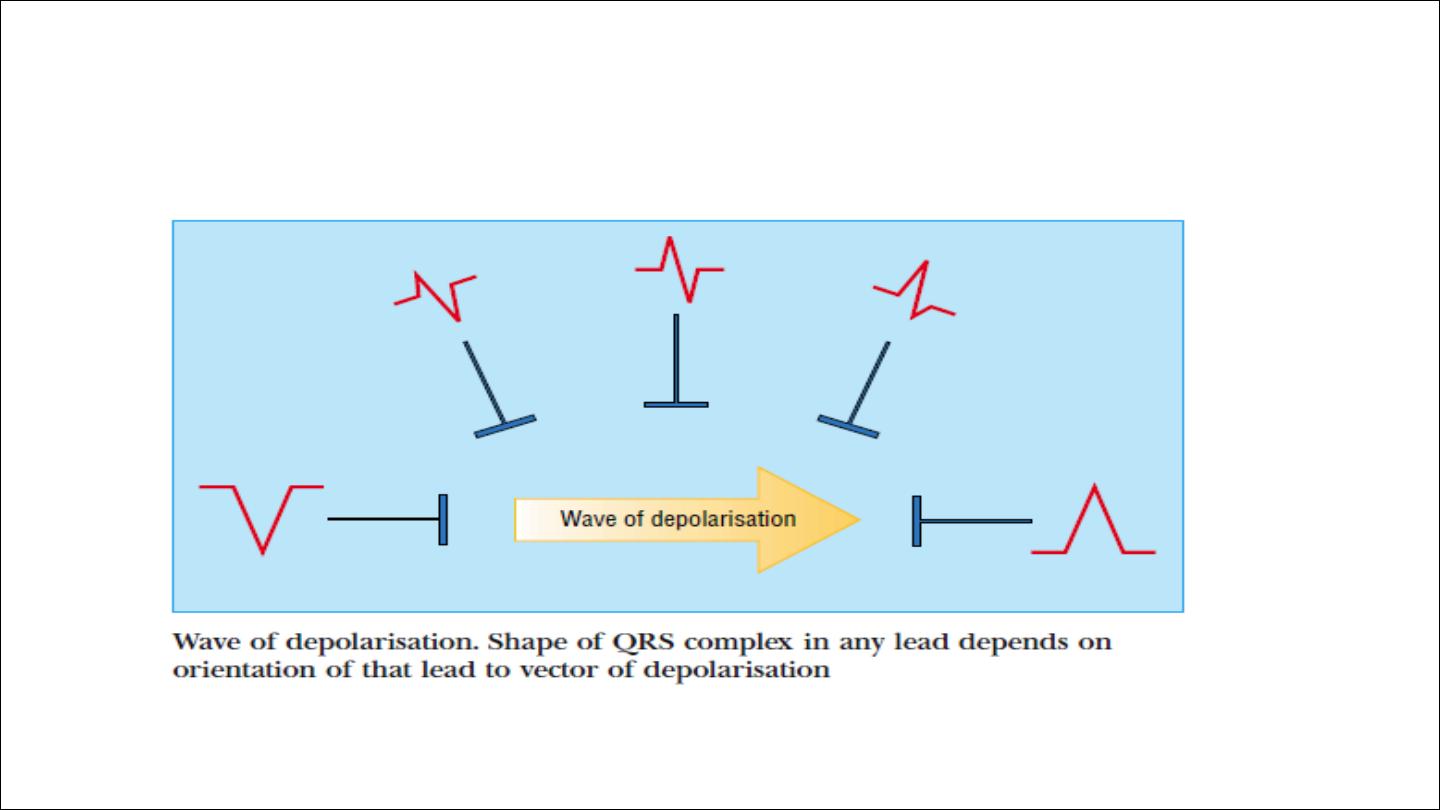
The direction of the deflection on the electrocardiogram depends on
whether the electrical impulse is travelling towards or away from a
detecting electrode.
By convention, an electrical impulse travelling directly towards the
electrode produces an upright (“positive”) deflection relative to the
isoelectric baseline ,whereas an impulse moving directly away from an
electrod produces a downward (“negative”) deflection relative to the
baseline.
When the wave of depolarisation is at right angles to the lead, an
equiphasic deflection is produced.
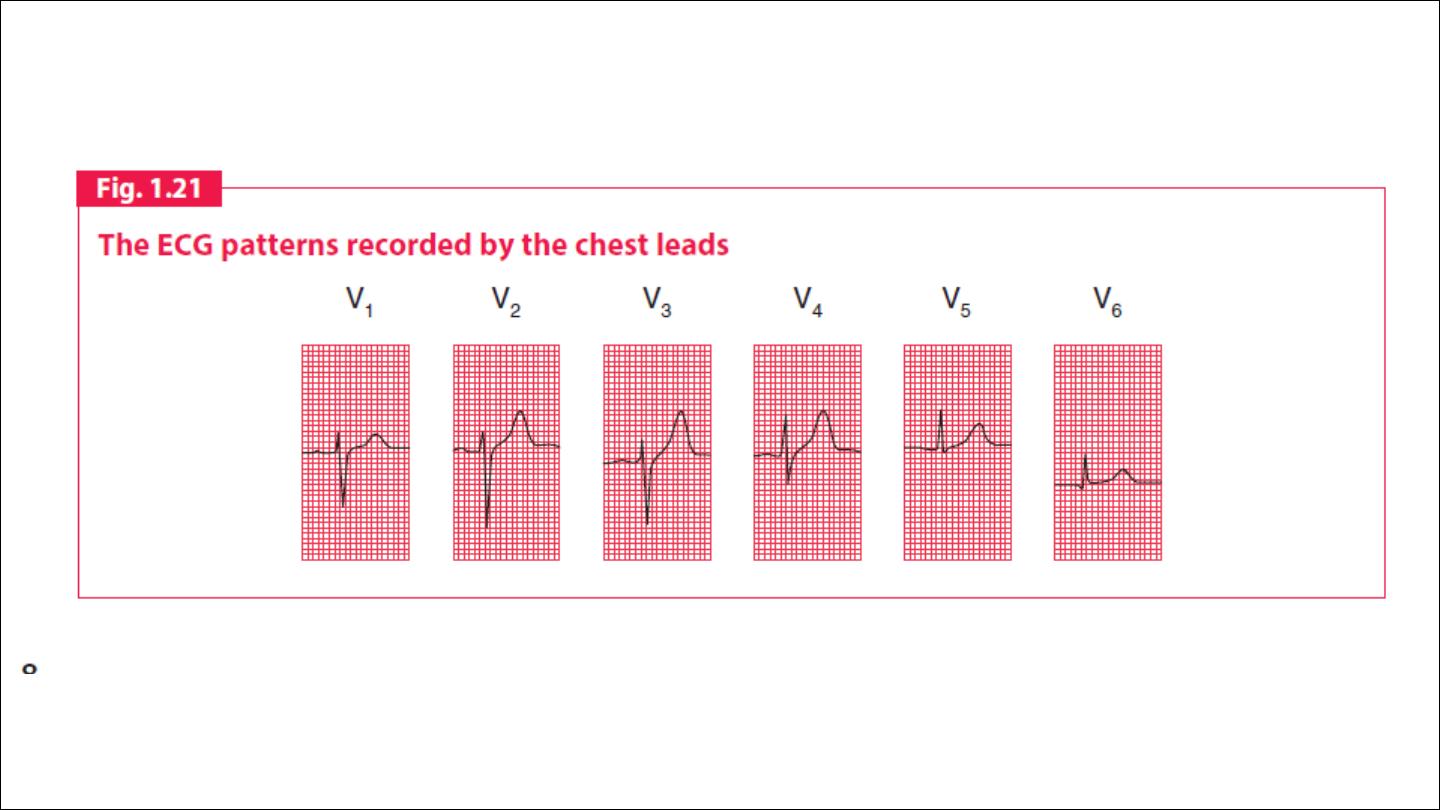
The six chest leads (V1 to V6) “view” the heart in the horizontal plane.

ECG interpretation
1. Demographic details; name, age, date
2. standardization
3. Rate
4. Rhythm
5. Cardiac axis
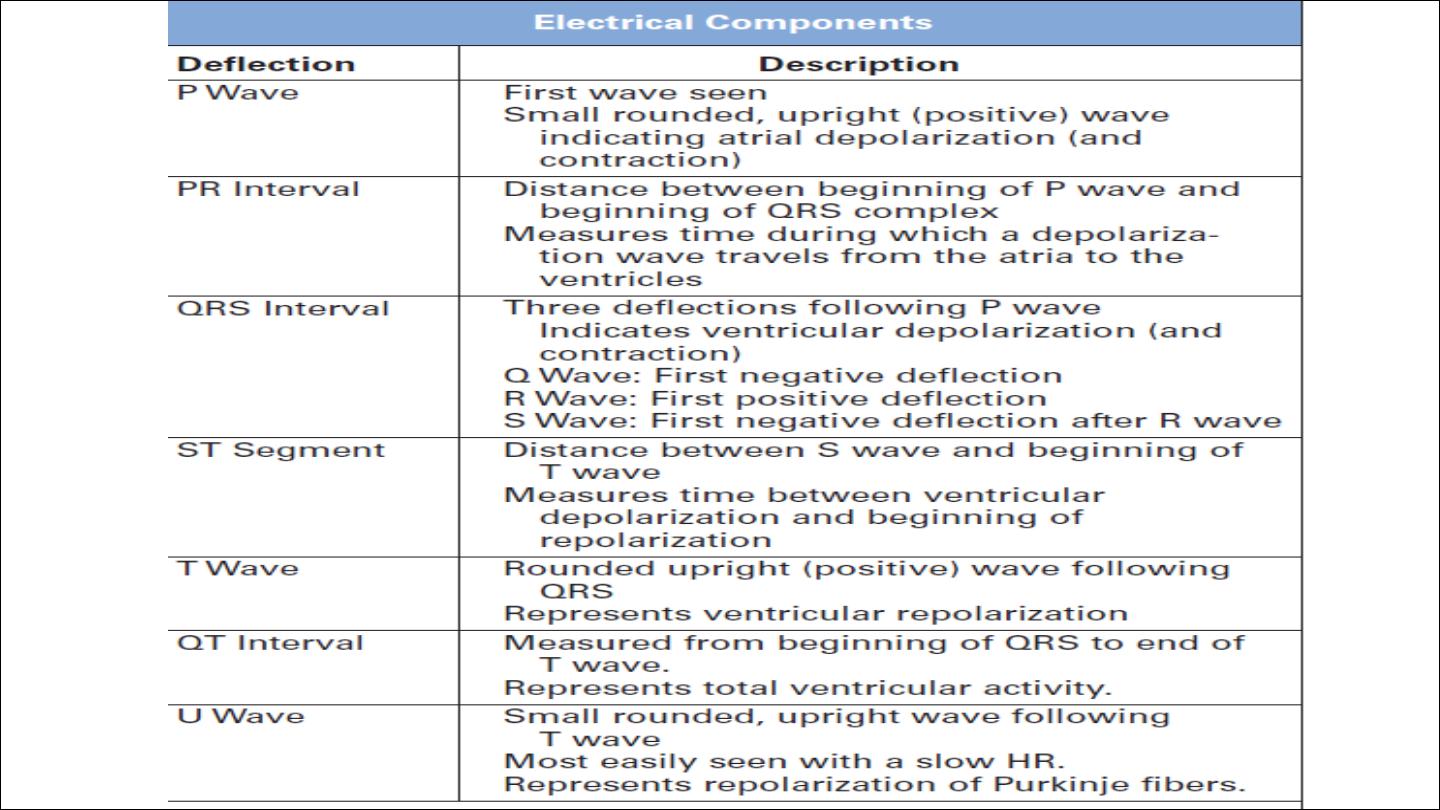
6. P wave
7. QRS complex
8. PR interval
9. ST segment
10. T wave
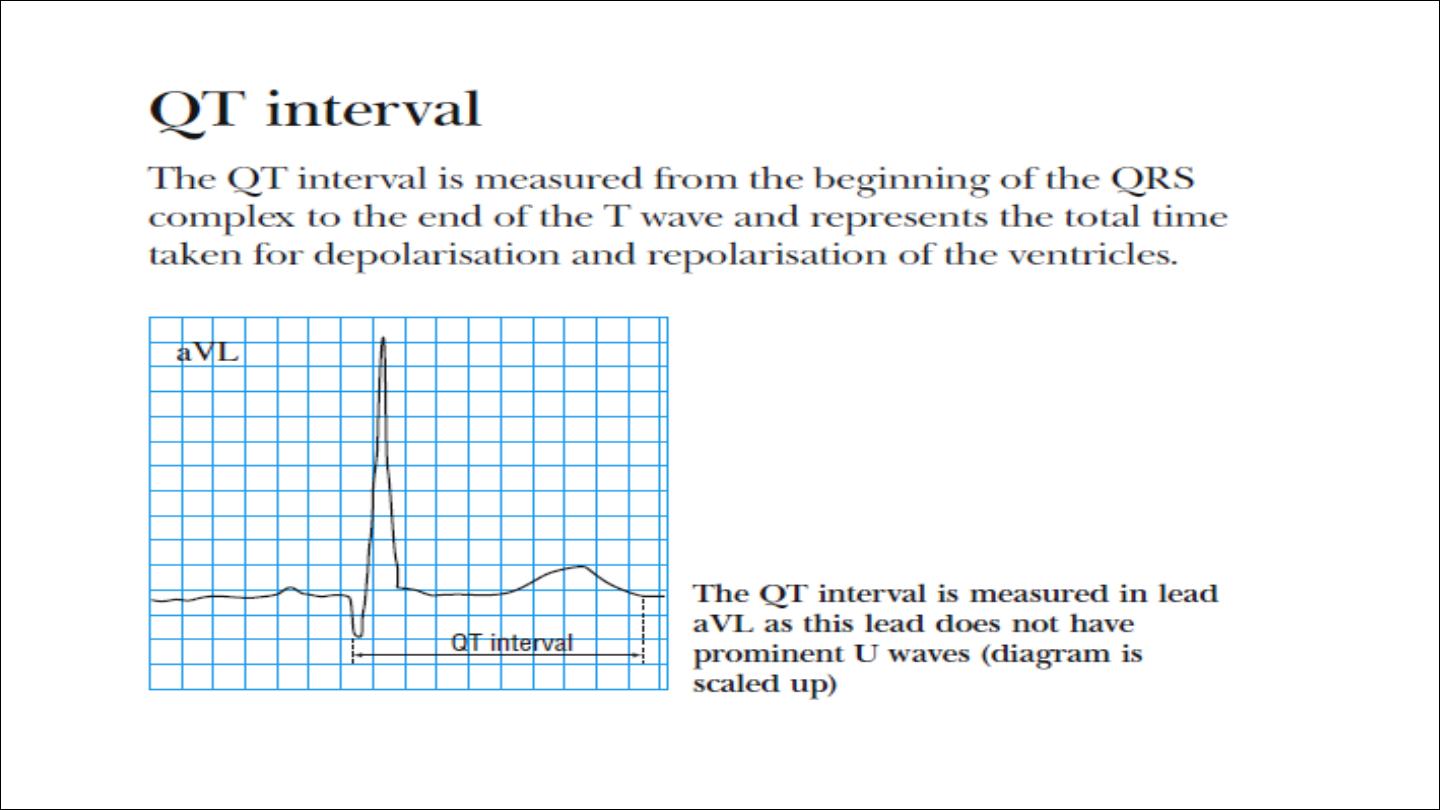
11. QT interval
12. U wave

Standardization
•
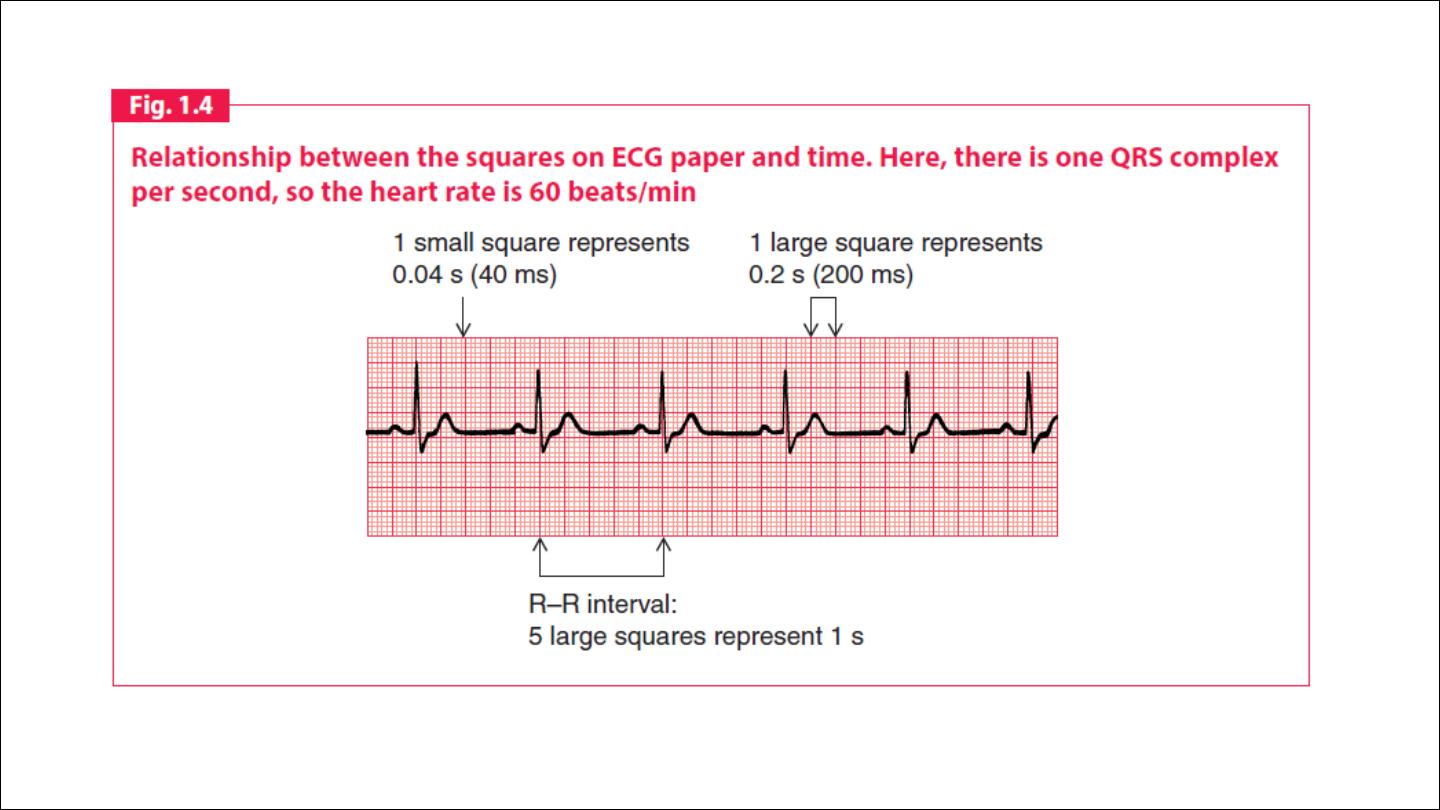
Speed :The electrocardiogram is recorded on to standard paper
travelling at a rate of 25 mm/s. The paper is divided into large
squares, each measuring 5 mm wide and equivalent to 0.2 s. Each
large square is five small squares in width, and each small square is 1
mm wide and equivalent to 0.04 s.
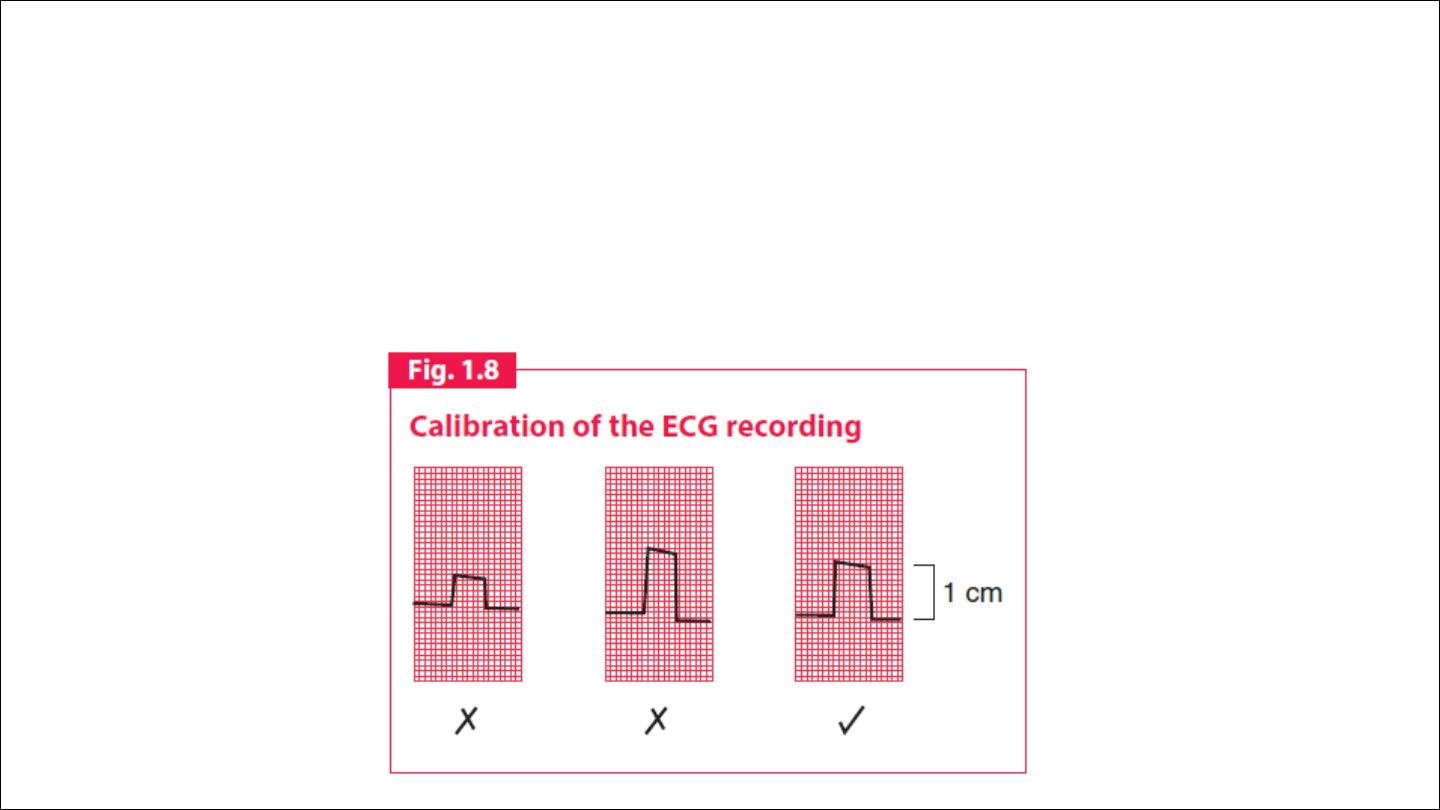
Calibration:The electrical activity detected by the electrocardiogram
machine is measured in millivolts. Machines are calibrated so that a
signal with an amplitude of 1 mV moves the recording stylus vertically 1
cm. Throughout this text, the amplitude of waveforms will be expressed
as: 0.1 mV = 1 mm = 1 small square.

Rate
1 minute = 60 seconds
1 second = 5 large squares= 25 small squares
1 minute= 300 large squares= 1500 small squares
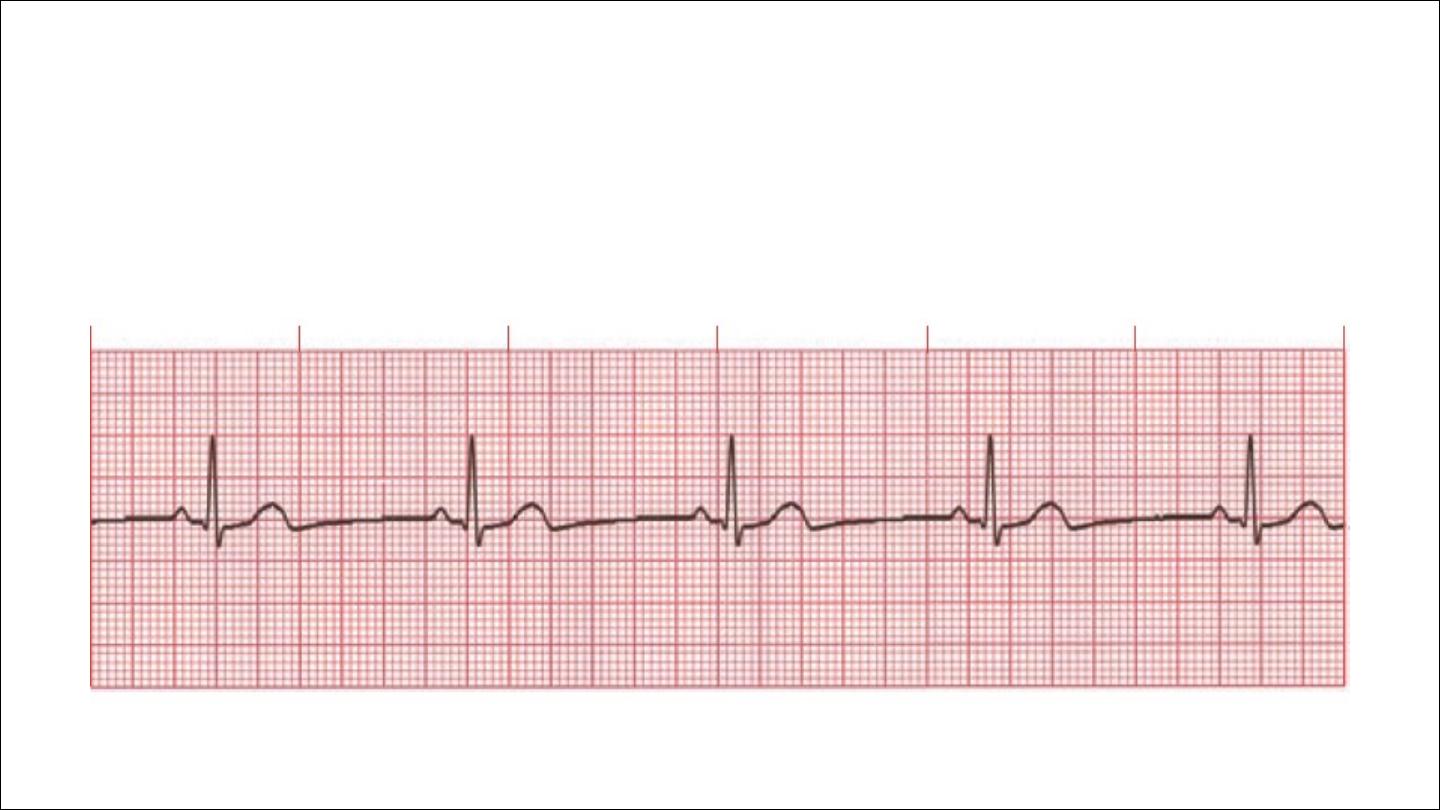
Regular HR
RATE = 1500/ No of large square between consequetive QRS
300/ No of large small between consequetive QRS
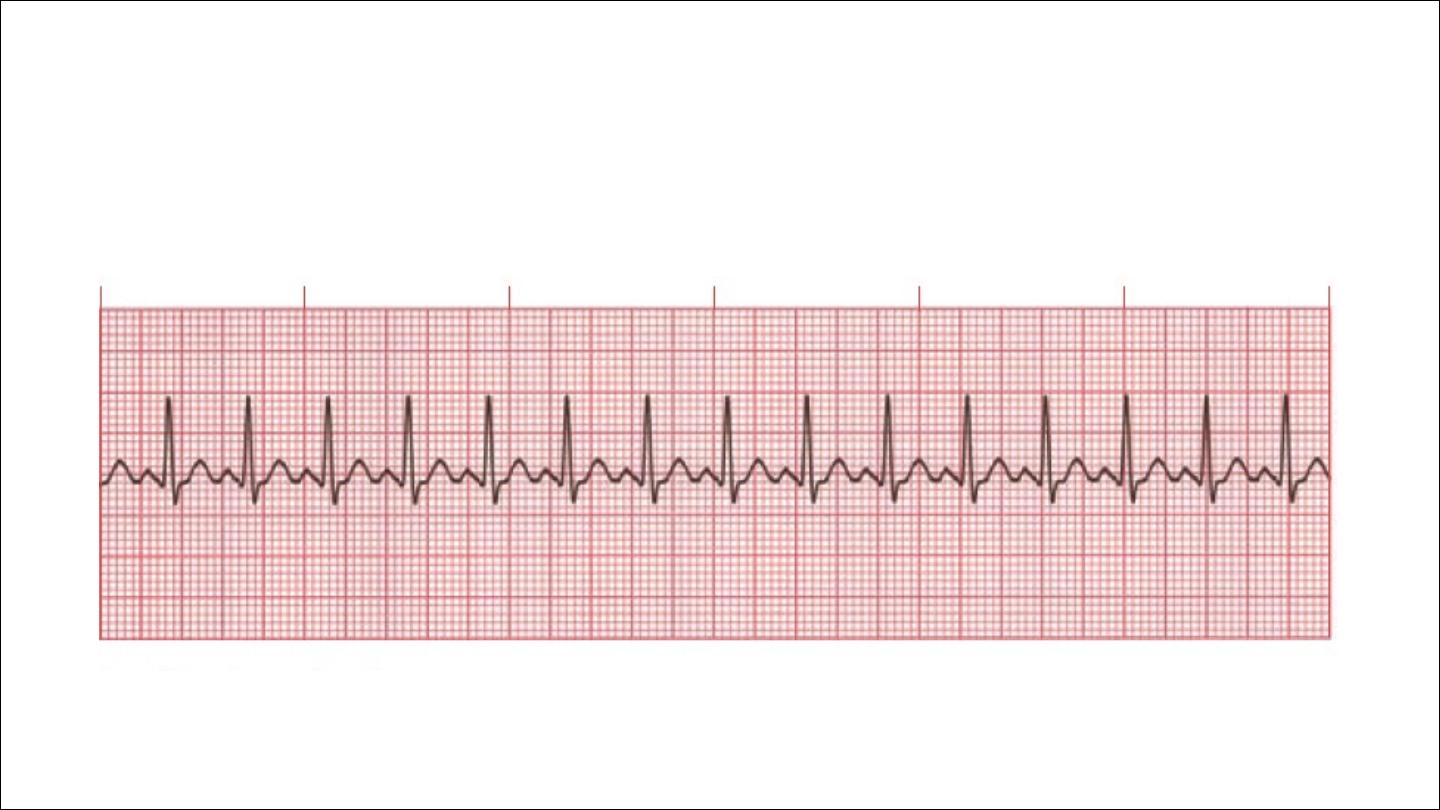
Irregular
HR = no of QRS in 15 large seqaure multiply by 20

•
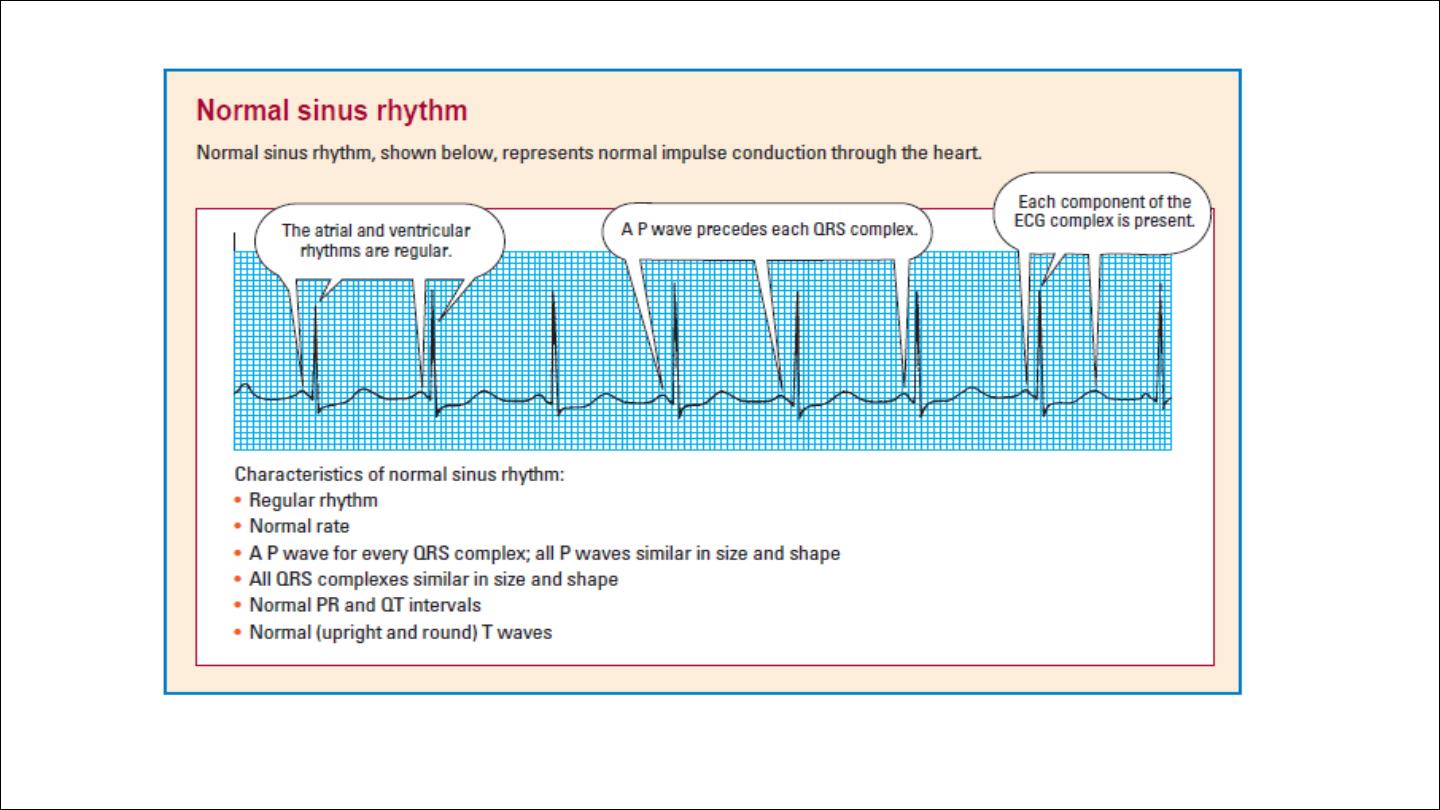
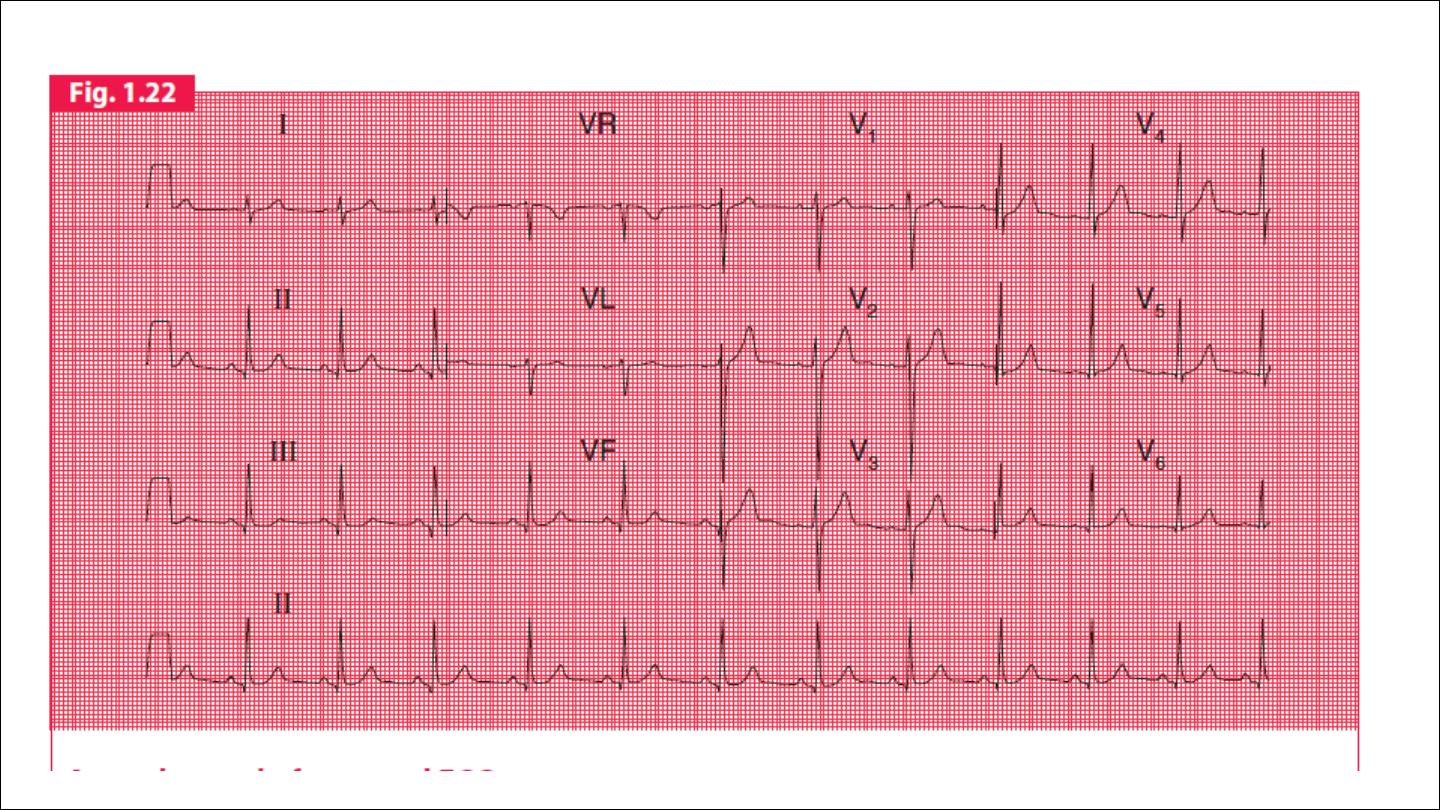
Rhythm
To assess the cardiac rhythm accurately, a prolonged recording from
one lead is used to provide a rhythm strip. Lead II, which usually gives a
good view of the P wave, is most commonly used to record the rhythm
strip.

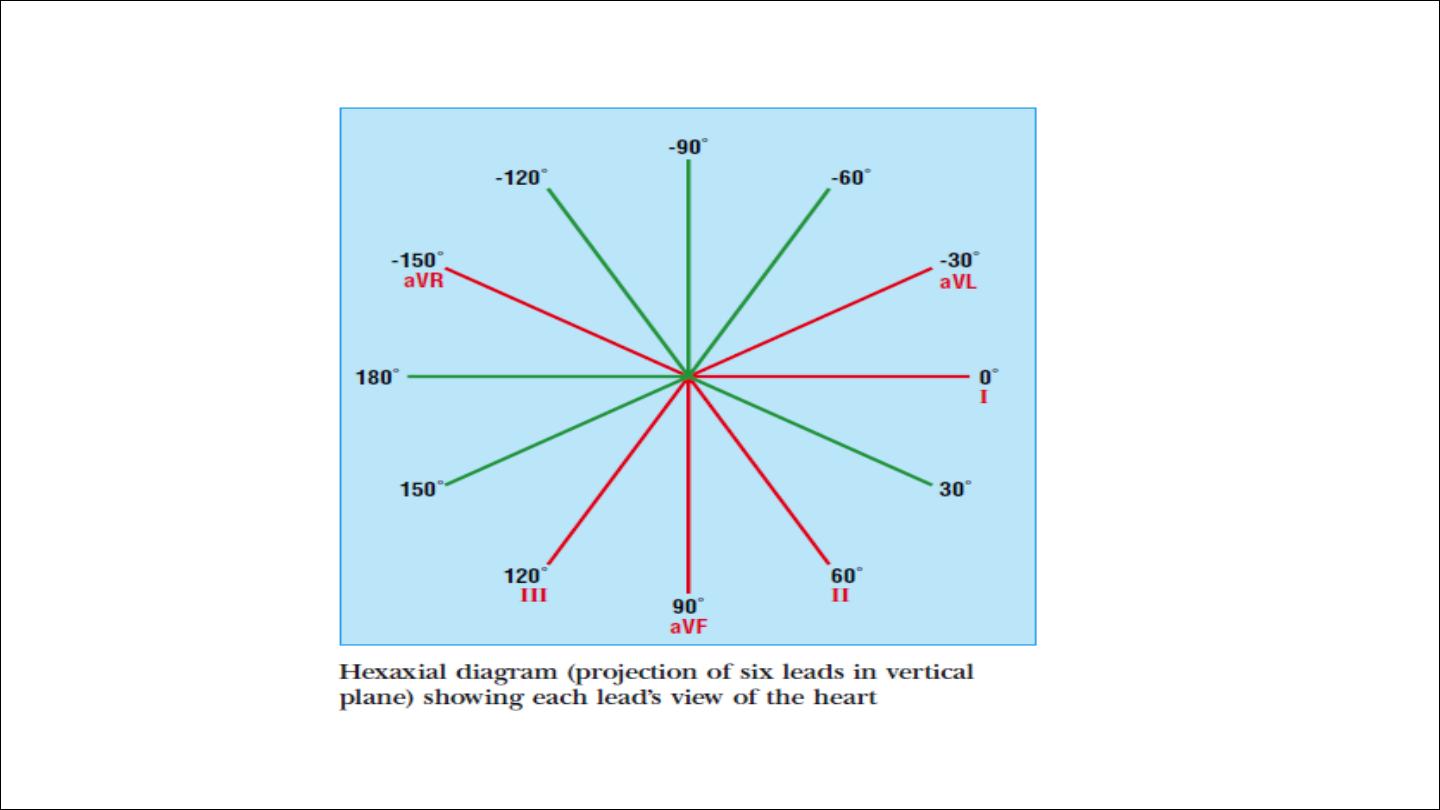
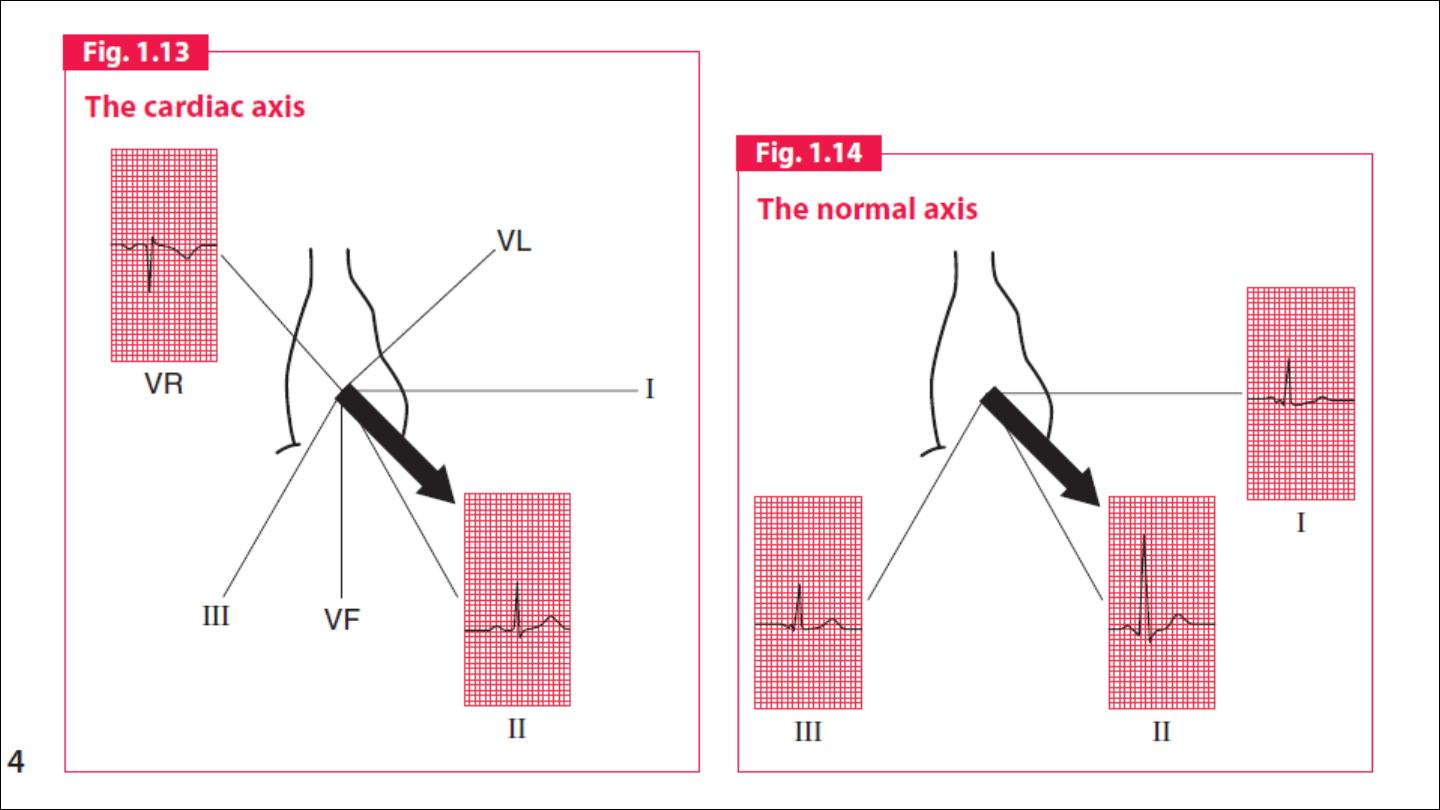
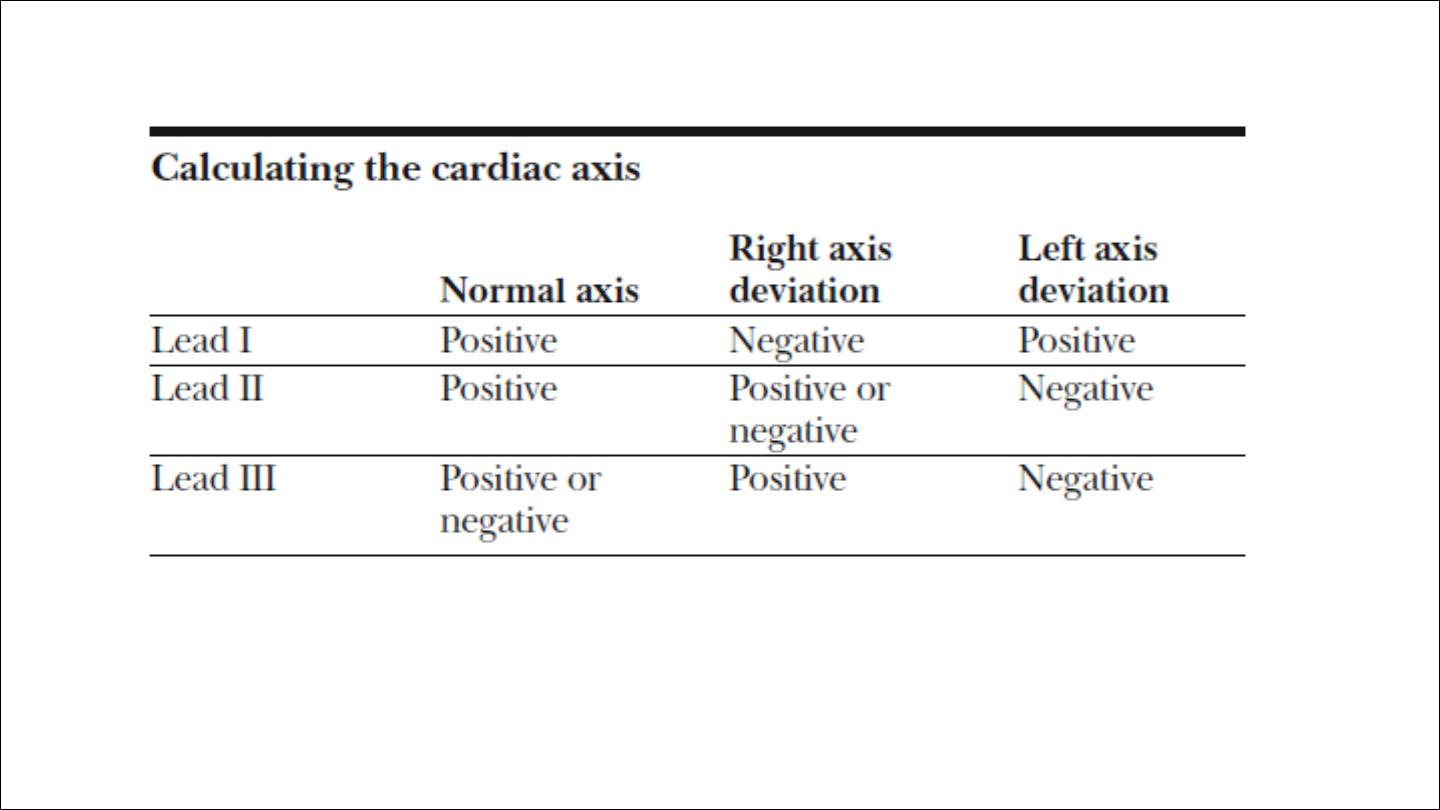
Cardiac axis:
The cardiac axis refers to the mean direction of the wave of ventricular
depolarisation in the vertical plane, measured from a zero reference
point
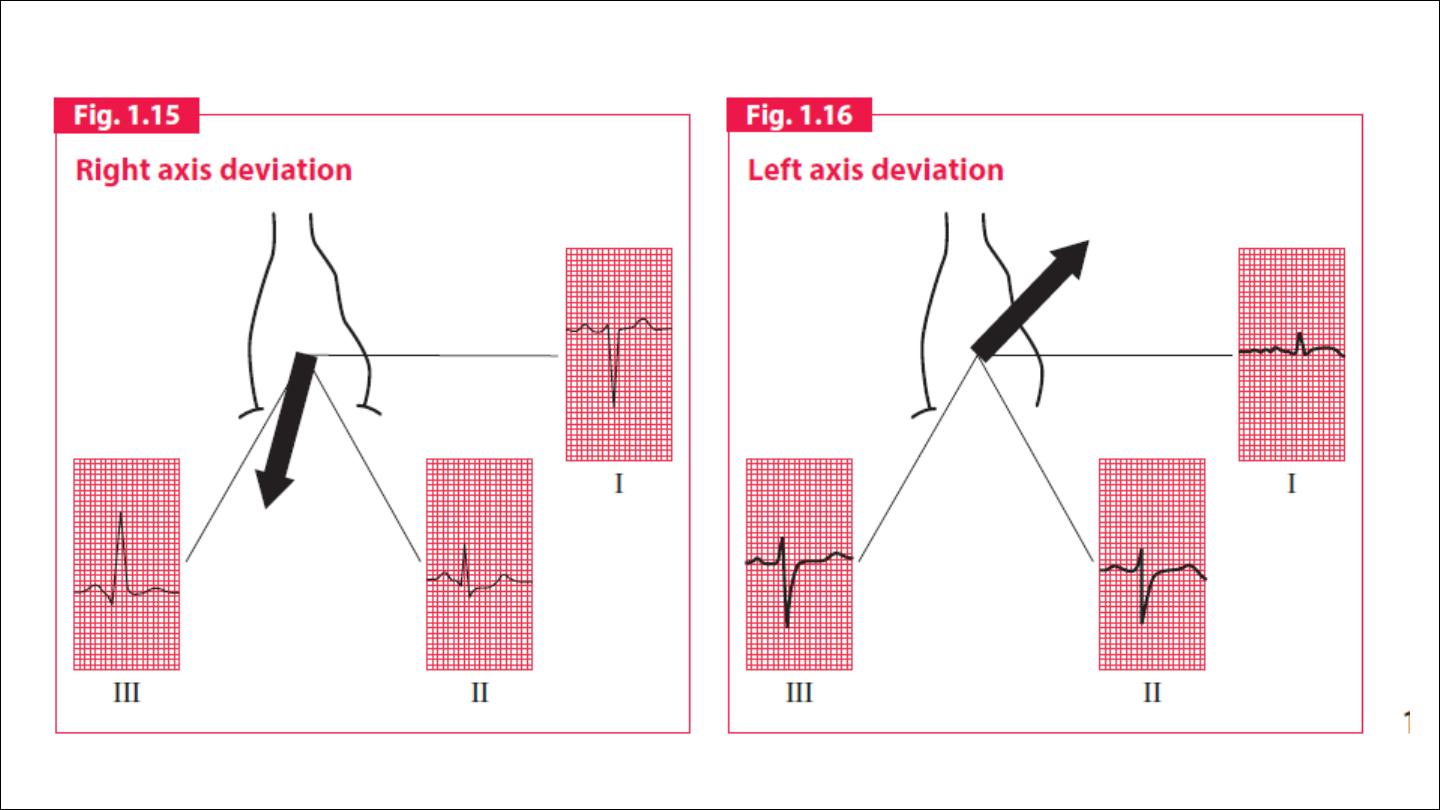
The normal range for the cardiac axis is between
− 30° and 90°.
An axis
lying beyond − 30° is termed left axis deviation, whereas an axis > 90° is
termed right axis deviation.
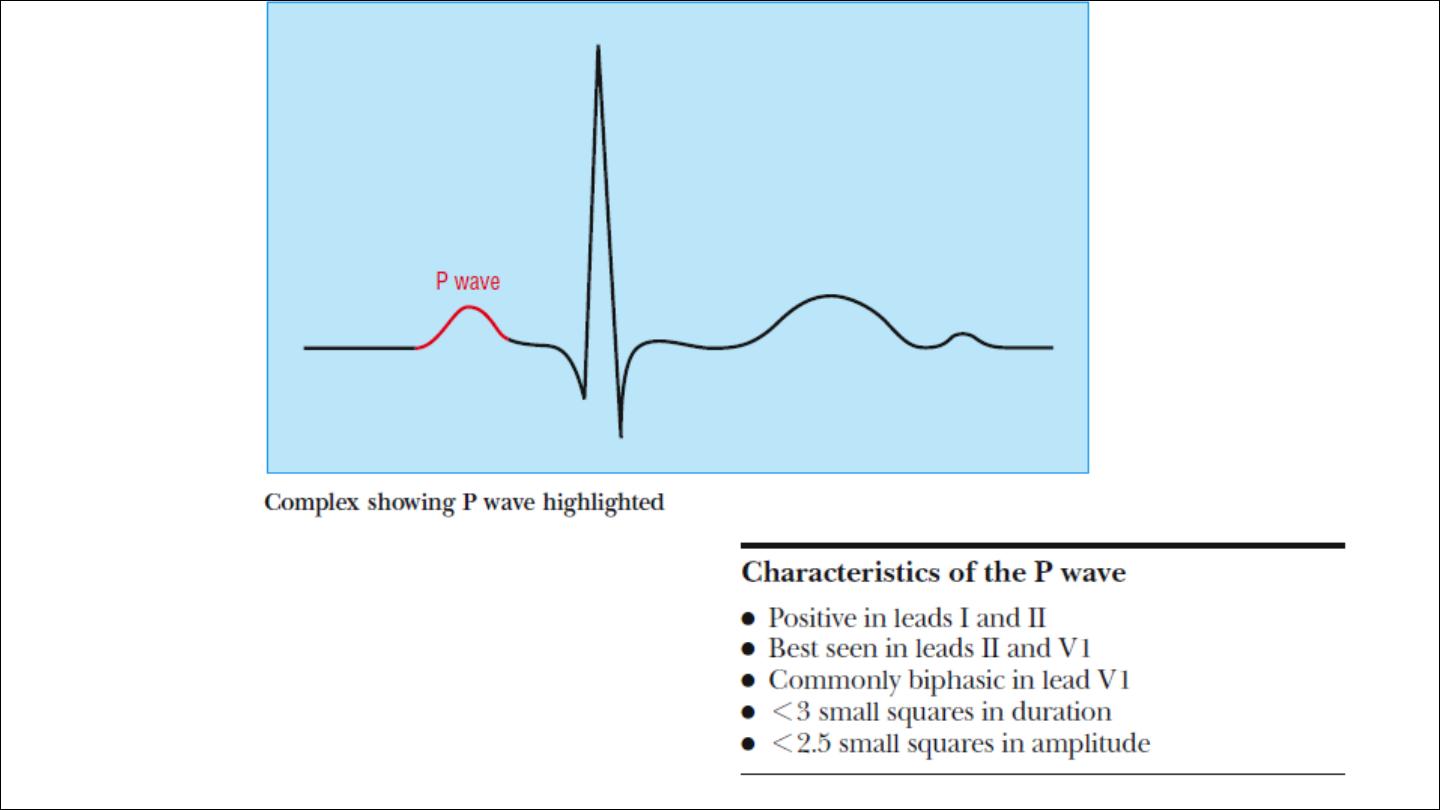
P wave

Abnormalities in p wave
Absent (atrial fibrillation)
P mitrale , bifid more than 3 mm duration, 2 peak more than 1 mm
apart ( ECG marker of LA dilatation)
P pulmonale ; tall P wave more than 2.5 mm ( ECG marker of RA
dilatation)
•
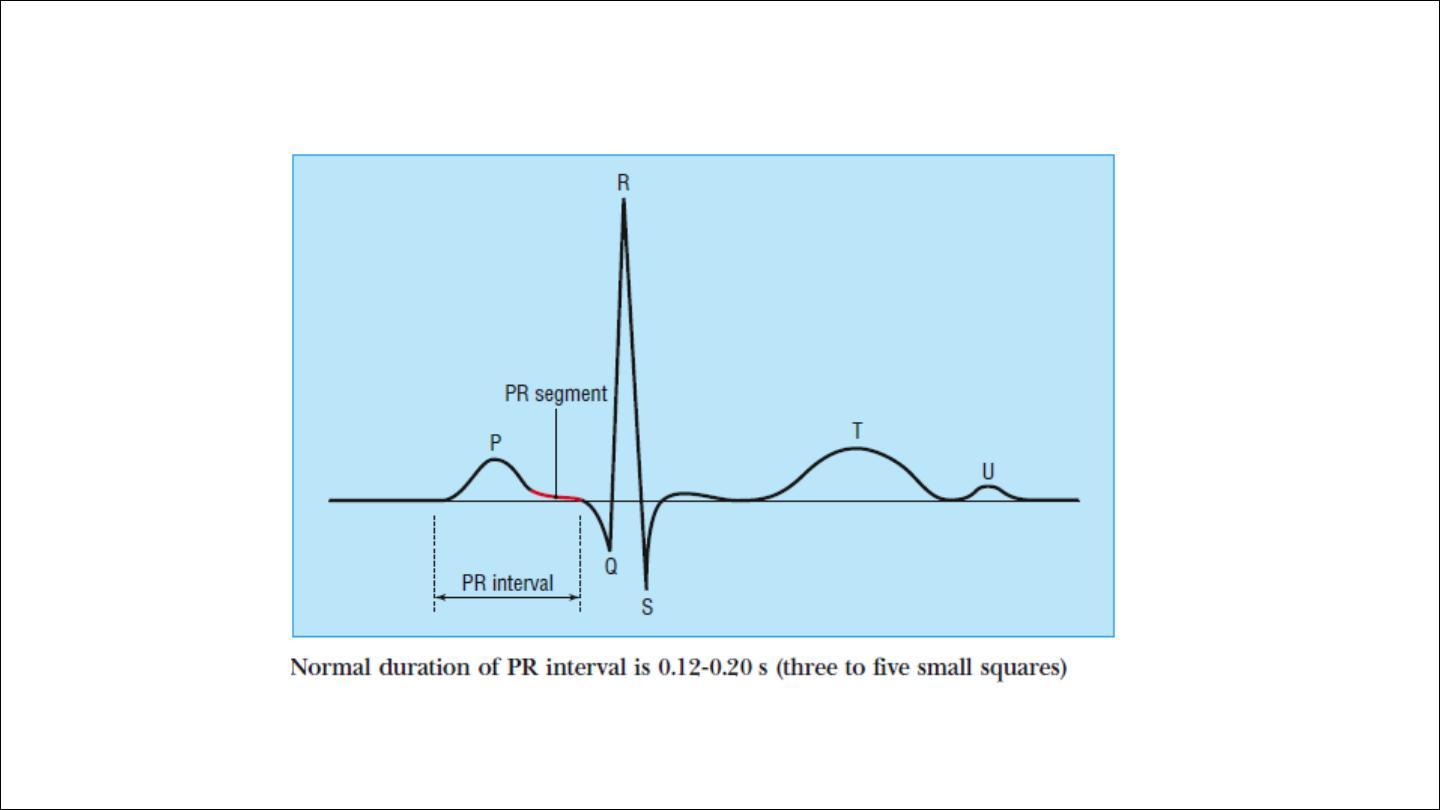
PR interval: normally 120 to 200 msec, 3 to 5 small squares.
Short PR
LONG PR
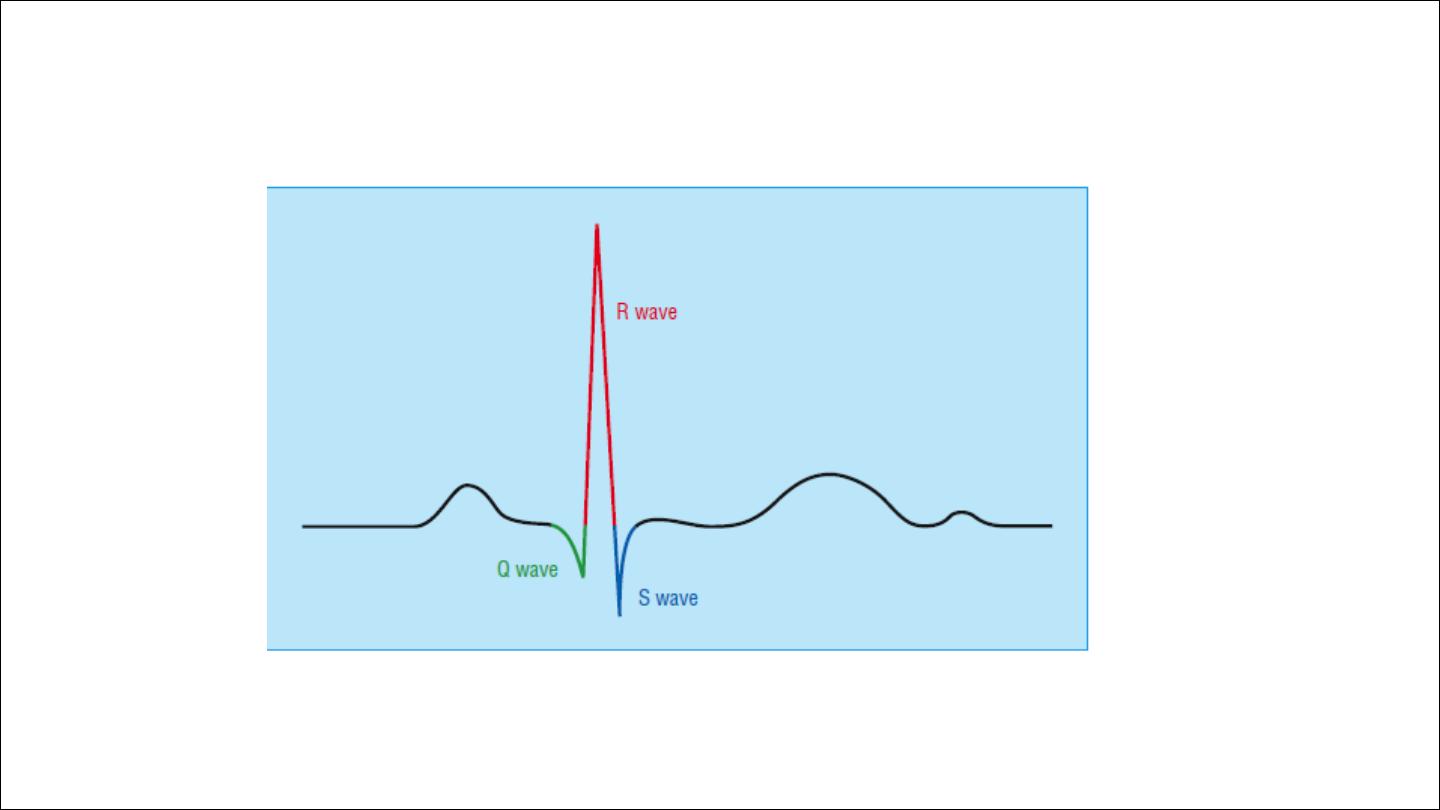
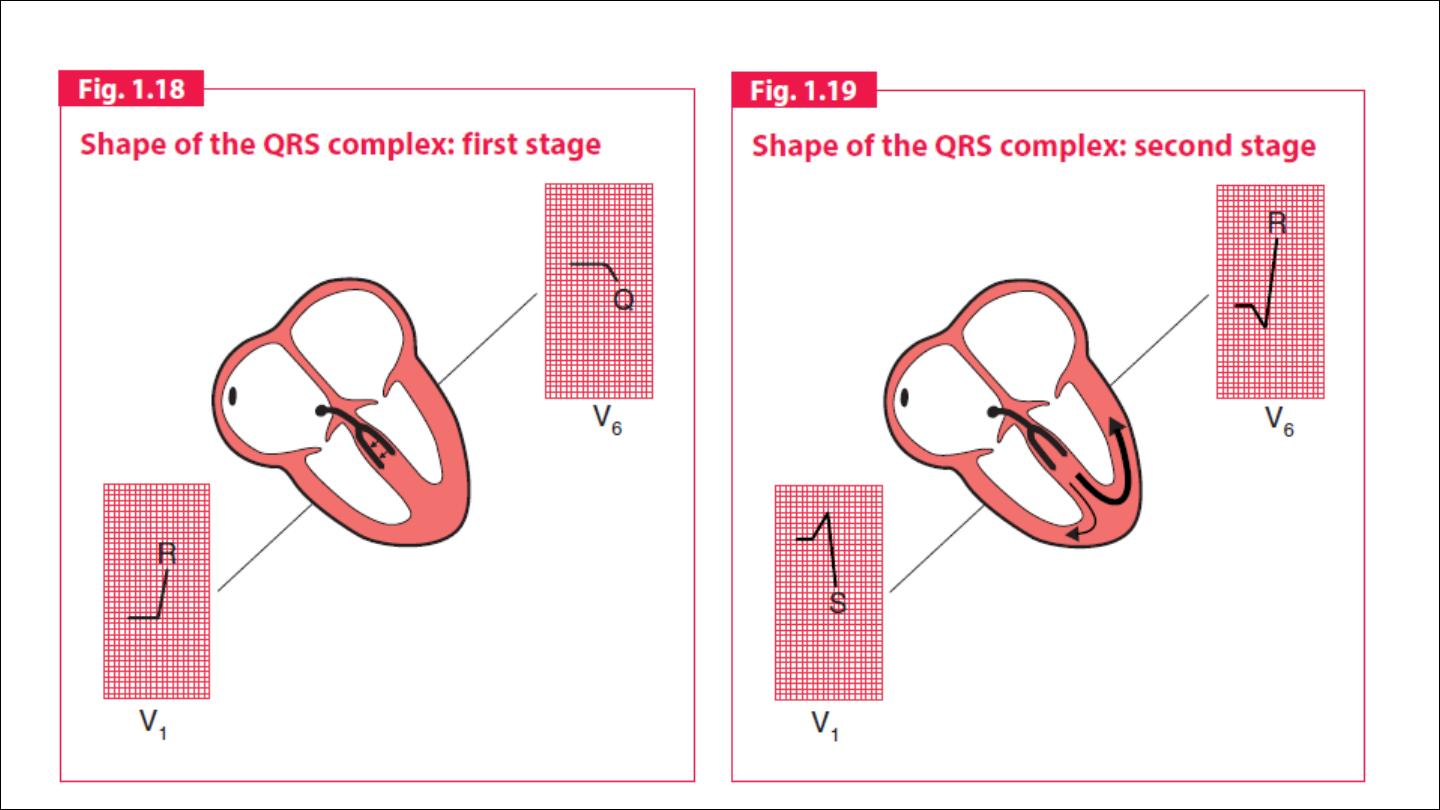
QRS complex

The shape of the QRS complex in the chest (V) leads is determined by
two things:
1. The septum between the ventricles is depolarized before the walls of
the ventricles, and the depolarization wave spreads across the septum
from left to right.
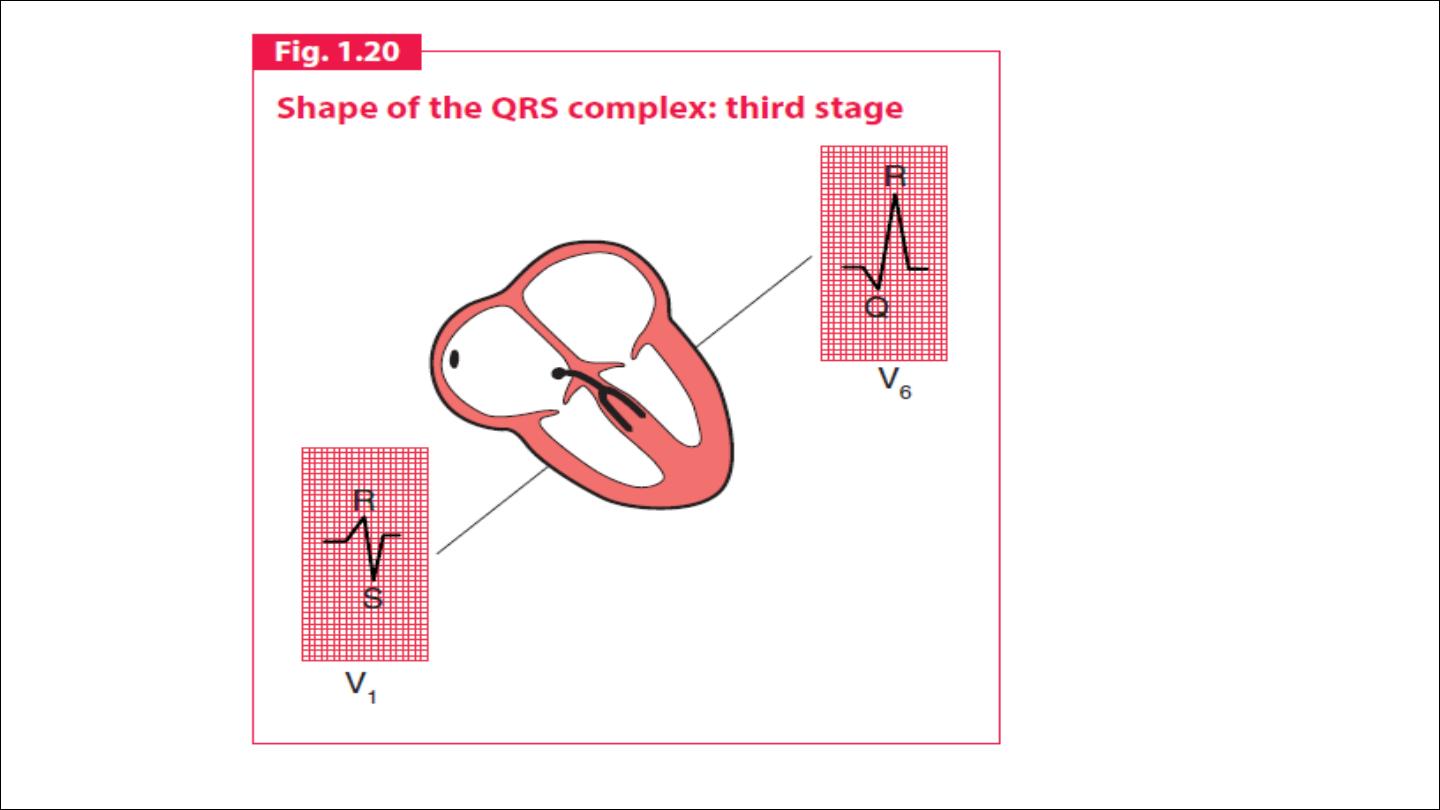
2. In the normal heart there is more muscle in the wall of the left
ventricle than in that of the right ventricle, and so the left ventricle
exerts more influence on the ECG pattern than does the right ventricle.
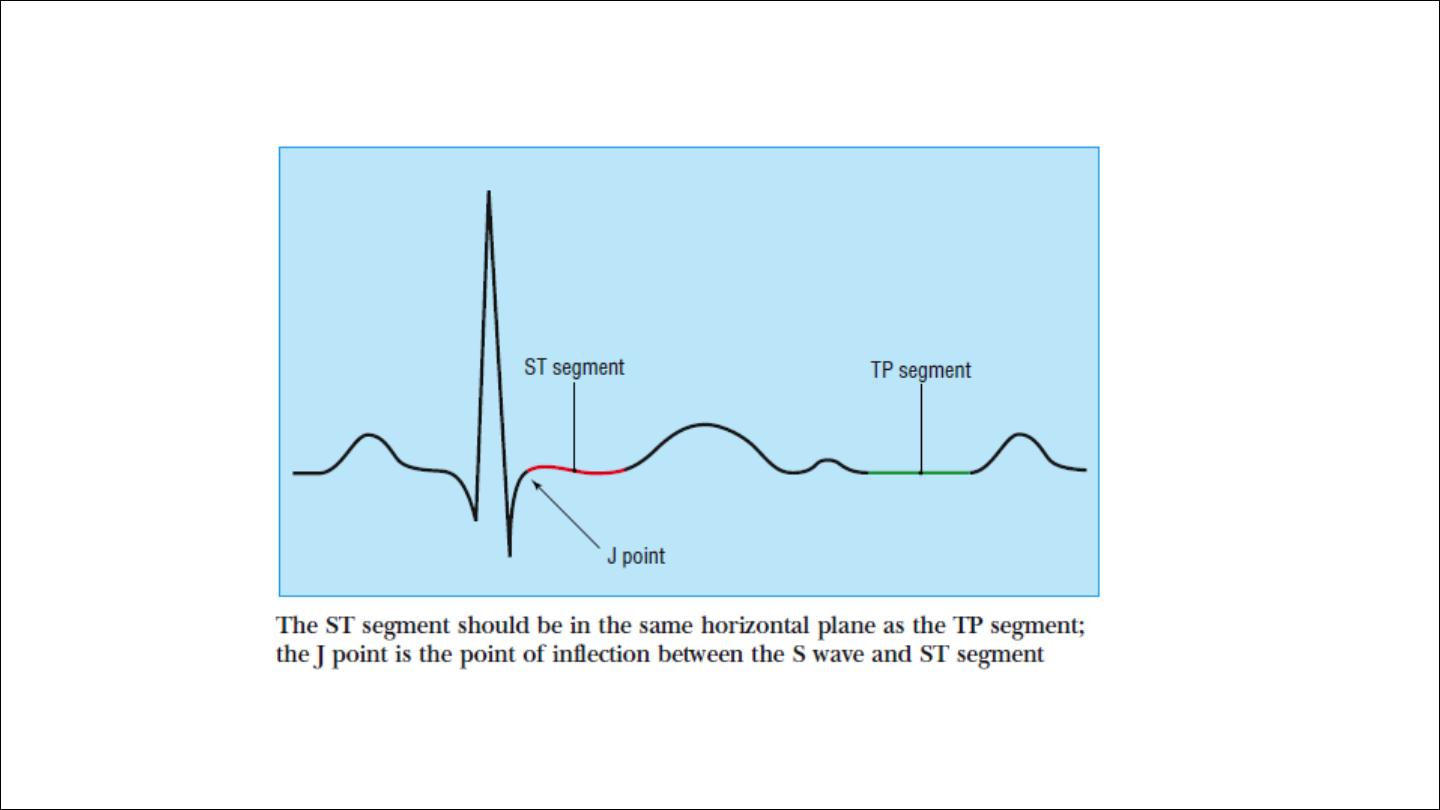

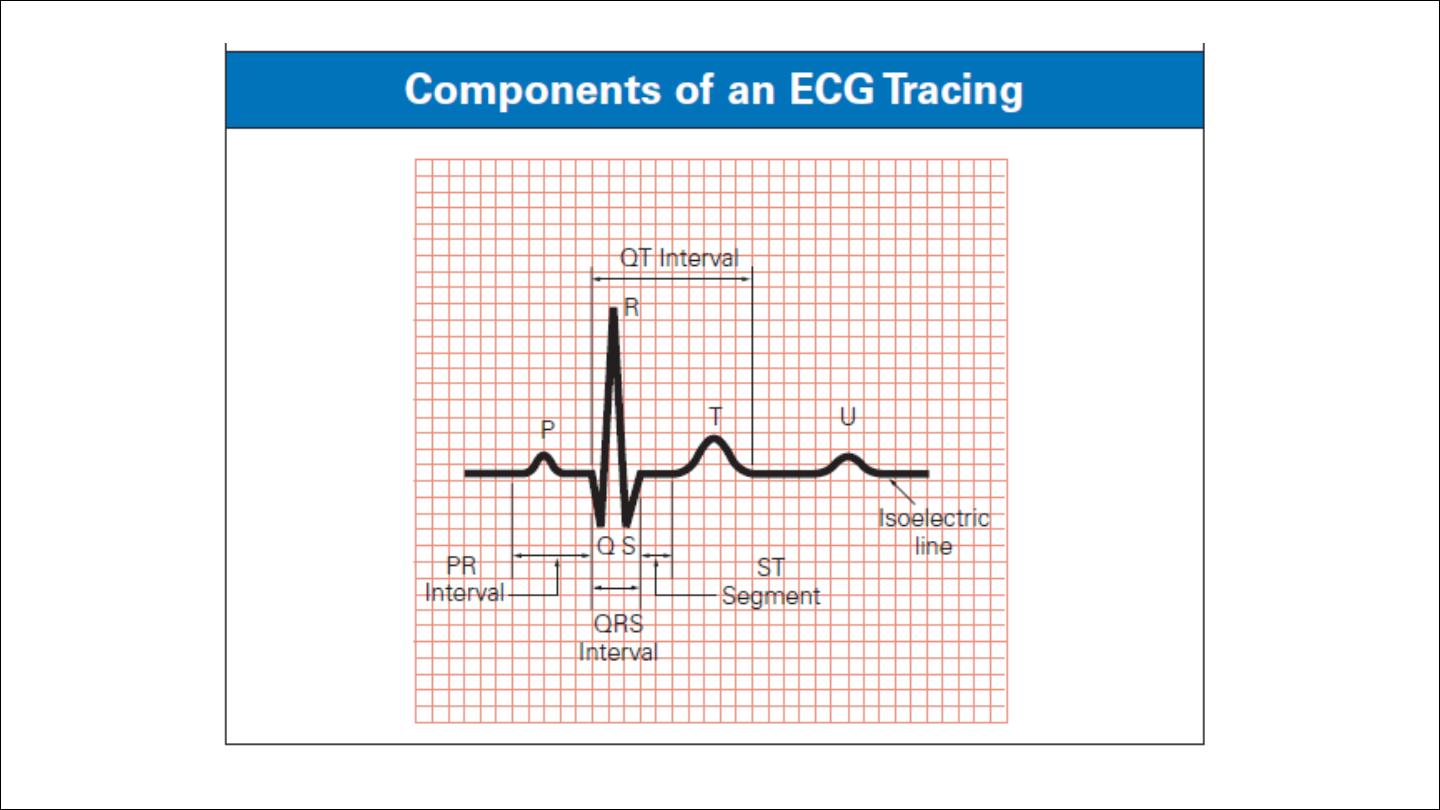
The ST segment should be level with the subsequent “TP segment” and
is normally fairly flat, though it may slope upwards slightly before
merging with the T wave.
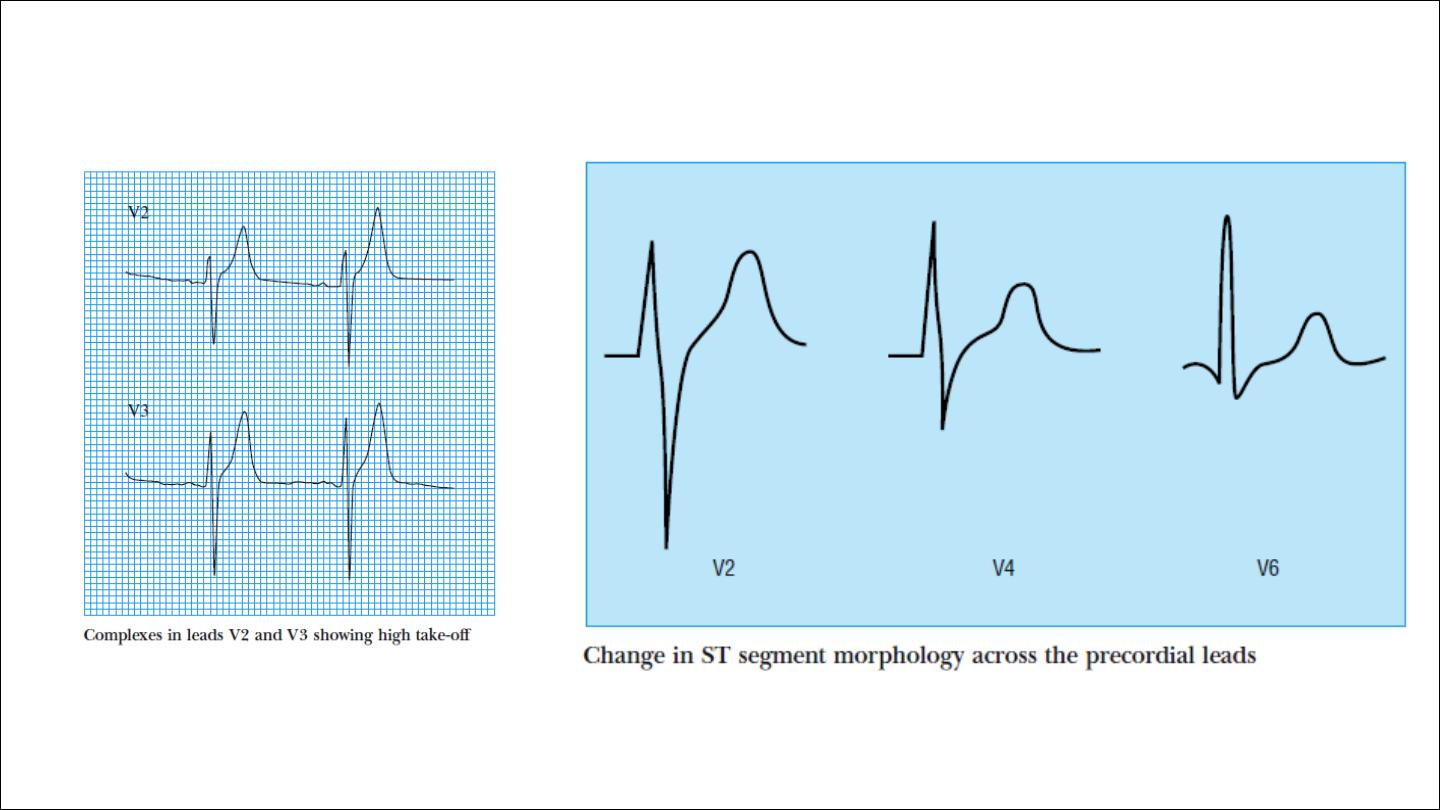
In leads V1 to V3 the rapidly ascending S wave merges directly with the
T wave, making the J point indistinct and the ST segment difficult to
identify. This produces elevation of the ST segment, and this is known as
“high take-off.”
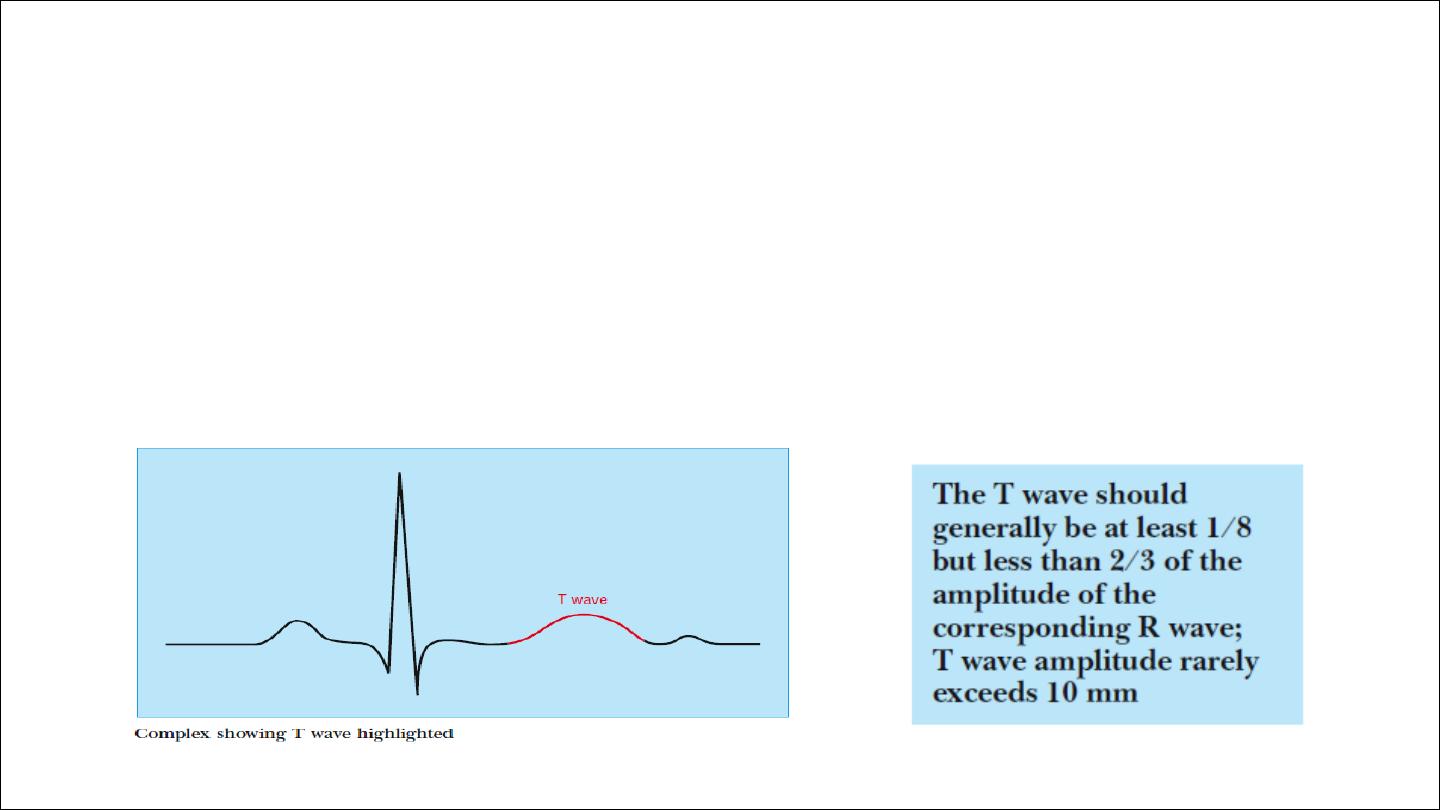
T wave
•
T wave correspond with QRS, and thus is inverted in lead aVR, and
may be inverted in lead III. T wave inversion in lead V1 is also
common.
•
Tall T waves may be seen in acute myocardial ischaemia and are a
feature of hyperkalaemia.

•
AVR should be negative ?????