
1
What is GIS?
• A technology
– hardware & software tools
• An information handling strategy
• The objective: to improve overall decision
making

2
GIS: a formal definition
“A system for capturing, storing, checking,
integrating, manipulating, analysing and
displaying data which are spatially
referenced to the Earth. This is normally
considered to involve a spatially referenced
computer database and appropriate
applications software”

3
Why is GIS unique?
• GIS handles SPATIAL information
– Information referenced by its location in space
• GIS makes connections between activities
based on spatial proximity
4
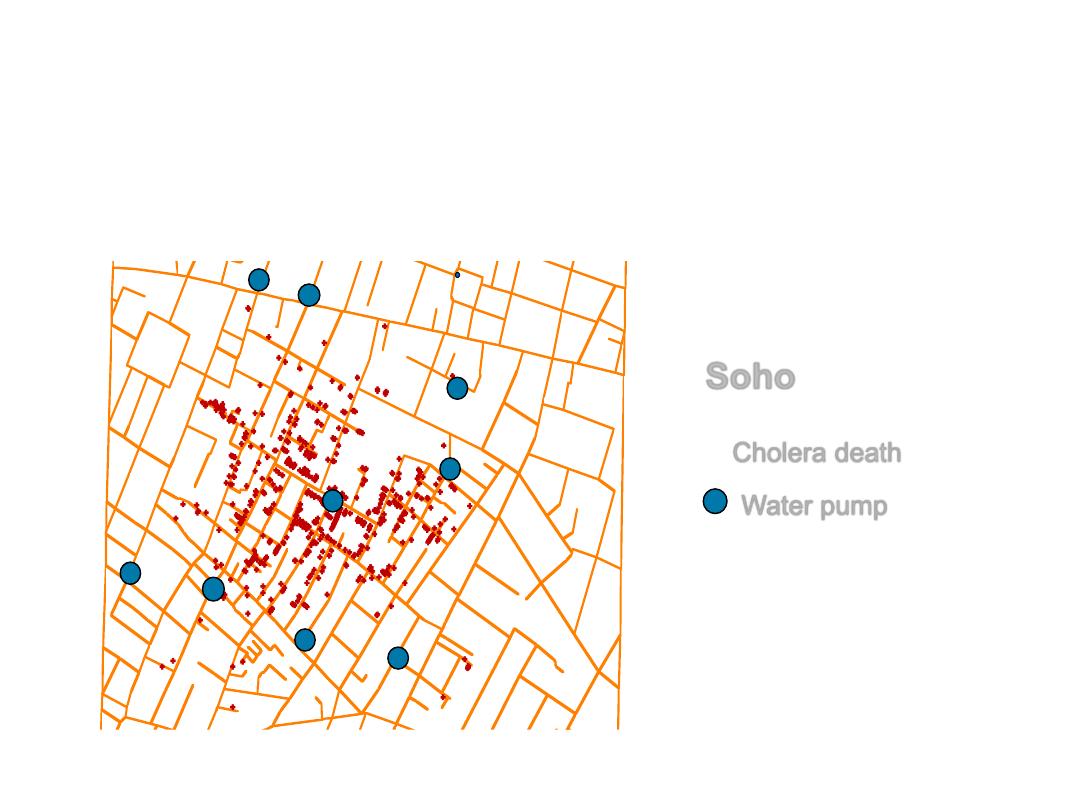
GIS concepts are not new!
• London cholera epidemic 1854
Cholera death
Water pump
Soho
+
Digital
Mapping
Photo-
grammetry
Computer
Aided
Design
Surveying
Remote
Sensing
Databases
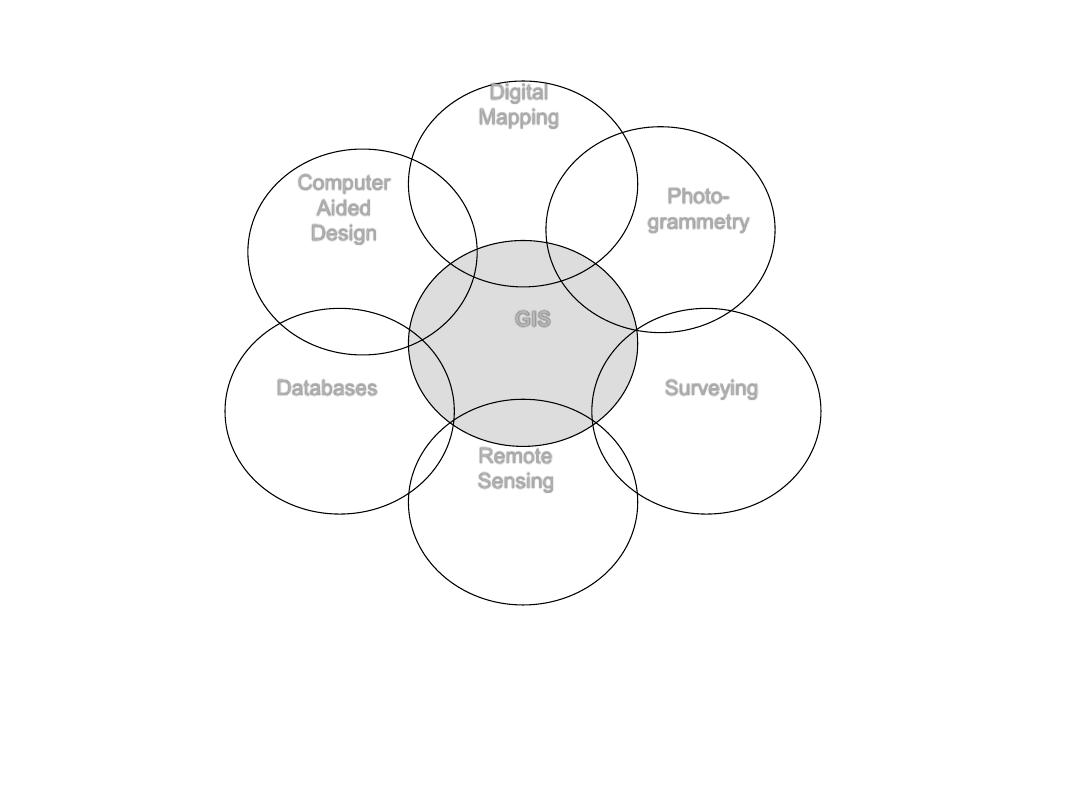
GIS
Cross-disciplinary nature of GIS
6
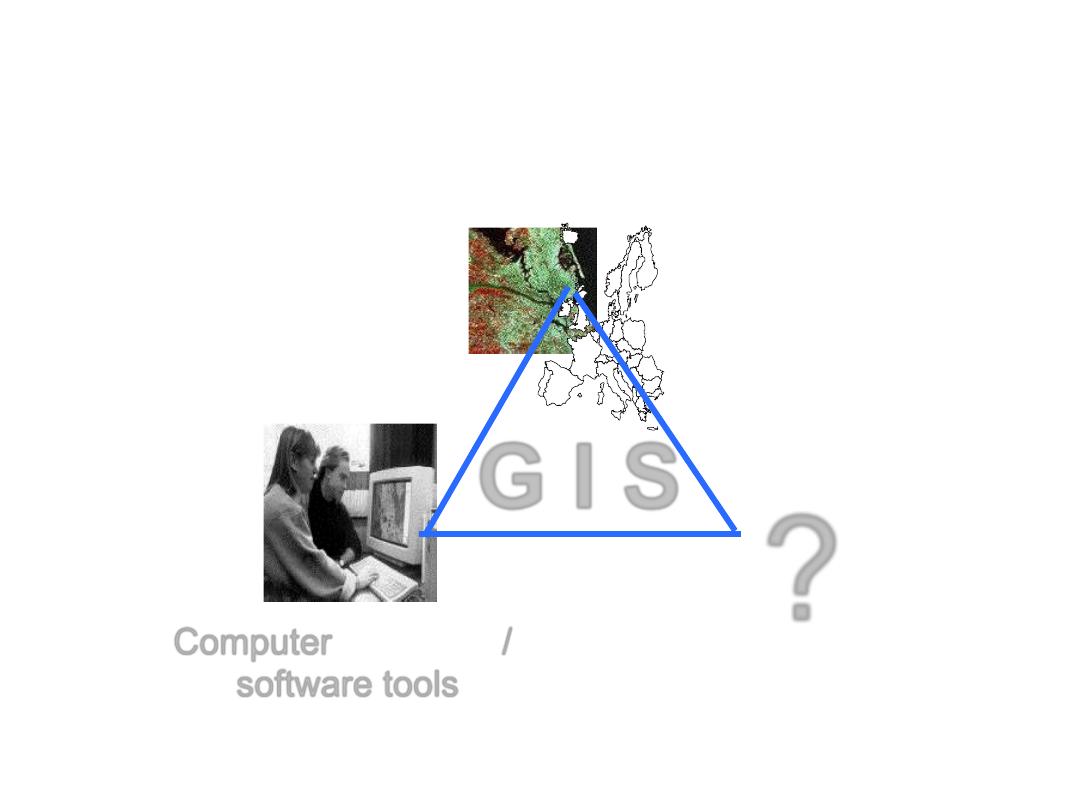
GIS components
Specific applications /
decision making objectives
?
G I S
Spatial
data
Computer hardware /
software tools

7
Characteristics of spatial data
• Location
• Description:
Kingston University,PenrhynRoad Centre
• Post Code:
KT1 2EE
• Grid Reference:
518106.72 168530.37
• Latitude/Longitude: 0° 21’ 55.38”W, 49° 36’ 17.62”N
8
Characteristics of spatial data
Geometry
• The shape of a
building or county
• The course of a river,
the route of a road
• The shape of the
landscape, relief

9
Spatial Data: examples
• Socio-economic data
– Regional health data
– Consumer / lifestyle profiles
– Geodemographics
• Environmental data
– Topographic data
– Thematic data, soils, geology
10
Data Modelling - step 1
• Features
– Buildings
– Road centrelines
– Lamp columns
– Gas pipes
– CTV Access covers
– Road surfaces
11
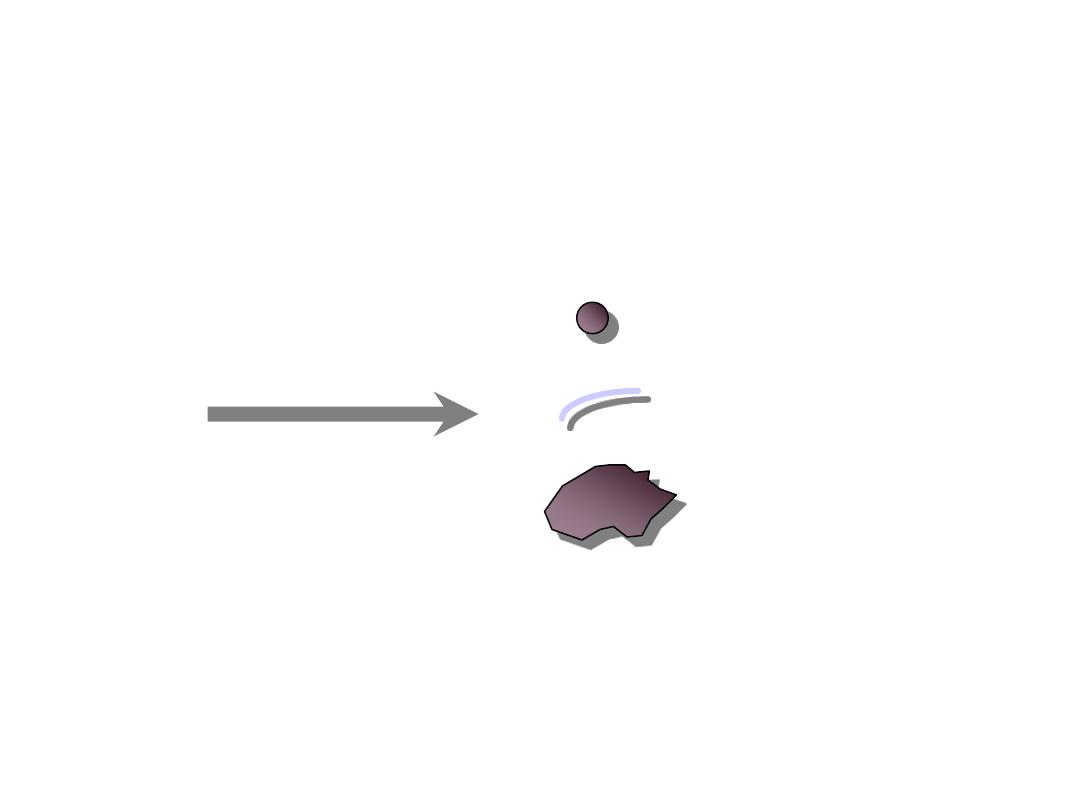
Data Modelling - step 2
Point
Line
Polygon
12
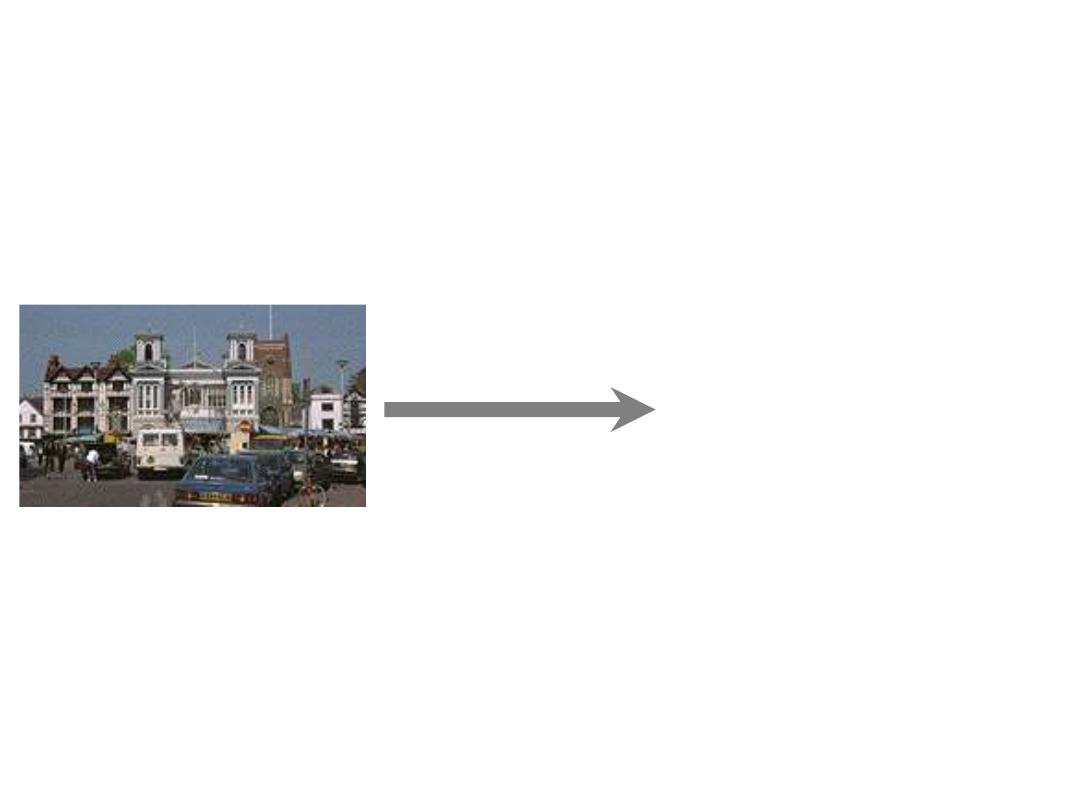
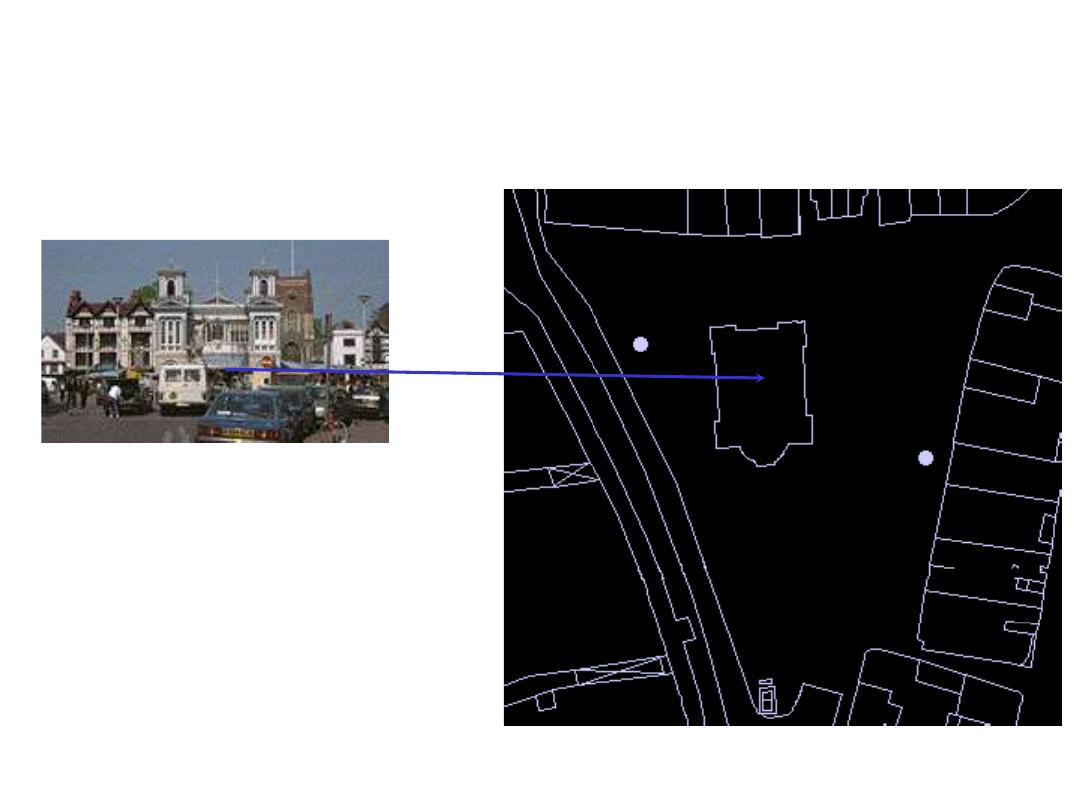
Data Modelling - step 3
Feature :
Building
Object:
Polygon
Entity:
Tourist
Information
Bureau

13
Attributes
Name :
Next
Address:
5 Market Place
Town:
Kingston
Owner:
Ms J Shore
Tel. No:
0181 547 1245
Floor space
1300 sq m
14
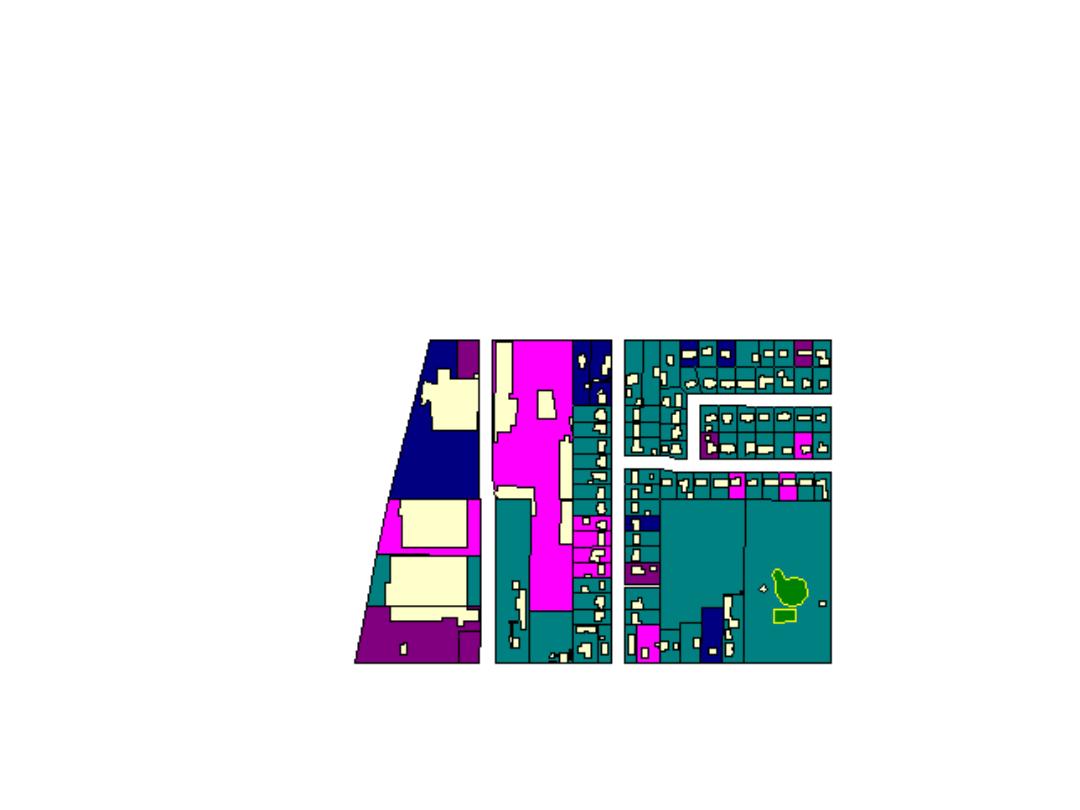
Vector data
Land use parcels
15
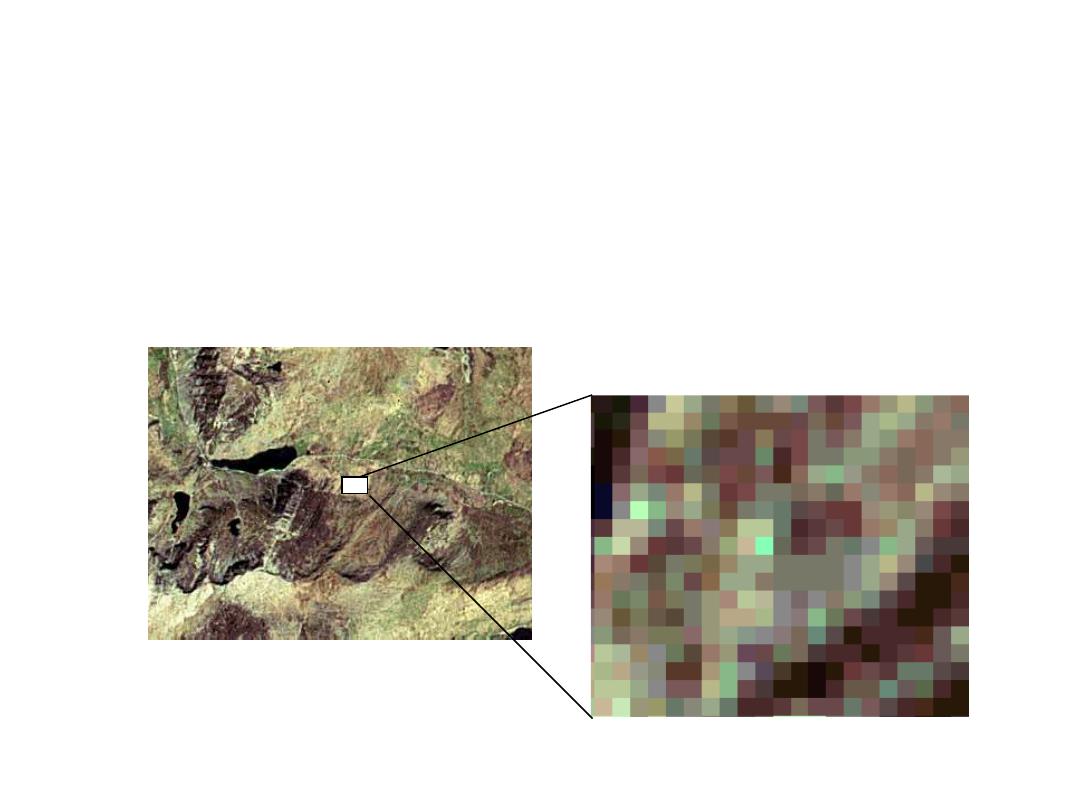
Raster data

16
Manipulation and analysis
• What would happen if . . .
A chemical leaked into a river?
• Where does . . .
The Green Belt exist in relation to the City?
• Has . . .
Population changed over the last ten years?
• Is there a spatial pattern related to . . .
Car ownership in our area?
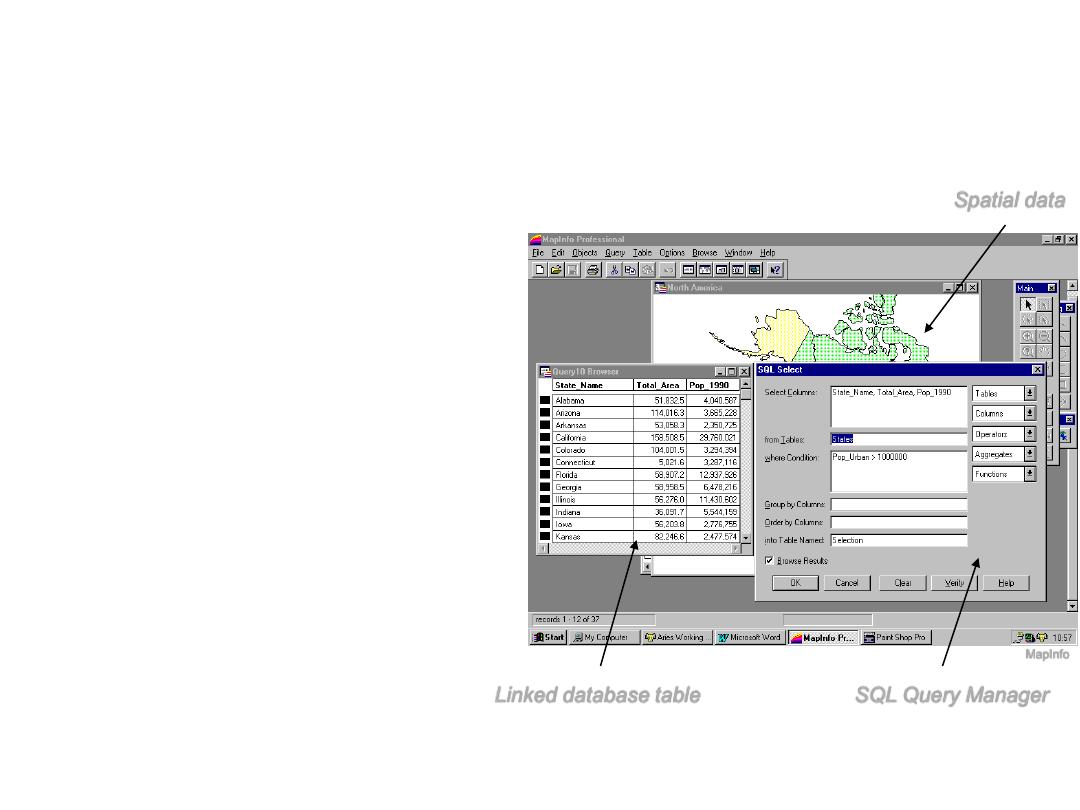
Databases & GIS
• At a simple level a
GIS may just form
the graphical
interface to a
database
• The majority of GIS
applications follow
this example
Linked database table
Spatial data
SQL Query Manager
MapInfo

Geo-relational Data Models
• Linked tables based on the relational model,
but storing geographical information such as:
– Geometry
– Topology
– Attributes

GIS & Analysis
In the context of GIS, analysis is...
“Deriving new information from existing data”
It is also the manipulation of data to solve a problem
e.g. identify all areas within 500m of a lake
Increasing use is made of the analytical capabilities of GIS, BUT
many GIS projects only use the software to store and manage
geographical data
Yet analysis often relies on many simple basic GIS techniques
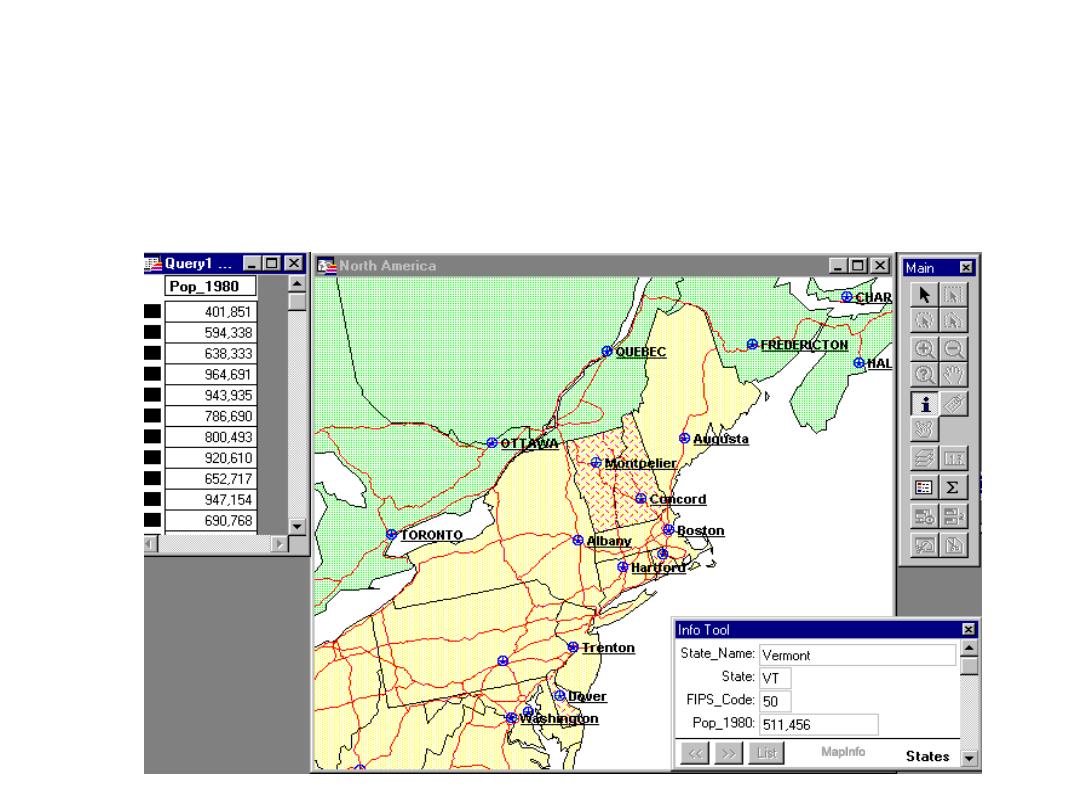
Simple Query
• The identification of objects and their attributes
either by location or attribute query.
MapInfo
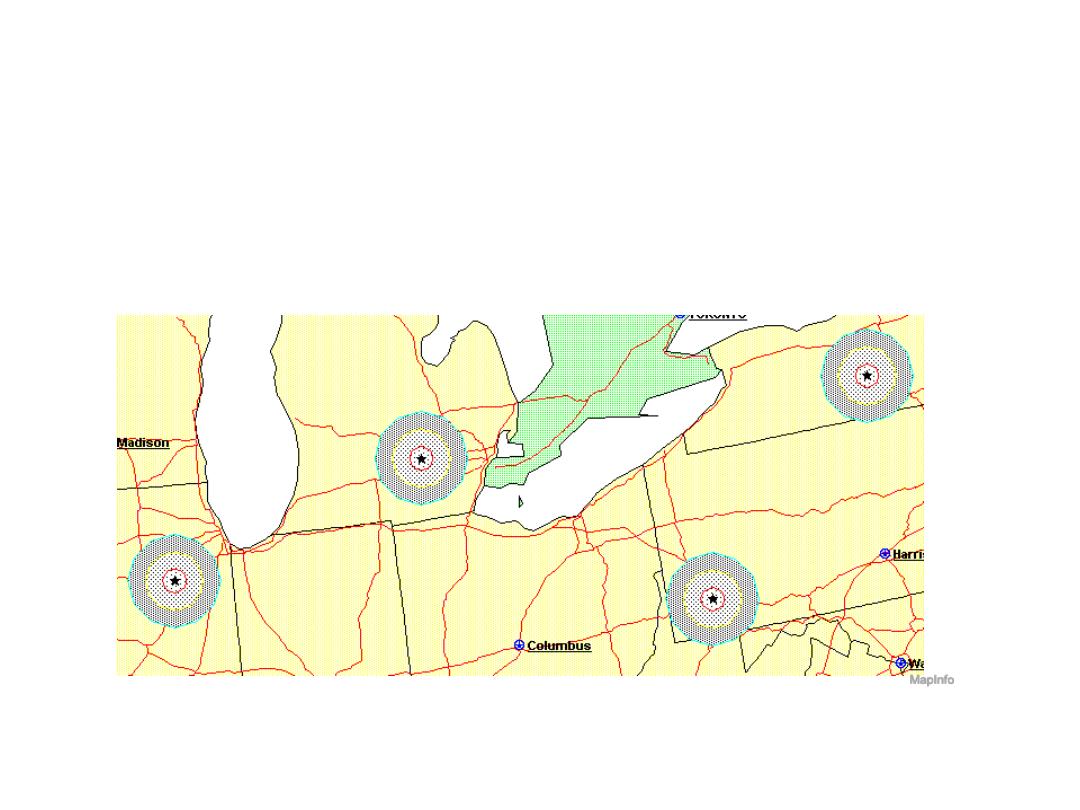
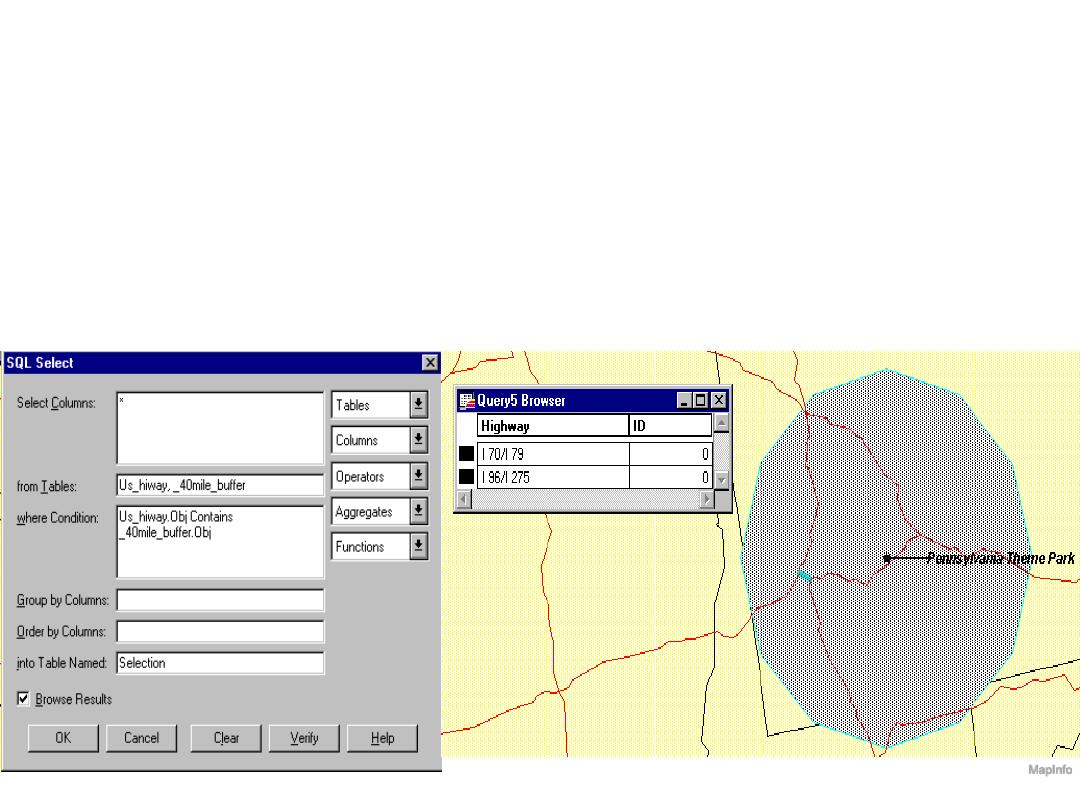
Buffering
• Creation of an area of interest around an object
– proximity analysis and environmental impact assessment.
MapInfo
Cookie Cutting
• Overlay of datasets using one dataset as a sieve or
cookie cutter to select a subset of the other dataset.
MapInfo

Overlays
• Layer: A thematic plane of GIS features containing
geographically and logically related data
• Overlaying involves superimposing two or more map layers to produce
a new map layer.
•
Example: a new genetically engineered variety of wheat grows well in dry
environments, with long growing seasons and alkaline soils. Given the
availability of data on the length of the growing season, moisture regime and
soil alkalinity, where is the best place to plant the wheat?
– overlaying (superimposing) several maps showing (separately) water-budget,
growing season length, soil pH, sodium content, and so on. The GIS analysis can
establish the locations where all the favorable soil conditions coincide, as the places
where the wheat will grow best.

26
The benefits of GIS include:
• Better information management
• Higher quality analysis
• Ability to carry out “what if?” scenarios
• Improve project efficiency

27
GIS Applications
• Facilities management
• Marketing and retailing
• Environmental
• Transport/vehicle routing
• Health
• Insurance
and many more . . .