Growth and development
Growth: refers to an increase in physical size of the whole body or any of its parts. It is simply a quantitative change in the child’s body. It can be measured in Kg, pounds, meters, inches, etc.
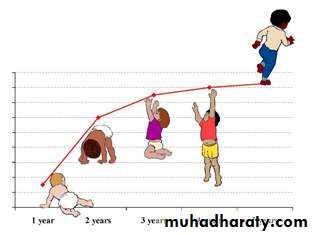
Development: refers to a progressive increase in skill and capacity of function. It is a qualitative change in the child’s functioning.It can be measured through observation.
All who care for children must be familiar with normal patterns of growth and development so that they can recognize and manage abnormal variations.
The genetic, the physical, emotional, and social environment of the individual determine how a child grows and develops through childhood.
One goal of pediatrics is to help each child achieve his or her individual potential for growth and development. Periodically monitoring each child for the normal progression of growth and development and screening for abnormalities are important means of accomplishing this goal.
The AAP recommends routine office visits in the first week of life (depending on nursery discharge); at 2 weeks; at 2, 4, 6, 9, 12, 15, and 18 months; at 2, 2 1/2 , and 3 years; and then annually through adolescence/young adulthood
Stages of Growth and Development
InfancyNeonate (Birth to 1 month)
Infancy (1 month to 1 year)
Early Childhood
Toddler (1-3 years)
Preschool (3-6 years)
Middle Childhood
School age
6 to 12 years
Late Childhood
Adolescent
Importance of Growth and Development
13 years to approximately 18 years
Knowing what to expect of a particular child at any given age.
Gaining better understanding of the reasons behind illnesses.Early diagnosis of certain diseases as FTT ,obesity , short stature , macrocephaly ,microcephaly and cerebral palsy
Helping in formulating the plan of care.
Helping in parents’ education in order to achieve optimal growth & development at each stage.
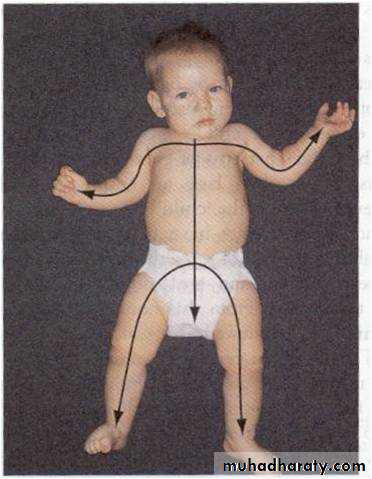
Growth Patterns
The child’s pattern of growth is in a head-to-toe direction(cephalo-caudal), and in an inward to outward pattern (proximodistal)
Factors affecting growth and development
Hereditary(genetic factors):
Determine the potential and limitations of growth and development, a child genetically determined to be tall grows slightly more rapidly than a child genetically determined to be short. Similarly, a child genetically determined to be clever develops their intellect more rapidly than a child genetically determined to be less intelligent.Environmental factors
Pre-natal environment
Post-natal environment
Pre-natal environment:
Factors related to mothers during pregnancy:
Diabetic mother
Exposure to radiation
Smoking
Congenital Infections
Use of drugs
Chronic illnesses
Factors related to fetus :
congenital malformations
Faulty placental implantation
Mal-position in uterus
Post-natal environment
External environment:
socio-economic status of the family
child’s nutrition
Number of siblings in the family
Family structure
Internal environment:
Hormonal influences
Emotions and child’s intelligence
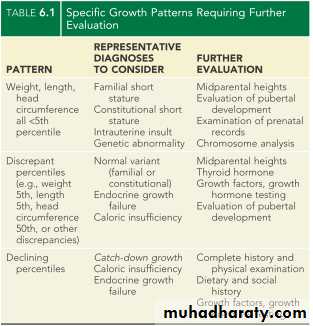
Normal Growth
Deviations in growth patterns may be nonspecific but may be important indicators of serious and chronic medical disorders. An accurate measurement of height, weight, and head circumference should be obtained at every health supervision visit. The following summarizes several convenient benchmarks to evaluate normal growth
Rules of Thumb for Growth:
Weight:
Weight loss in first few days: 5%-10% of birth weight
Return to birth weight: 10 days of age
Double birth weight: 4-5 mo
Triple birth weight: 1 y
Quadruple birth weight: 2 yr
Average weights:
3.5 kg at birth
10 kg at 1 yr
20 kg at 5 yr
30 kg at 10 yr
Age
Wt. gain
First 3 mo
30 gm/day
3 - 6 mo
20 gm/day
6 - 9 mo
15 gm/day
9 – 12 mo
12 gm/day
Daily weight gain:
Average annual weight gain: 2.3 kg between 2 yr and puberty
WEIGHT
KILOGRAMS
3 – 12 mo
age(mo)+9/2
1 – 6 years
Age(yr)х2+8
7 – 12 years
Age(yr) х7-5/2
Formulas for Approximate Average weight:
Height
The average child length is 50 cm at birth,75 cm at 1 yr and 87 cm at 2 yr.At age 4 yr, the average child is 100 cm tall (double birth length)
So, body ht. increases by about 50% at the end of 1st yr than it was at birth, and 100% at 4th yr.
Average annual height increase: 5-7 cm between age 4 yr and puberty


For infants, the measure of linear growth is length, taken by two examiners (one to position the child) with the child supine on a measuring board.


For older children, the measure is stature, taken with a child standing on a stadiometer .
The child should stand erect with bare and closed feet , the external auditory meatus at the level of lateral canthus and all aspects of back should be in touch with the wall as much as possible.
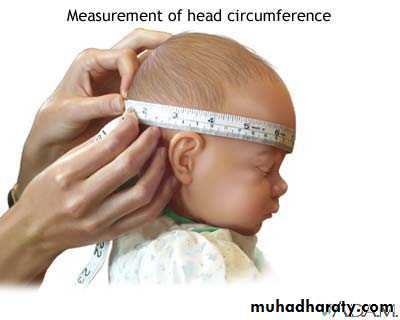
Head Circumference
Measured from the supraorbital ridge in front to the farthest point of the occiput in back i.e.Occipito-Frontal Circumference (OFC).
Average HC: 35 cm at birth .
By 1 yr it increases 12 cm to become 47 cm
OFC increase in the 1st year of life
Birth35 cm
0-3 mo
↑ 2cm/mo
3-6 mo
↑ 1cm/mo
6-12 mo
↑ ½ cm /mo
1 yr
47 cm

OFC after the 1st year of life
1 year
47 cm
2 years
49 cm
3 years
50cm
6 years
52 cm
10 year
53 cm
adult
56 cm
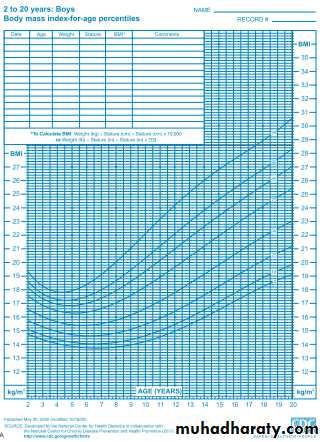
Growth assessment
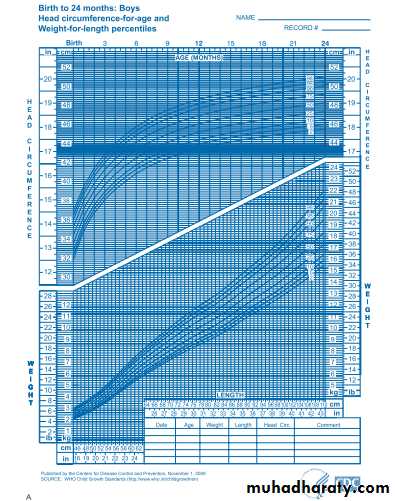
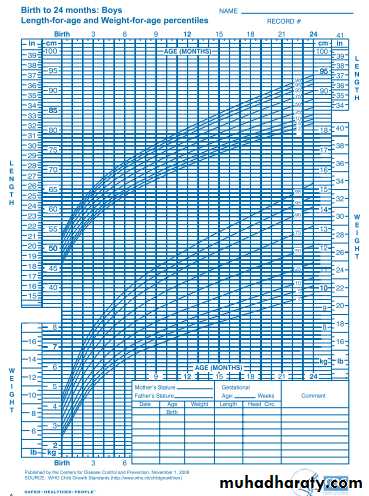
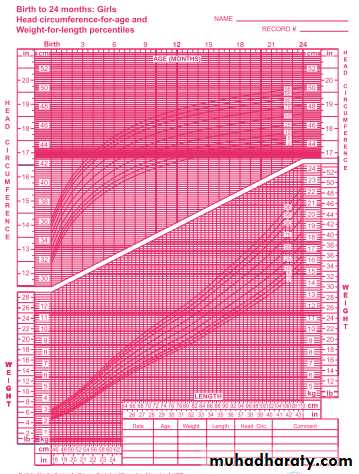
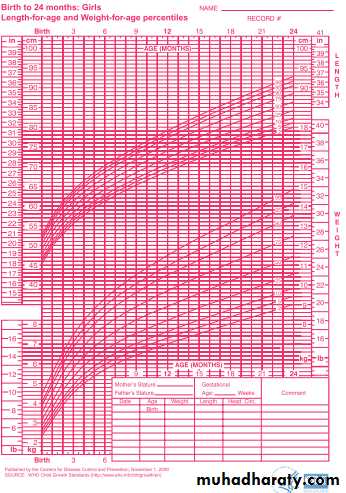
The most powerful tool in growth assessment is the growth chart. At each well child visit, the height, weight, and head circumference are measured and plotted on standard graphs routinely at health maintenance visits or at other visits if there is a concern over the child's growth pattern. .
Growth is assessed by plotting accurate measurements on growth charts (Centers for Disease Control ”CDC” charts) and comparing each set of measurements with previous measurements. Measurements are plotted
For ages 0 to 36 months, charts include:
Weight-for-age
Length-for-age (measured recumbent)
Head circumference-by-age
Weight-for-length
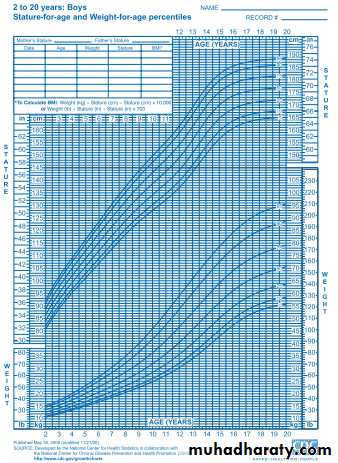
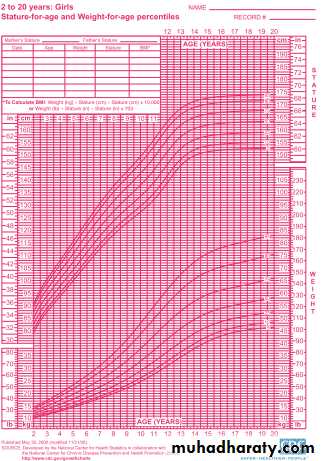
For ages 2 to 20 years, charts include:
Weight-for-age
Stature-for-age (measured with the child standing on stadiometer)
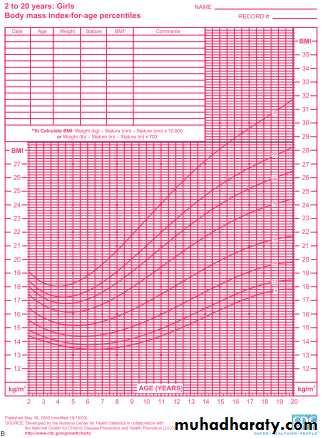
body mass index (BMI)-for age
The BMI is defined as body weight in kilograms divided by height in meters squared.
The BMI is an index for classifying adiposity and is recommended as a screening tool for children and adolescents to determine whether an individual is overweight (BMI above the 95th percentile for age) or at risk for being overweight (BMI between the 85th and 95th percentile for age).
Each chart is composed of seven or eight percentile curves, representing the distribution of weight, length, stature, or head circumference values at each age.
Percentiles rank the position of an individual by indicating what percent of the reference population the individual would equal or exceed.e.gwt.-age chart, a 5 yr girl whose wt. is at 25th centile, weighs the same or more than 25% of the reference population of 5 yr old girls(same age and sex) & weighs less than 75% of 5 yr old girls of the reference population.
The 50th centile is the median (standard value):is the value above and below which 50% of the observations lie.
Separate growth charts are available for very low birth weight infants (weight <1500 g) and for children with Turner syndrome, Down syndrome, achondroplasia, and other dysmorphology syndromes.
For premature infants, over diagnosis of growth failure can be avoided by using growth charts developed specifically for this population. A cruder method, subtracting the weeks of prematurity from the postnatal age when plotting growth parameters, does not capture the variability in growth velocity that very low birth weight (VLBW) infants demonstrate. While VLBW infants may continue to show catch-up growth through early school age, most achieve weight catch-up by 24 mo , height catch-up by 40 mo and OFC catch-up by 18 mo of age
OTHER INDICES OF GROWTH
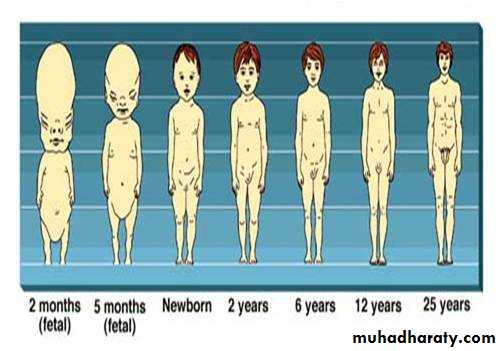
BODY PROPORTIONS:Body proportions follow a predictable sequence of changes with development. The head and trunk are relatively large at birth, with progressive lengthening of the limbs throughout development, particularly during puberty.
The lower body segment is defined as the length from the symphysis pubis to the floor, and the upper body segment is the height minus the lower body segment. The ratio of upper body segment divided by lower body segment (U/L ratio) equals approximately 1.7 at birth, 1.3 at 3 yr of age, and 1.0 after 7 yr of age. Higher U/L ratios are characteristic of short-limb dwarfism or bone disorders, such as rickets
DENTAL DEVELOPMENT
The average age of eruption of the primary teeth (20) is 6 months, and is fully erupted by 30 months of age and start to exfoliate by 6 yr,Delayed eruption is usually considered when there are no teeth in the mouth by approximately 13 mo of age.While permanent teeth (32) erupt by 6th yr and may not completed until 17-21 yr.
The mandibular central incisors are the first primary teeth to erupt

SKELETAL MATURATION
It is gradual disappearance of the epiphysis of bones and their fusion with growth plates of the bones and increase in the size of bones, bone maturation facilitate estimation of bone age. It also involves changes of the cartilaginous skull fontanels into bony structures.