1
Production Engineering – I Herish N. Hamarash
PRODUCTION
ENGINEERING –I

2
Production Engineering – I Herish N. Hamarash
Introduction to Production Technology
The production engineering is that part of Petroleum Engineering which attempts to maximize
production (or injection) in a cost manner.
The appreciation of production engineering and methods of application are related directly and
interpedently with other major areas of petroleum engineering such as Formation Evaluation,
Drilling engineering and Reservoir Engineering.
The role of the Production Technologist is extremely broad. Currently within the operating
companies in the petroleum industry, the role and responsibility does vary between companies but
can be broadly said to be responsible for the production system.
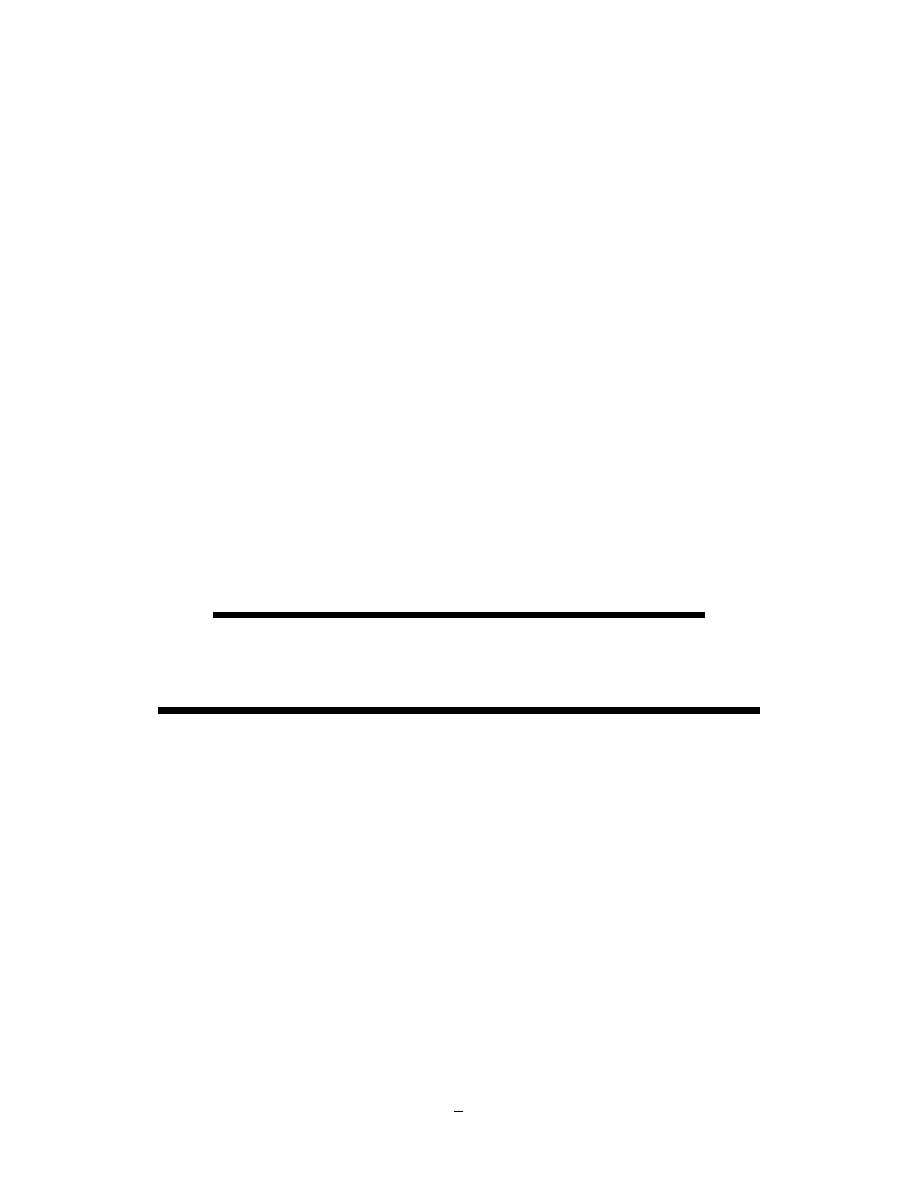
The production system is a composite term describing the entire production process and includes
the following principal components:-
1- The reservoir - it productive capacity and dynamic production characteristics over the
envisaged life of the development.
2- The wellbore - the production interval, the sump and the fluids in the wellbor
3- Production Conduit - comprising the tubing and the tubing components
4- Wellhead, Xmas Tree and Flow Lines
5- Treatment Facilities.
In simple terms, the term "well completion" refers to the methods by which a newly drilled well
can be finalized so that reservoir fluids can be produced to surface production facilities efficiently
and safely. In general, the process of completing a well includes the following:
A method of providing satisfactory communication between the reservoir and the borehole.
The design of the tubulars (casing and tubing) which will be installed in the well.
An appropriate method of raising reservoir fluids to the surface.
The design and the installation in the well of various components used to allow efficient
production, pressure integrity testing, emergency containment of reservoir fluids, reservoir
monitoring, barrier placement, well maintenance and well kill.
The installation of safety devises and equipment, which will automatically shut a well in
the event of a disaster.
In general, a well is the communication link between the surface and the reservoir and it represents
a large percentage of the expenditure in the development of an oil or gas field. It is of utmost
importance that the well be "completed" correctly at the onset, in order that maximum overall
productivity of the field may be obtained. The ideal completion is the lowest cost completion which
will meet the demands placed on it during its producing lifetime.
3
Production Engineering – I Herish N. Hamarash
Figure (1) shows the Elements of the production technology system:
Figure (1): Elements of the production technology system

4
Production Engineering – I Herish N. Hamarash
Before knowing the classification of completion, must know the main objective from wells drilling
as following:
-
Exploration and evaluation wells: This type of wells is drill for exploration and
evaluation.
-
Production wells: The wells are drilled and completed for produce oil, gas and
sometime water produce.
-
Injection wells: The wells are drilled and completed for inject water or gas or
chemical material and sometimes petroleum products.
-
Measurement and observation wells: The wells are drilled and completed for
observation the reservoir (reservoir fluid behavior, reservoir pressure, etc...).
-
Special operation wells: The wells are drilled and completed for special operation
such as to kill the below out well.
From the above definition it can be seen that the responsibilities of Production Technology cover
primarily subsurface aspects of the system but they can also extend to some of the surface facilities
and treatment capabilities, depending on the operating company. The role of the Production
Technologist is one of achieving optimum performance from the production system and to achieve
this the technologist must understand fully the chemical and physical characteristics of the fluids
which are to be produced and also the engineering systems which will be utilized to control the
efficient and safe production/injection of fluids. The importance of the production chemistry input
has only recently been widely acknowledged. It is clear that the physico-chemical processes which
take place in the production of fluids can have a tremendous impact on project economics and on
both the production capacity and safety of the well. The main disciplines which are involved in
Production Technology are:
I.
Fluid flow
II.
Reservoir dynamics
III.
Equipment design, installation, operation and fault diagnosis
5
Production Engineering – I Herish N. Hamarash
Reservoir Drive Mechanisms
Ideally the hydrocarbons are recovered from the reservoir porous media by the assistance of the
drive mechanisms weather it was natural or artificial. Drive mechanisms have two
classifications:
Internal drive: Using the internal energy of the reservoir configuration.
External drive: Which involves the invasion of the pore spaces by a replacement fluid, this type
of drive called "Secondary recovery or Enhanced oil recovery".
Internal drive:
This is known as primary recovery, which includes three drive mechanisms:
A. Depletion or internal gas drive (See Figure -2)
B. External gas cap drive (See Figure – 3)
C. Water drive (See Figure – 4)
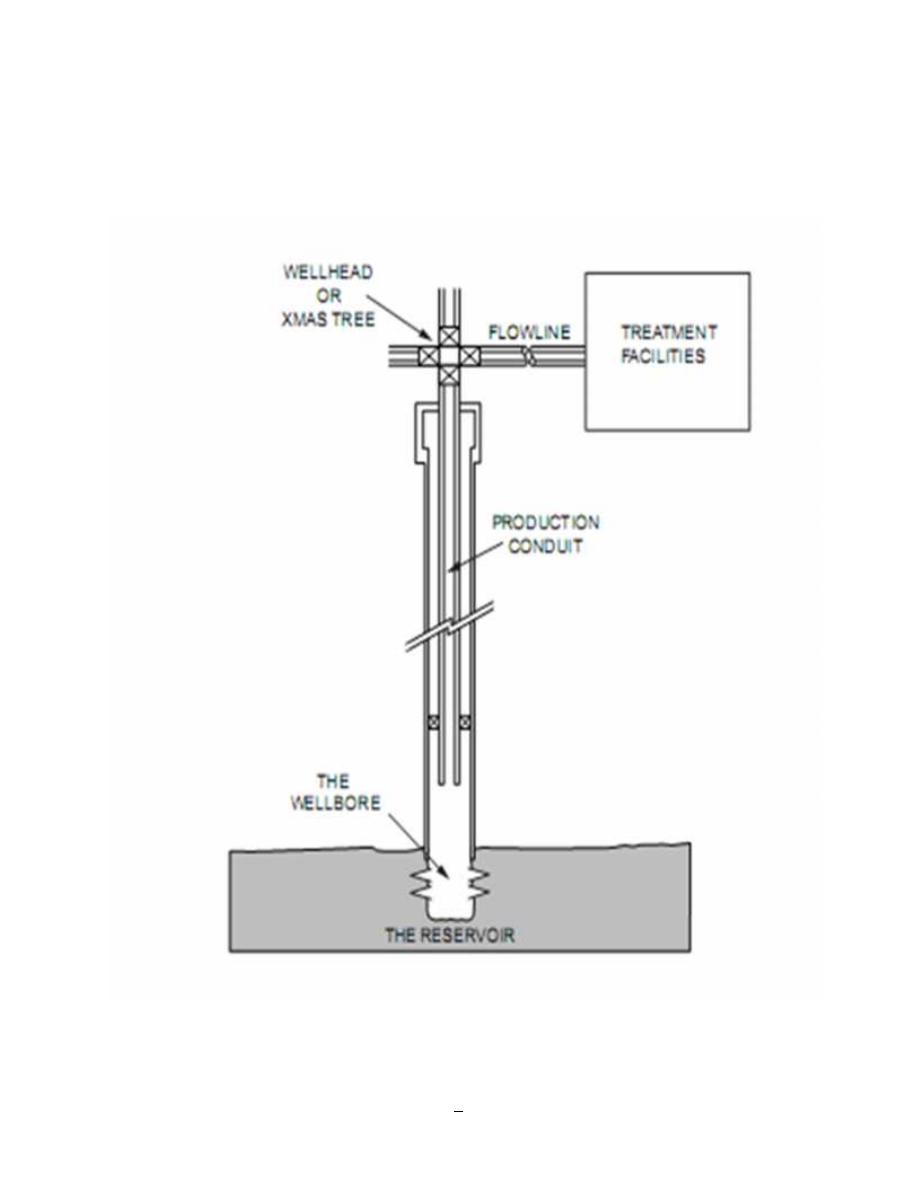
A- Depletion or internal gas drive:
The compressibility of oil and water is relatively small. As soon as production commences, it
is accompanied by a rapid drop of pressure in the producing zone which soon reaches the
bubble point of entrained gas. Initially, this gas is dispersed, but it rapidly expands and assists
in dispelling the oil. Eventually, however, the gas will start to form a gas front, which, having
more mobility than the oil, will increase the production gas to oil ratios. This depletion or
dissolved gas drive is characterized by a rapid decline in reservoir pressure and by the recovery
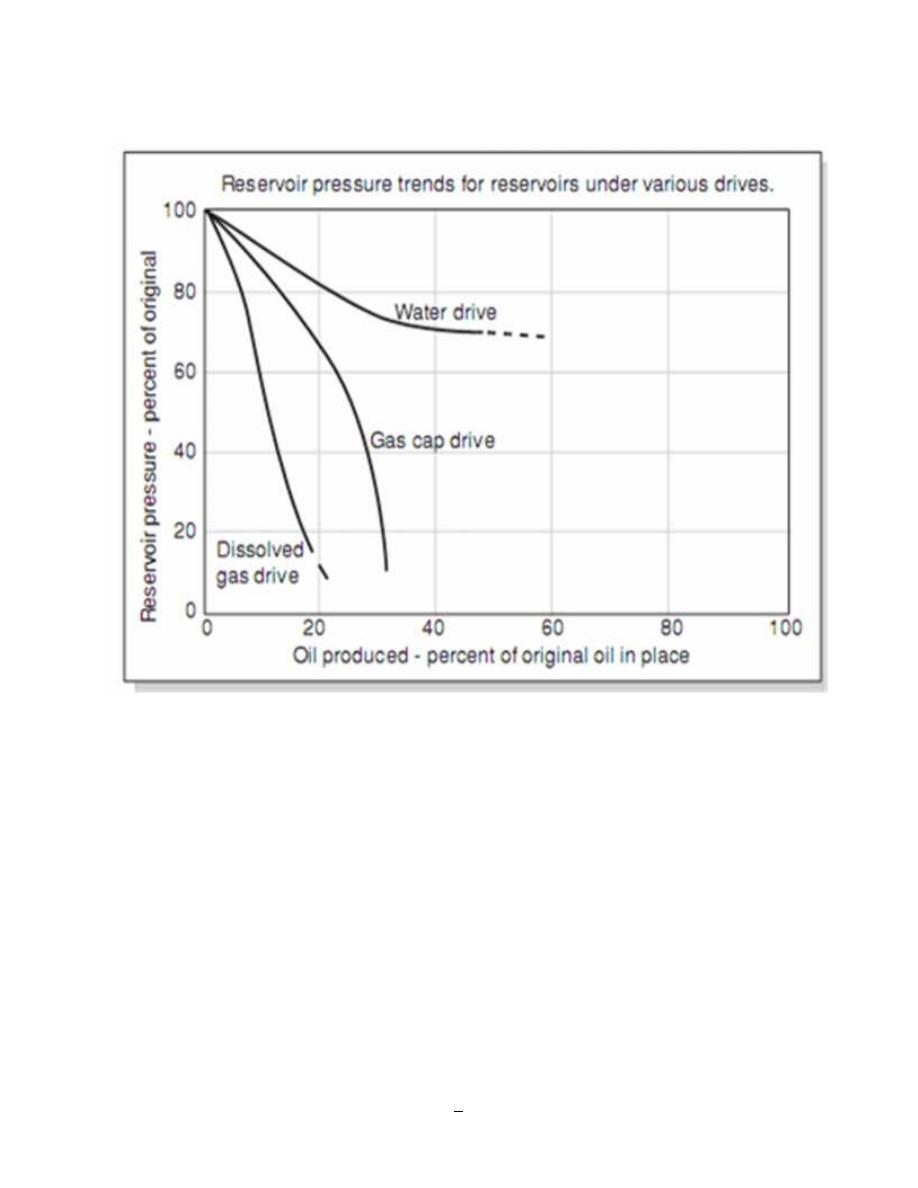
of only a small percentage of the oil in situation, e.g. 5 to 20% maximum see figure - 5
Figure – 2: Internal Gas Drive
6
Production Engineering – I Herish N. Hamarash
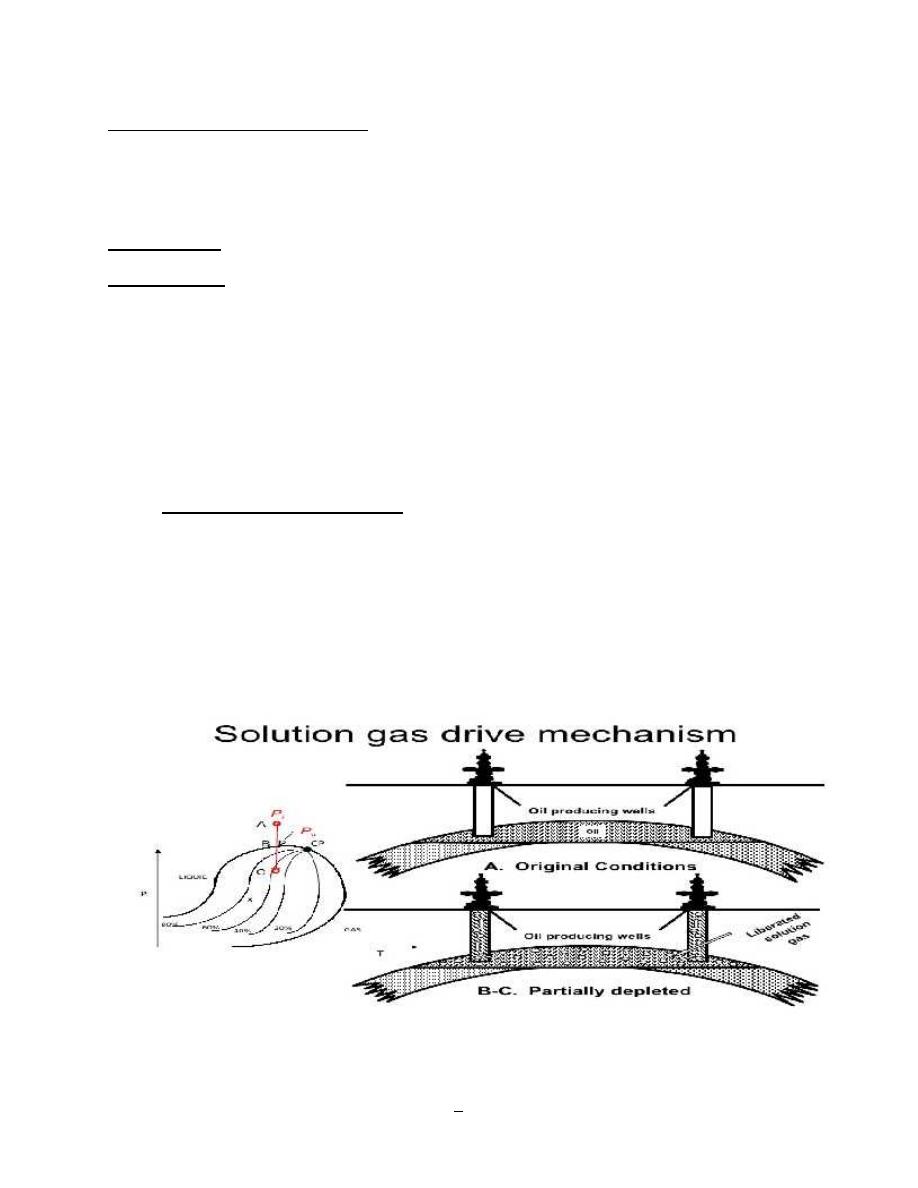
B- External gas cap drive
Where the oil has a gas cap, the gas cap pressure together with the pressure of gas in solution
tends to maintain pressure in the reservoir much longer than depletion drive. Therefore, gas cap
reservoirs have higher recovery rates e.g. 20 to 40% see figure - 5
Figure – 3: Gas Cap Drive
7
Production Engineering – I Herish N. Hamarash
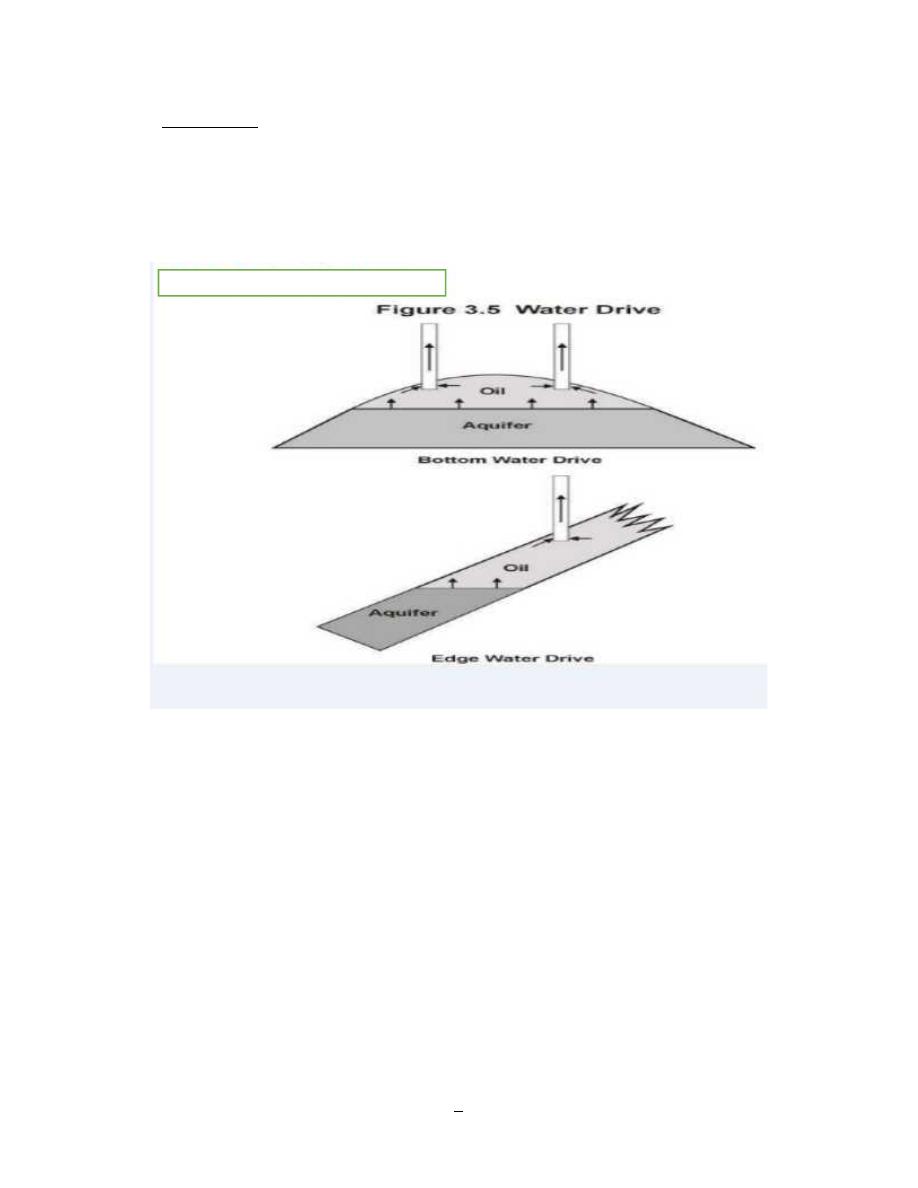
C- Water Drive
Water drive is characterized by large local deposits of water which expand as pressure is
reduced in the reservoir. Eventually, recovery will decrease due to the greater mobility of
the water front which eventually breaks through to the well-bore with increased water to
oil ratios. Nonetheless, water drive is the most efficient of all the drive mechanisms and
can produce recovery rates as high as 60% see figure - 5
Figure – 4: Water Drive
8
Production Engineering – I Herish N. Hamarash
Figure – 5: Expected recovery from different drives
9
Production Engineering – I Herish N. Hamarash
Radial Flow in the Reservoir:
Description of geometry is often possible only with the use of numerical simulators. For many
engineering purposes, however, the actual flow geometry may be represented by one of the
following flow geometries:
I.
Radial flow
II.
Linear flow
III.
Spherical and hemispherical flow
I.
Radial Flow:
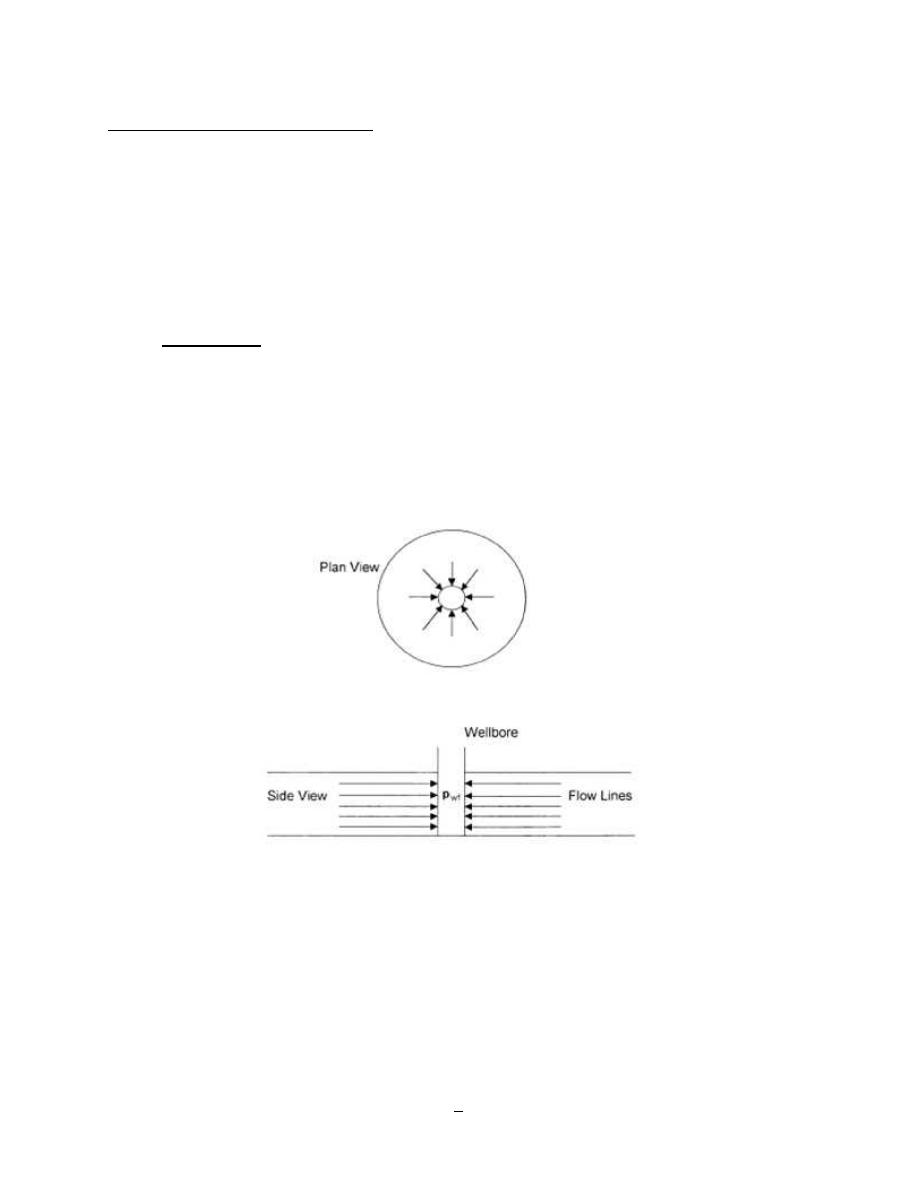
In the absence of severe reservoir heterogeneities, flow into or away from a wellbore will follow
radial flow lines from a substantial distance from the wellbore. Because fluids move toward the
well from all directions and coverage at the wellbore, the term radial flow is given to
characterize the flow of fluid into the wellbore. Figure - 6 shows idealized flow lines and iso-
potential lines for a radial flow system.
Figure – 6: Ideal Radial Flow into the Reservoir
10
Production Engineering – I Herish N. Hamarash
II.
Linear Flow
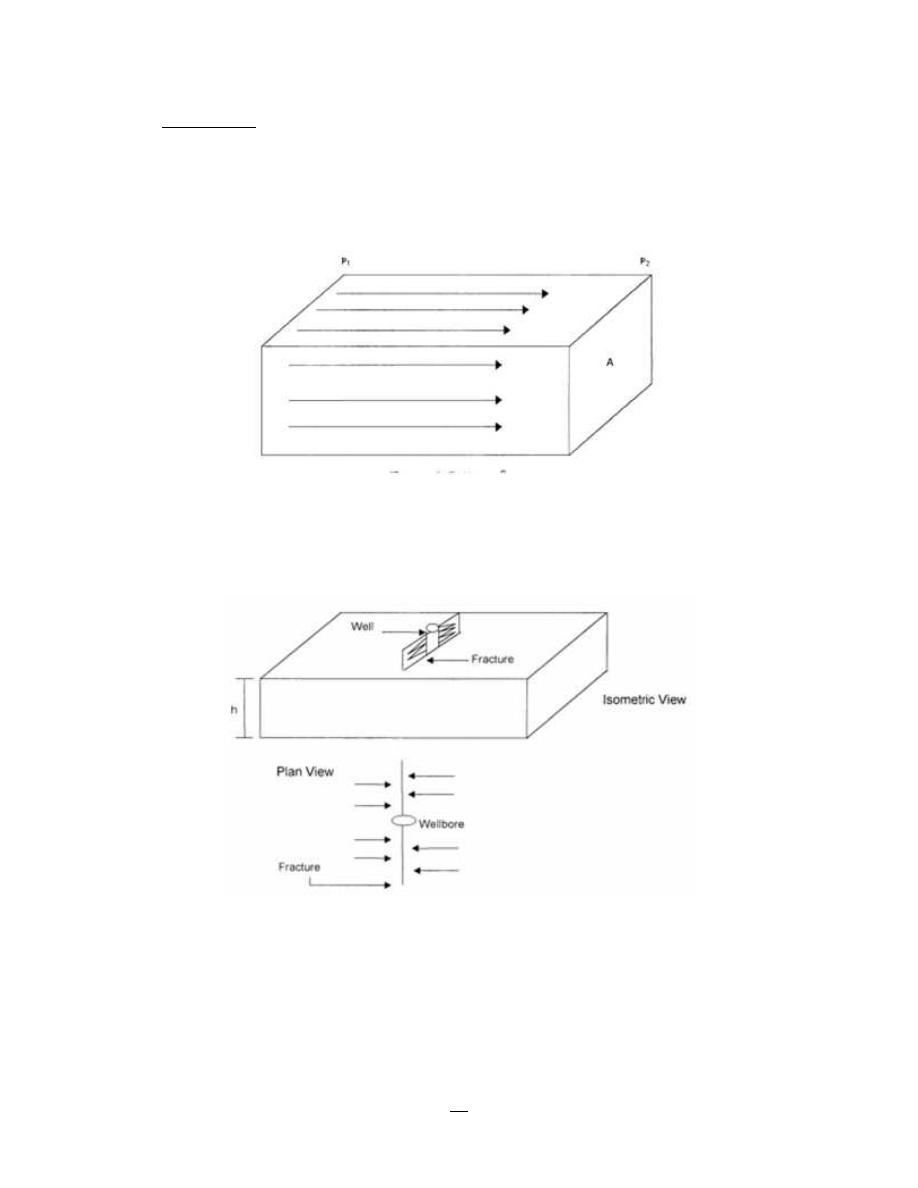
Linear flow occurs when flow paths are parallel and the fluid flows in a single direction. In
addition, the cross sectional area to flow must be constant. Figure - 7 shows an idealized linear
flow system. A common application of linear flow equations is the fluid flow into vertical
hydraulic fractures as illustrated in Figure - 8.
Figure - 7: Linear Flow
Figure - 8: Ideal Linear Flow into Vertical Fracture
11
Production Engineering – I Herish N. Hamarash
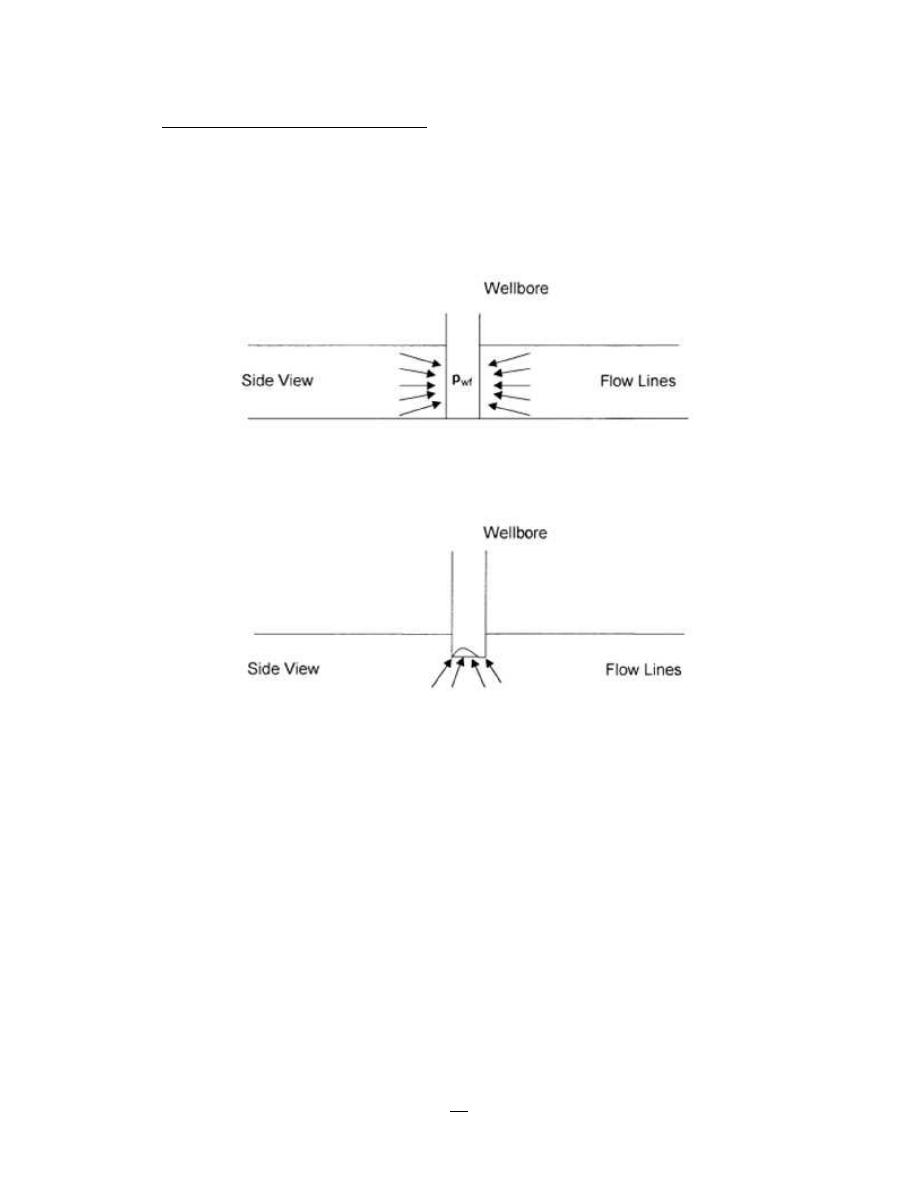
III.
Spherical and Hemispherical Flow
Depending upon the type of wellbore completion configuration, it is possible to have a spherical
or hemispherical flow near the wellbore. A well with a limited perforated interval could result in
spherical flow in the vicinity of the perforations as illustrated in Figure - 9. A well that only
partially penetrates the pay zone, as shown in Figure - 10, could result in hemispherical flow.
The condition could arise where coning of bottom water is important.
Figure - 9: Spherical Flow due to Limited Entry
Figure - 10: Hemispherical Flow
12
Production Engineering – I Herish N. Hamarash
FLUID FLOW EQUATIONS
Darcy’s Law
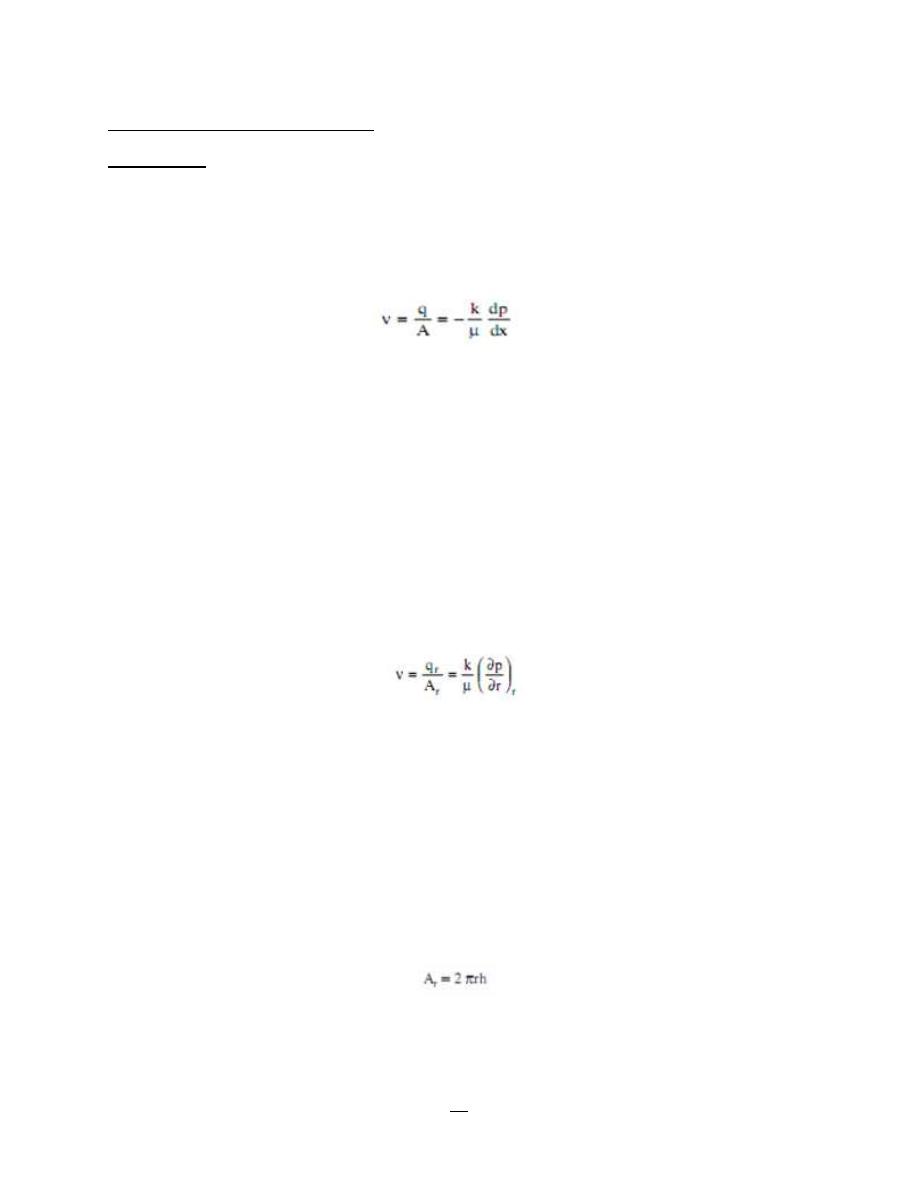
The fundamental law of fluid motion in porous media is Darcy’s Law. The mathematical
expression developed by Henry Darcy in 1856 states the velocity of a homogeneous fluid in a
porous medium is proportional to the pressure gradient and inversely proportional to the fluid
viscosity. For a horizontal linear system, this relationship is:
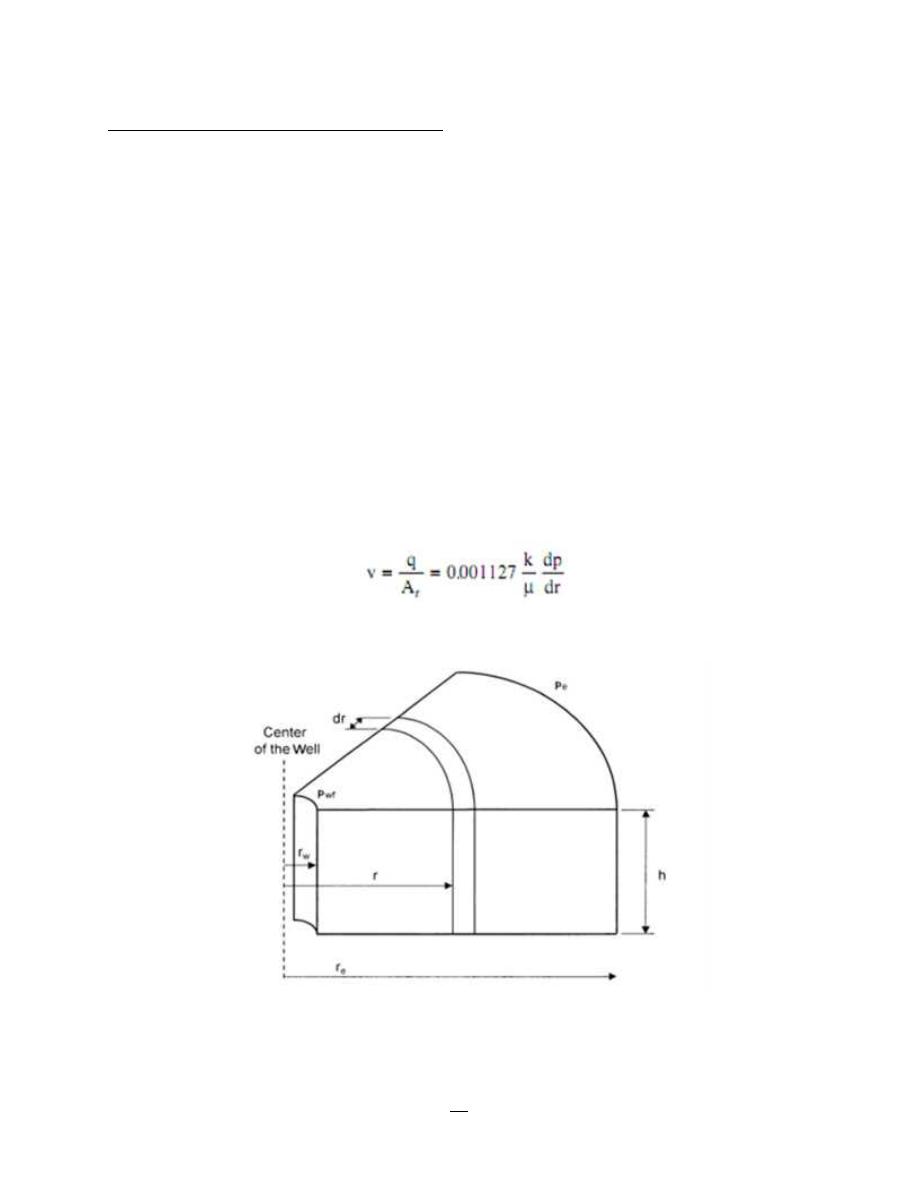
ν is the apparent velocity in centimeters per second and is equal to q/A, where q is the volumetric
flow rate in cubic centimeters per second and A is total cross-sectional area of the rock in square
centimeters. In other words, A includes the area of the rock material as well as the area of the pore
channels. The fluid viscosity, µ, is expressed in centipoise units, and the
Pressure gradient, dp/dx, is in atmospheres per centimeter, taken in the same direction as ν and q.
The proportionality constant, k, is the permeability of the rock expressed in Darcy units.
The negative sign in the equation is added because the pressure gradient is negative in the
direction of flow.
For a horizontal-radial system, the pressure gradient is positive and Darcy’s equation can be
expressed in the following generalized radial form:
Where
q= volumetric flow rate at radius r
A = cross-sectional area to flow at radius r
(∂p/∂r)= pressure gradient at radius r
ν=apparent velocity at radius r
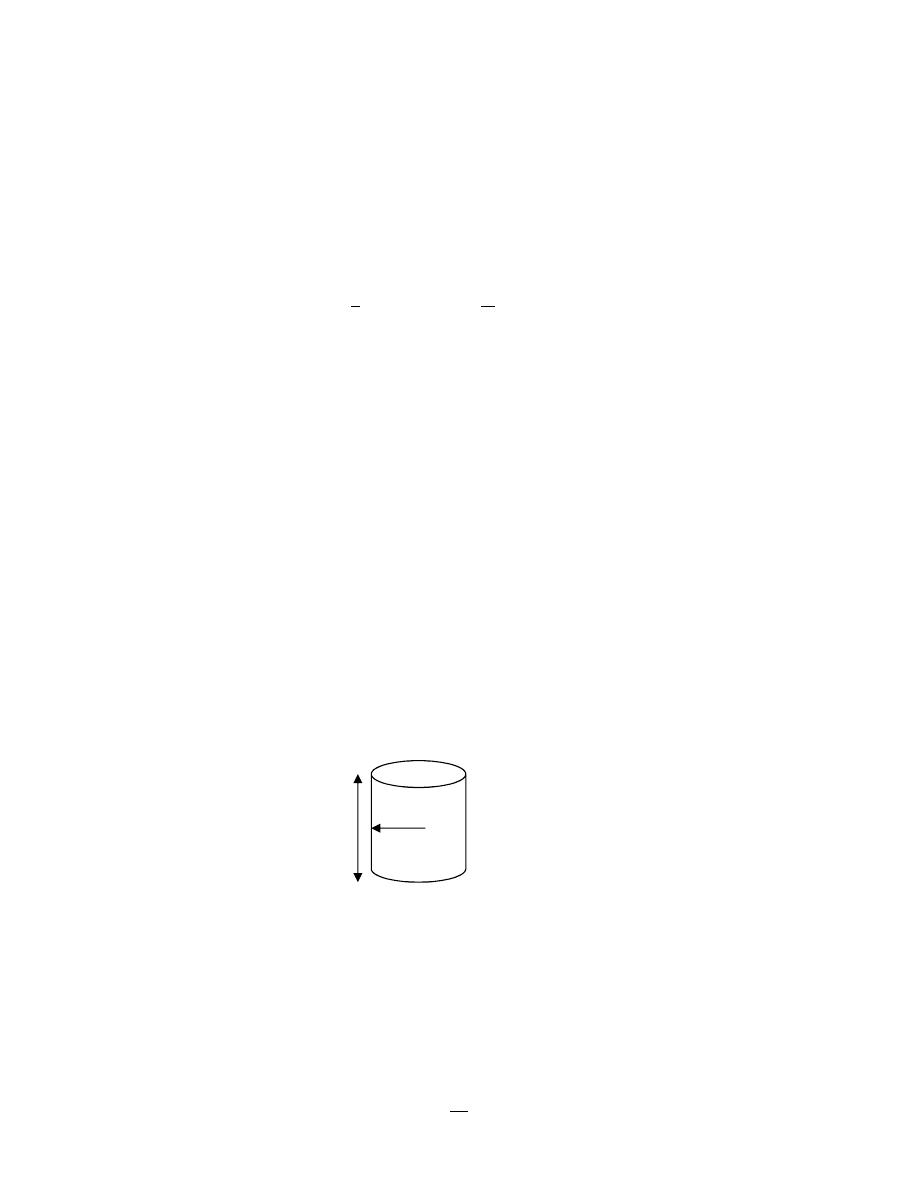
The cross-sectional area at radius r is essentially the surface area of a cylinder. For a fully
penetrated well with a net thickness of h, the cross-sectional area A is given by:
13
Production Engineering – I Herish N. Hamarash
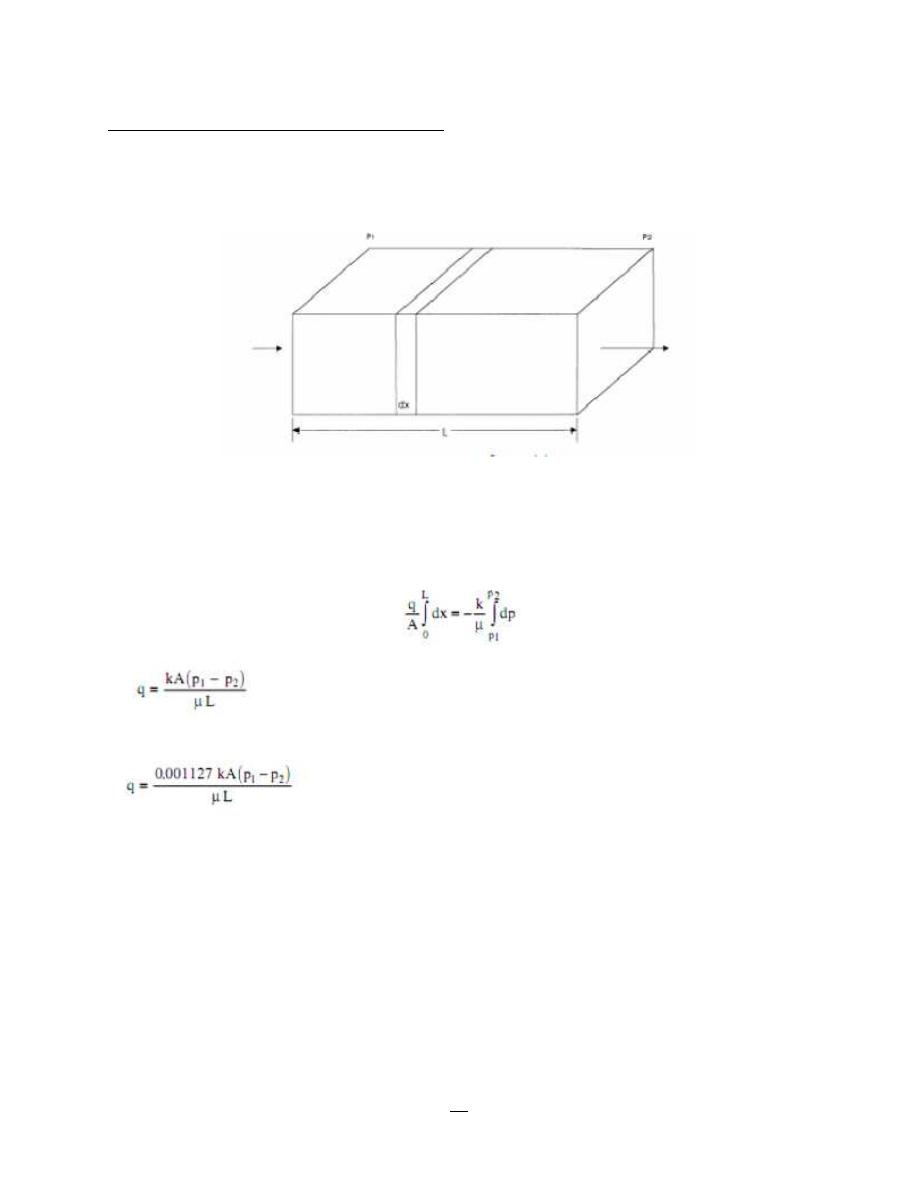
Linear Flow of Incompressible Fluids
In the linear system, it is assumed the flow occurs through a constant cross-sectional area A, where
both ends are entirely open to flow. It is also assumed that no flow crosses the sides, top, or bottom
as shown in Figure -11 below:\
Figure - 11: Linear Flow Model
If an incompressible fluid is flowing across the element dx, then the fluid velocity v and the flow
rate q are constants at all points. The flow behavior in this system can be expressed by the
differential form of Darcy’s equation and integrating over the length of the linear system gives
OR
It is desirable to express the above relationship in customary field units
Where:
q = flow rate, bbl/day
k = absolute permeability, md
p = pressure, psia
µ=viscosity, cp
L = distance, ft
A = cross-sectional area, ft2
14
Production Engineering – I Herish N. Hamarash
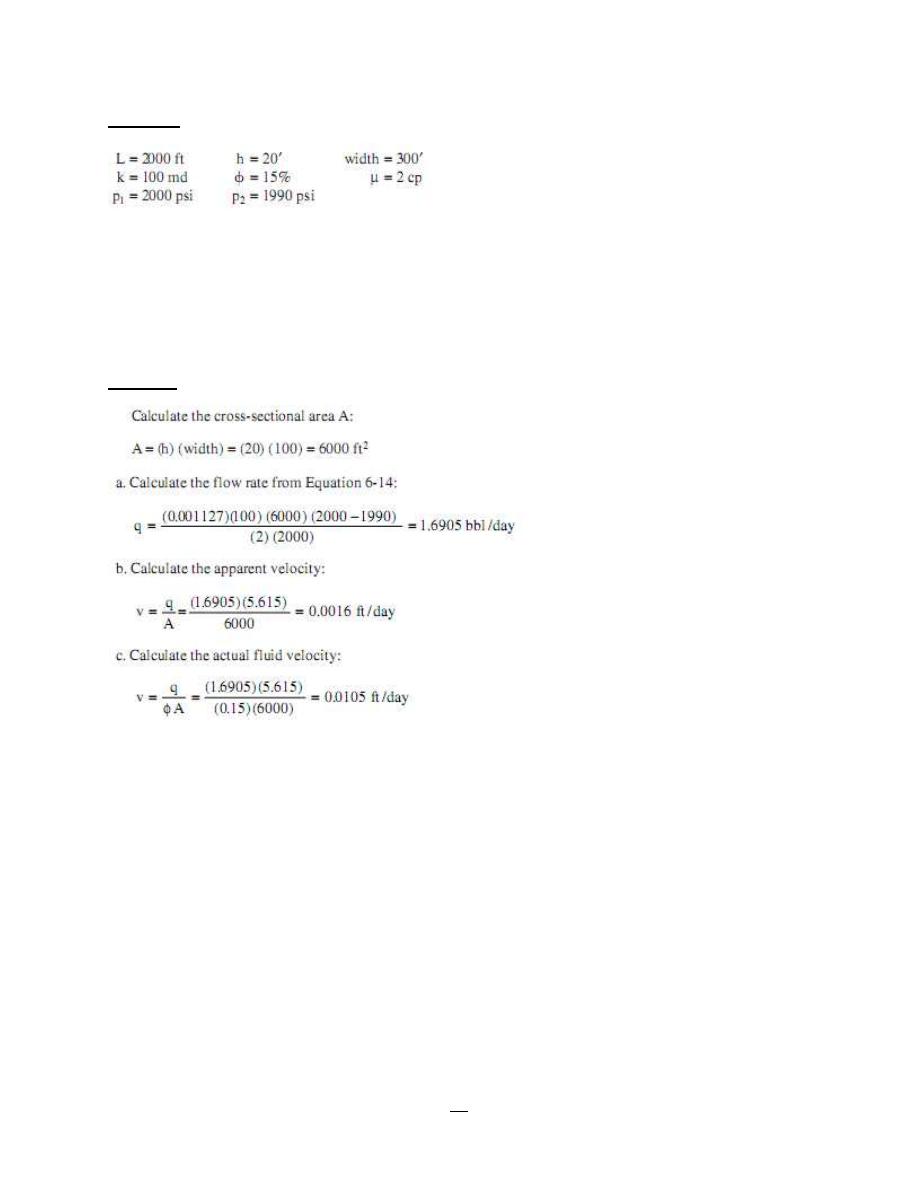
Example: An incompressible fluid flows in a linear porous media with the following properties:
Calculate:
a. Flow rate in bbl/day
b. Apparent fluid velocity in ft/day
c. Actual fluid velocity in ft/day
Solution:
15
Production Engineering – I Herish N. Hamarash
Radial Flow of Incompressible Fluids
In a radial flow system, all fluids move toward the producing well from all directions. Before
flow can take place, however, a pressure differential must exist. Thus, if a well is to produce oil,
which implies a flow of fluids through the formation to the wellbore, the pressure in the
formation at the wellbore must be less than the pressure in the formation at some distance from
the well.
The pressure in the formation at the wellbore of a producing well is know as the bottom-hole
flowing pressure (flowing BHP, Pwf). Consider Figure - 12 which schematically illustrates the
radial flow of
an incompressible fluid toward a vertical well. The formation is considered to a uniform
thickness h and a constant permeability k. Because the fluid is incompressible, the flow rate q
must be constant at all radii. Due to the steady-state flowing condition, the pressure profile
around the wellbore is maintained constant with time. Let Pwf represent the maintained bottom-
hole flowing pressure at the wellbore radius rw and pe denote the external pressure at the
external or drainage radius. Darcy’s equation as described earlier can be used to determine the
flow rate at any radius r:
Figure - 12: Radial Flow Model
16
Production Engineering – I Herish N. Hamarash
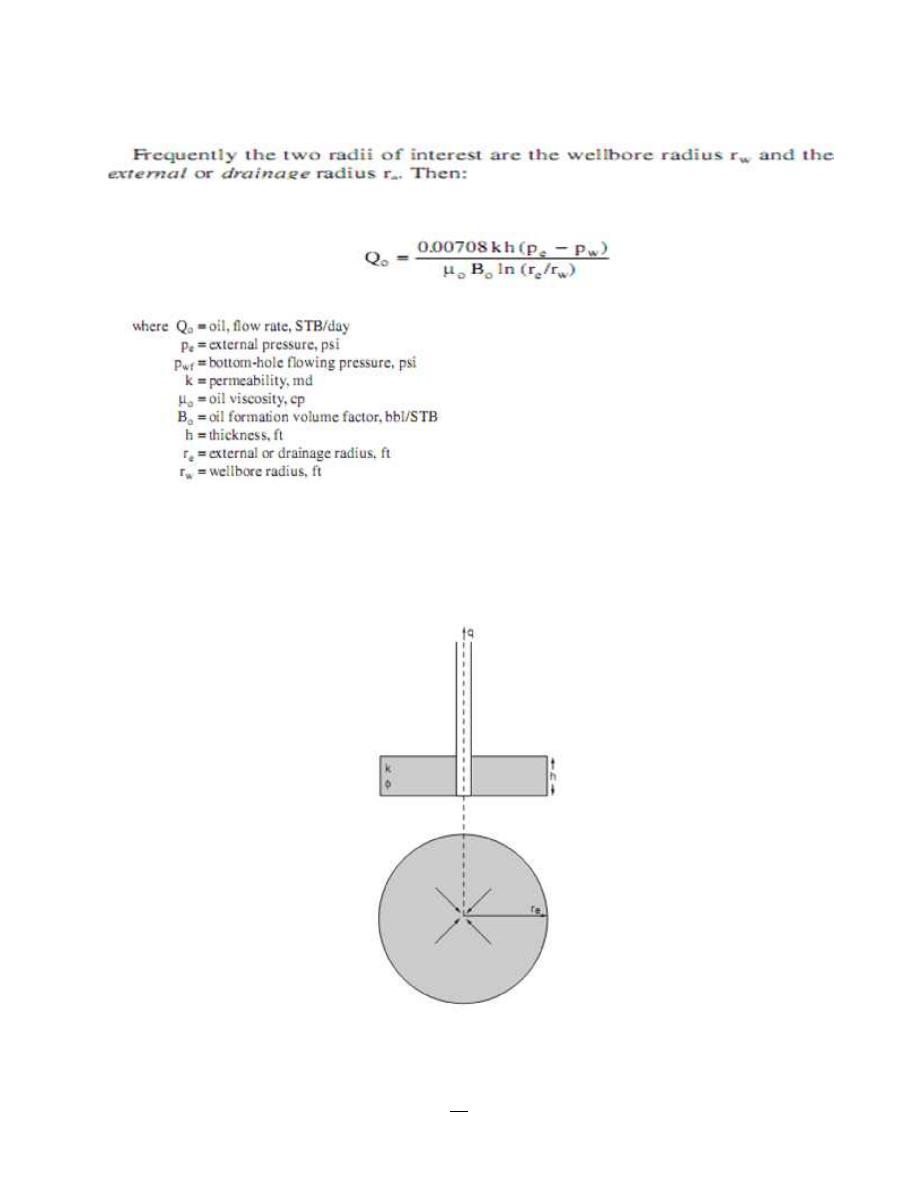
To account for the convergence effects of flow, a simplified model based upon the assumption of
radial flow to a central well located in the middle of a cylindrical reservoir unit is assumed as
shown in Figure - 13 below:
Figure 13: Radial Inflow Model

17
Production Engineering – I Herish N. Hamarash
The model assumes:
The reservoir is horizontal and of constant thickness h.
The reservoir has constant rock properties of φ and K.
Single phase flow occurs to the well bore.
The reservoir is circular of radius re.
The well is located at the center of the reservoir and is of radius r
w
.
The fluid is of constant viscosity µ.
The well is vertical and completed open hole, i.e. fluid enters the wellbore through the total
height h.
18
Production Engineering – I Herish N. Hamarash
Completion Design Consideration
Production technology contributes substantially as one of the major technical functions within an
operating company and in particular, to its economic performance and cashflow. As with any
commercial venture, the overall incentive will be to maximize profitability and it is in this
context that the operations for which the production technologist is responsible, are at the sharp
end of project economics. The objectives of an oil company operation could be broadly
classified, with respect to two complimentary business drivers, namely:
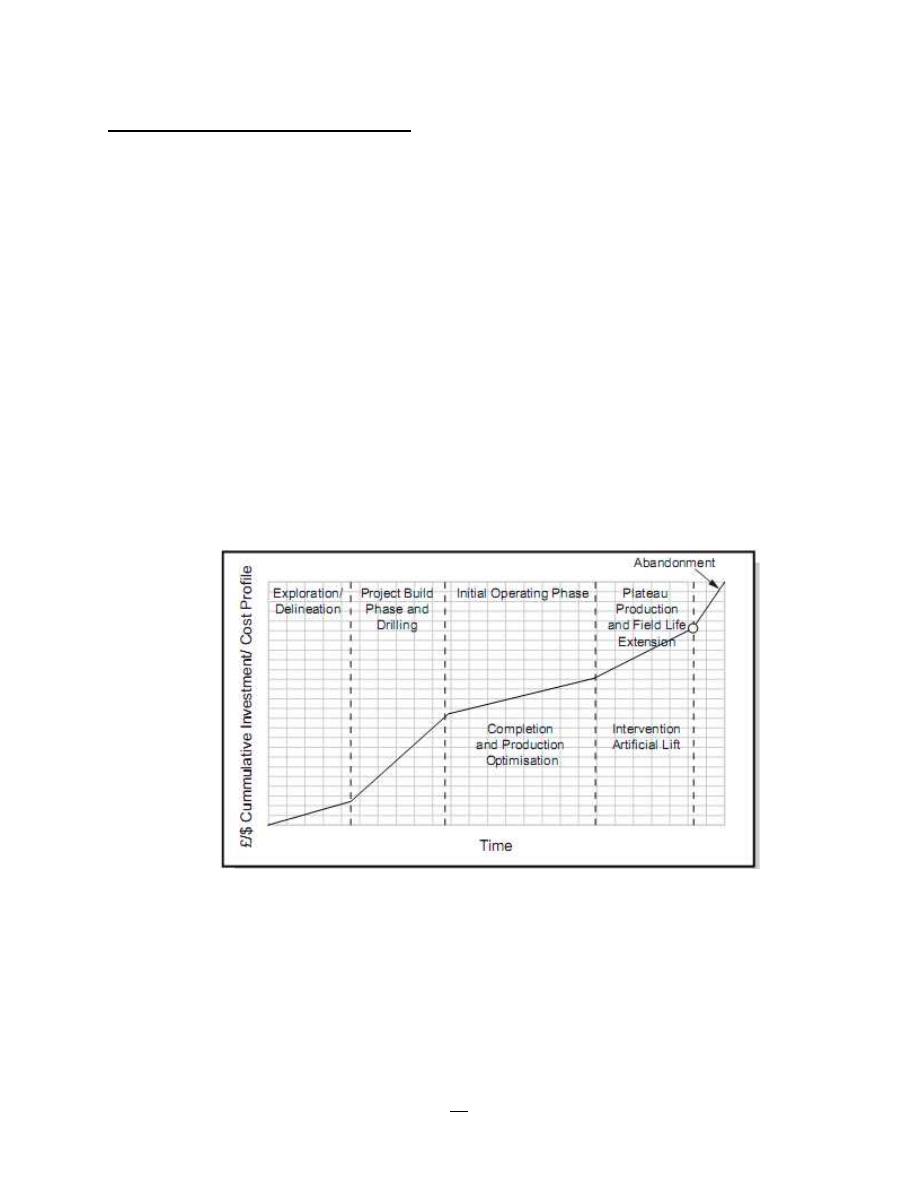
(a) Maximizing the magnitude of and accelerating cash flow
(b) Cost minimization in terms of cost/bbl.
Total cost minimization may not be recommended.
1-
Cashflow: The overall objectives would ideally be to maximize both cashflow and
recoverable reserves. This would normally require maintaining the well in an operational
state to achieve
o
maximum production rates
o
maximum economic longevity
o
minimum down time
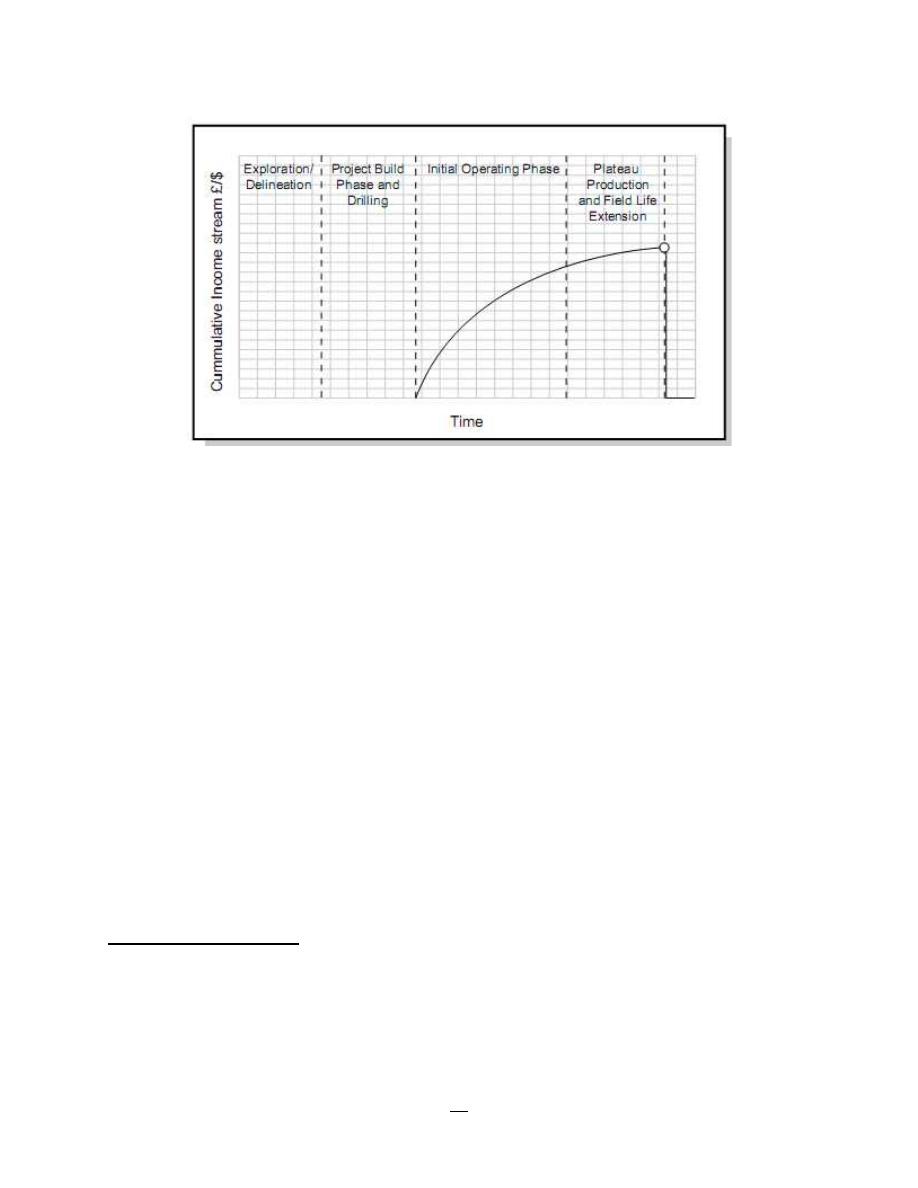
This is shown in Figures 14 & 15 bellow:
Figure - 14
19
Production Engineering – I Herish N. Hamarash
Figure - 15
Figures (14 & 15): Economic phase of field development and input from production
engineer
2-
Cost: In this category there would be both fixed and direct costs, the fixed costs being
those associated by conducting the operation and the direct or variable costs being
associated with the level of production and the nature of the operating problems. The
latter costs are therefore defined in terms of cost per barrel of oil produced. On this basis
the production technologist would seek to:
o
Minimize capital costs
o
Minimize production costs
o
Minimize treatment costs
o
Minimize workover costs
From the above, the bulk of the operations for which the production technologist is responsible
or has major inputs to, are at the sharp end of ensuring that the company’s operations are safe,
efficient and profitable. There for before a production well is drilled, a great deal of planning
must be undertaken to ensure that the design of the completion is the best possible. A number of
factors must be taken into account during this planning stage, which can broadly be split into the
objective of well drilling, reservoir considerations and mechanical considerations.
Objective of well drilling
The objective of well drilling is very important factor in well completion design, may be the
purpose from well drilling is clear from beginning or changed with time (a certain well completed
as producing well then after that convert to injection well or observation well depend on the
reservoir conditions).

20
Production Engineering – I Herish N. Hamarash
Reservoir considerations
Natural rock reservoir
The geological and experimental studies that conduct to delineate the nature of rock
reservoir (type of rock, including fault, reservoir permeability, etc…) is important to select
the adequate completion design.
Producing rate
To provide maximum economic recovery is often the starting point for well completion
design. Among other factors producing rate should determine the size of the producing
conduit.
Multiple reservoirs
Multiple reservoirs penetrated by a well pose the problem of multiple completions in one
drilled hole. Possibilities include multiple completions inside casing separated by packers,
or several strings of smaller casing cemented in one borehole to provide in effect separate
wells. Other possibilities include commingling of hydrocarbons from separate reservoir
downhole, or drilling several boreholes from one surface location.
Reservoir drive mechanism
Reservoir drive mechanism may determine whether or not the completion interval will
have to be adjusted as gas-oil or water-oil contacts move. A water drive situation may
indicate water production problems. Dissolved gas and gas drive reservoirs usually mean
declining productivity index and increasing gas-oil ratio.
Secondary recovery requirements
Secondary recovery needs may require a completion method conductive to selective
injection or production. Water flooding may increase volumes of fluid to be handled. High
temperature recovery processes may require special casing and casing cementing materials.
Stimulation
Stimulation may require special perforating patterns to permit zone isolation, perhaps
adaptability to high injection rates, and a well hookup such that after the treatment the zone
can be returned to production without contact with killing fluids.
Sand control
Sand control problems alone may dictate the type of completion method and maximum production
rates. On the other hand, reservoir fluid control problems may dictate that a less than desirable
type of sand control be used.
Artificial lift

21
Production Engineering – I Herish N. Hamarash
Artificial lift may mean single completions even where multiple zones exist.
Workover requirements
Workover frequencies, probably high where several reservoirs must be drained through
one wellbore, often dictate a completion conducive to wireline or through-tubing type
recompletion systems.
Mechanical considerations
The mechanical configuration or "well hookup" is often the key to being able to deplete the
reservoir effectively, monitor downhole performance, and modify the well situation when
necessary. The mechanical configuration of the well is the key to being able to do what ought to
be done in the well from the standpoint of controlling the flow of reservoir fluids, oil, gas, and
water.
Functional requirements
Operating conditions
Component design
Component reliability
Safety
KEY SUBJECT AREAS IN PRODUCTION ENGINEERING
Production technology is both a diverse and complex area. With the on-going development of the
Petroleum Industry the scope of the technological activities continues to expand and as always
increases in depth and complexity. It is however, possible to identify several key subject areas
within Production Technology namely:-
Well Productivity
Well Completion
Well Stimulation
Associated Production Problems
Remedial and Workover Techniques
Artificial Lift / Productivity Enhancement
Surface Processing
Methods of completion:
In the development of a hydrocarbon reservoir, a large number of wells are drilled and require to
be completed, to allow the structure to be depleted. However, the drilling and completion
operations are crucial to the long term viability of the wells in meeting the specified objectives.
The design and completion of both production and injection wells are required to satisfy a number
of objectives including:
Provision of optimum production/injection performance.
22
Production Engineering – I Herish N. Hamarash
Ensure safety.
Maximize the integrity and reliability of the completion over the envisaged life of the
completed well
Minimize the total costs per unit volume of fluid produced or injected, i.e. minimize the
costs of initial completion, maintaining production and remedial measures.
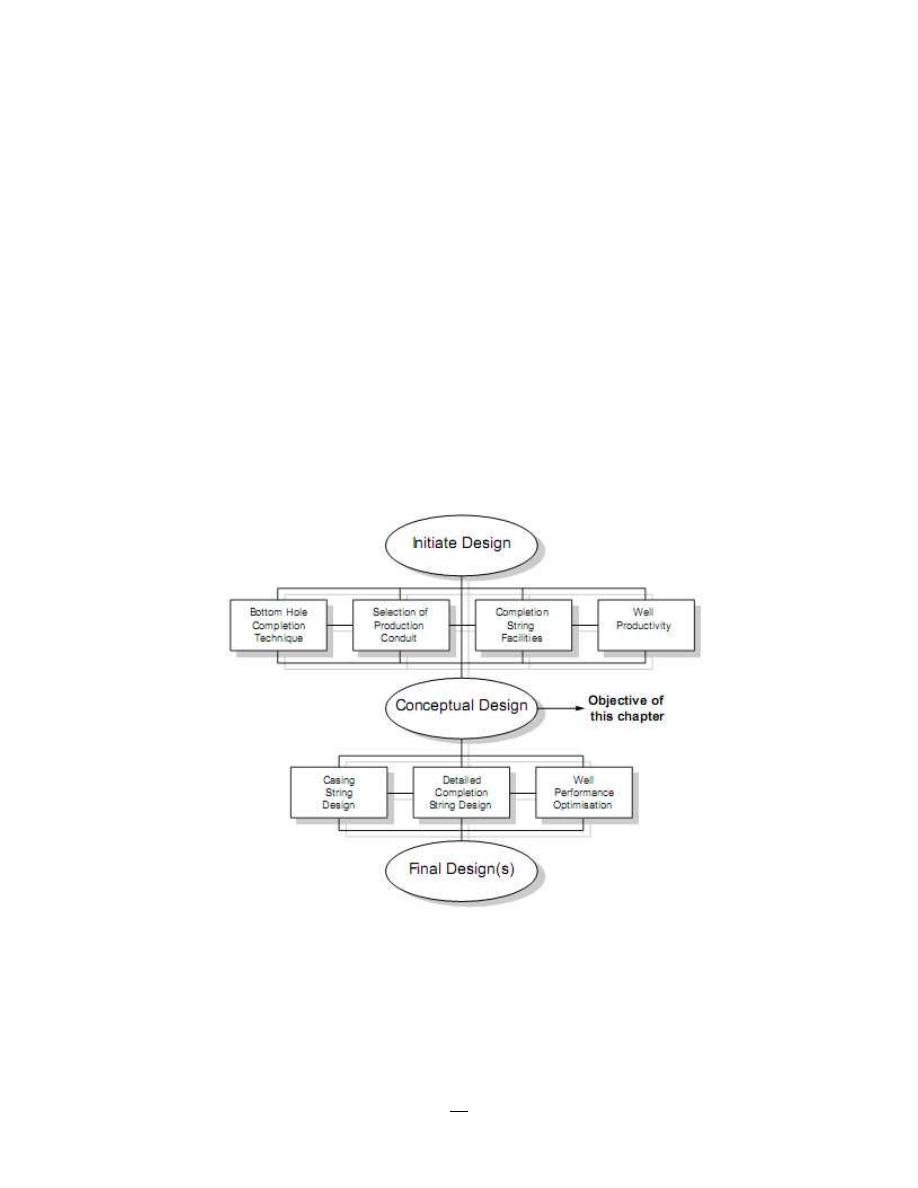
The fundamental design of a completion consists of four principal decision areas, namely:
1. Specification of the bottomhole completion technique.
2. Selection of the production conduit.
3. Assessment of completion string facilities.
4. Evaluation of well performance / productivity-injectivity
These four decision areas, as shown in Figure - 16, should provide a conceptual design for the
completion of the wells. However, this design process normally is initiated on the basis of data
from exploration wells and considerable uncertainty may exist as to the validity and accuracy of
that data. Thus a number of alternative designs for well completions will normally be selected
and retained as a contingency.
Figure - 16: Completion Design Strategy
Basically there are three main methods of completing a well which are:
1- Open-hole completion
2- Cased-hole completion
3- Liner completion; this completion can be include two types:
23
Production Engineering – I Herish N. Hamarash
a- Screen and liner completion.
b- Perforated liner completion.
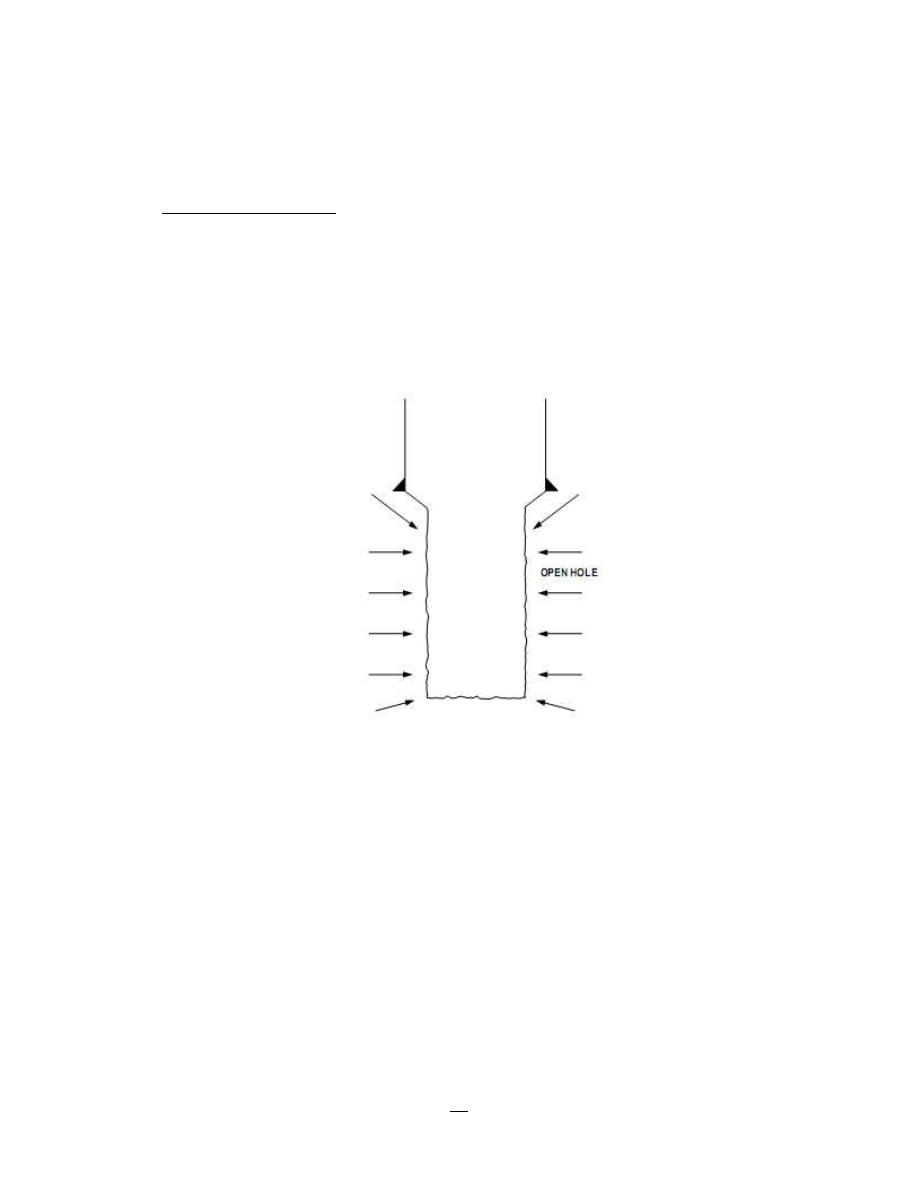
1- Open-hole Completion:
The simplest approach to bottomhole completion would be to leave the entire drilled
reservoir section open after drilling, the production casing is set on top of producing zone
before drill the production formation that contain the hydrocarbon fluids, then after
casing was cemented, producing formation drilled, see figure - 17. Generally open-hole
has greater application in carbonate zones.
Figure - 17: Open-hole Completion
Advantages;
1- Adaptable to special drilling techniques to minimize formation damage or to prevent
lost circulation into the producing zone.
2- No perforating expense.
3- Log interpretation is not critical since entire interval is open
4- Full diameter opposite pay.
5- Can be easily deepened.
6- Easily converted to liner or perforated completion
24
Production Engineering – I Herish N. Hamarash
Limitation;
1- Excessive gas or water production difficult to control.
2- Selective critical section in production zone to fracturing or acidizing more difficult.
3- May require frequent well-bore cleanout.
4- Requires more rig time on completion
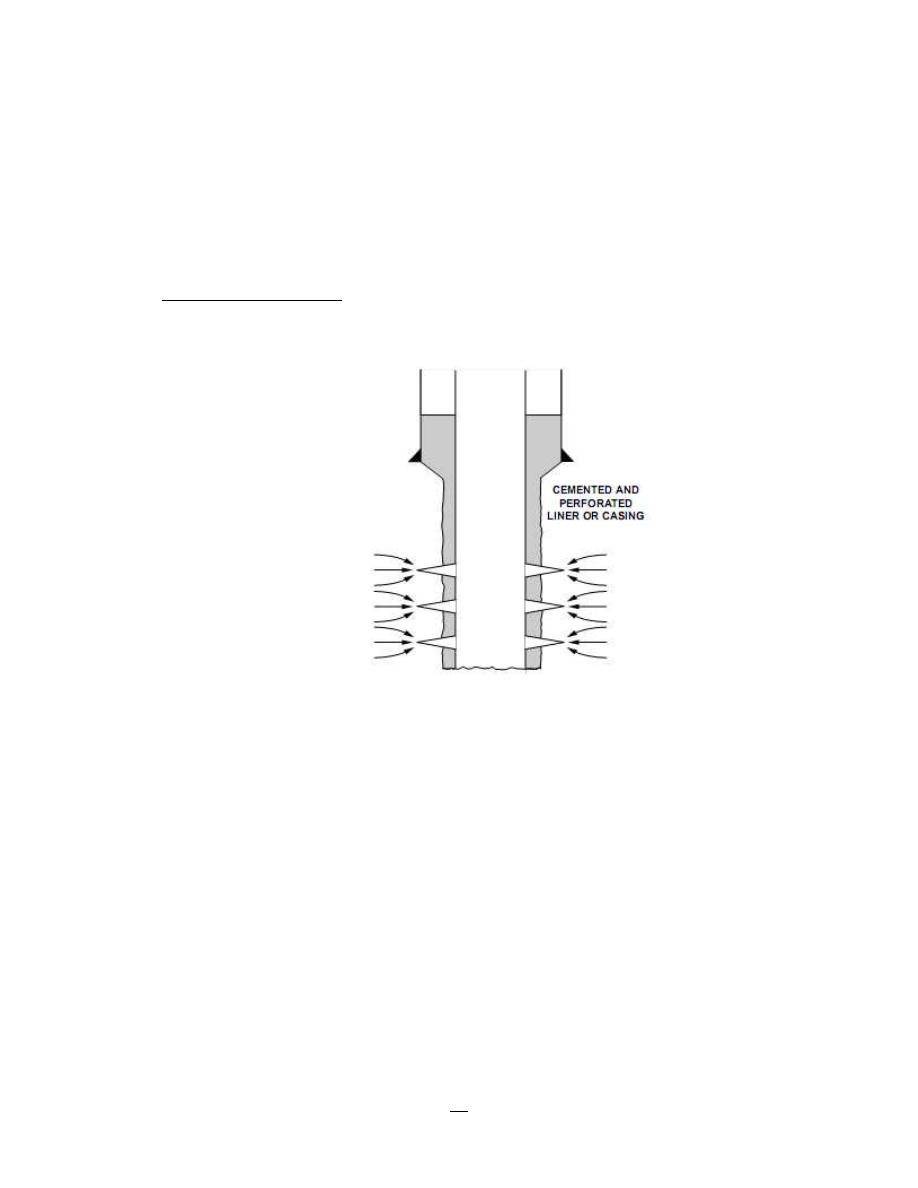
2- Cased-hole completion:
The production casing is cemented through producing zone and perforated, see figure - 18.
Figure - 18: Cased-hole Completion
Advantages;
1- Excessive gas or water production can be controlled more easily.
2- Can be selectively stimulated.
3- Log and formation samples available to assist in decision to set casing or abandon.
4- Full diameter opposite pay.
5- Can be easily deepened.
6- Will control most sand, and is adaptable to special sand control techniques.
7- Adaptable to multiple completion techniques.
8- Minimum rig time on completion.
Limitation;
1- Cost of casing cement and perforating for long zones may be significant.
2- No adaptable to special drilling techniques to minimize formation damage.
3- Log interpretation is critical for most of logs except production logging.
25
Production Engineering – I Herish N. Hamarash
Well productivity is less than productivity of open-hole well completion.
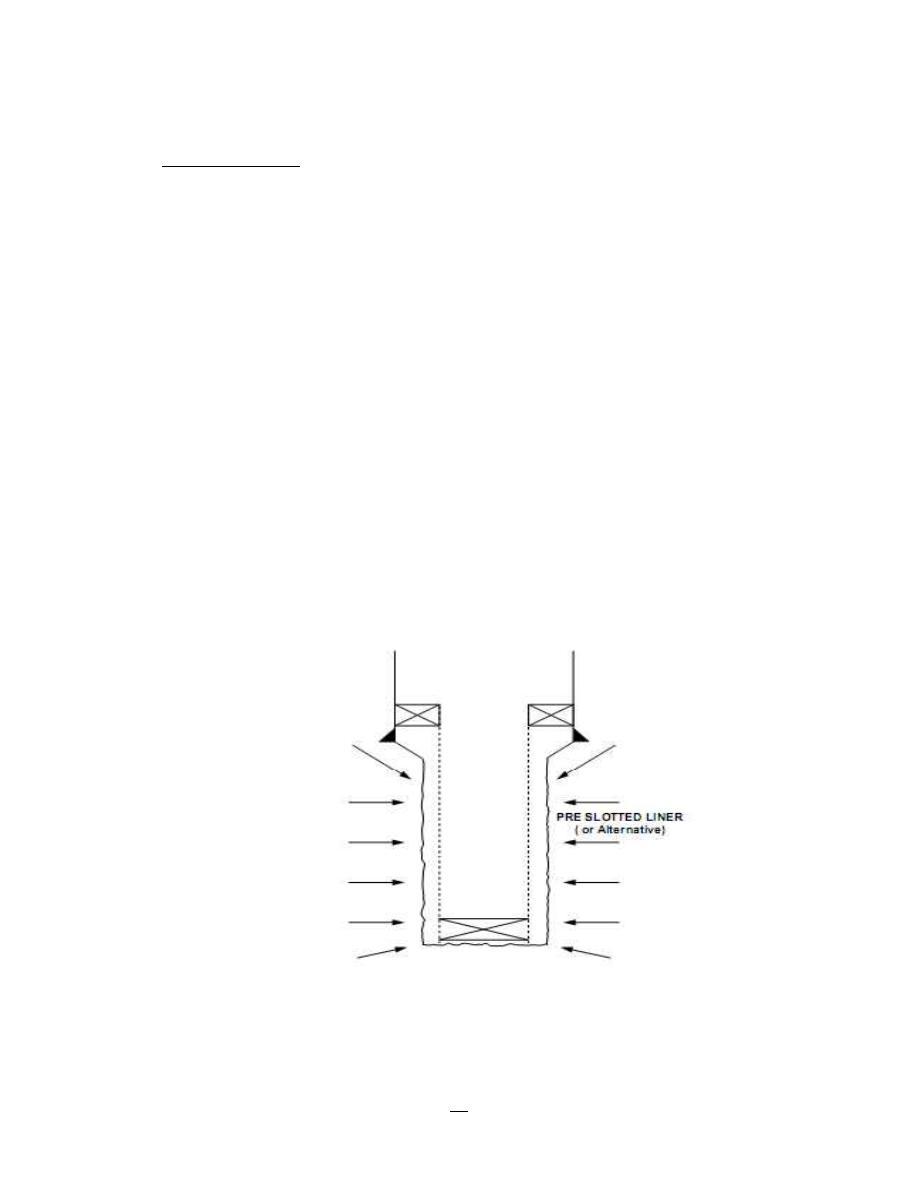
Liner completion:
I.
Screen and Liner completion.
The production casing is set on top of producing zone, than the screen and the liner is set through
producing zone, see figure - 19.
Advantages;
1- Adaptable to special drilling techniques to minimize formation damage or to prevent
lost circulation into the producing zone.
2- No perforating expense.
3- Log interpretation is not critical since entire interval is open
4- Do not require frequent well-bore cleanout.
5- Will control most sand, and is adaptable to special sand control techniques.
Limitation;
1- Excessive gas or water production difficult to control.
2- Selective critical section in production zone to fracturing or acidizing more difficult.
3- Wellbore deepened is not easy.
4- Requires more rig time on completion.
Figure - 19: Liner Completion

26
Production Engineering – I Herish N. Hamarash
II.
Perforated Liner completion
The production casing is set on top of producing zone, then the producing zone was drilled after
that the liner is set and cemented through producing, then perforated, see figure - 18.
Advantages;
1. Adaptable to special drilling techniques to minimize formation damage or to prevent
lost circulation into the producing zone.
2. Gas and water production easy to control.
3.
Selective critical section in production zone to fracturing or acidizing more easy.
4. Can be easily deepened.
5. Will control most sand because the liner obstructed sand movement, and is adaptable to
special sand control techniques.
Limitation;
1- Cost of casing cement and perforating for long zones may be significant.
2- Log interpretation is critical for most of logs.
3- Requires more rig time on completion.
4- Difficult conduct good cement operations for liner compare with the first stage of
casing cementing.
27
Production Engineering – I Herish N. Hamarash
SELECTION OF THE FLOW CONDUIT BETWEEN THE RESERVOIR
AND SURFACE
There are a number of optional methods by which fluid which enters the wellbore will be allowed
to flow to surface in a production well, or to the formation in an injection well. In the selection of
the method, a range of considerations may influence the choice including: cost, flow stability,
ability to control flow and ensure well safety or isolation; ensuring that the integrity of the well
will not be compromised by corrosion or erosion. In the case of multizone reservoir, the zonal
characteristics will determine to a large extent the flow system selected.
However, for a single zone completion, the following alternatives exist:
Tubingless casing flow.
Casing and tubing flow.
Tubing flow without annular isolation.
Tubing flow with annular isolation.
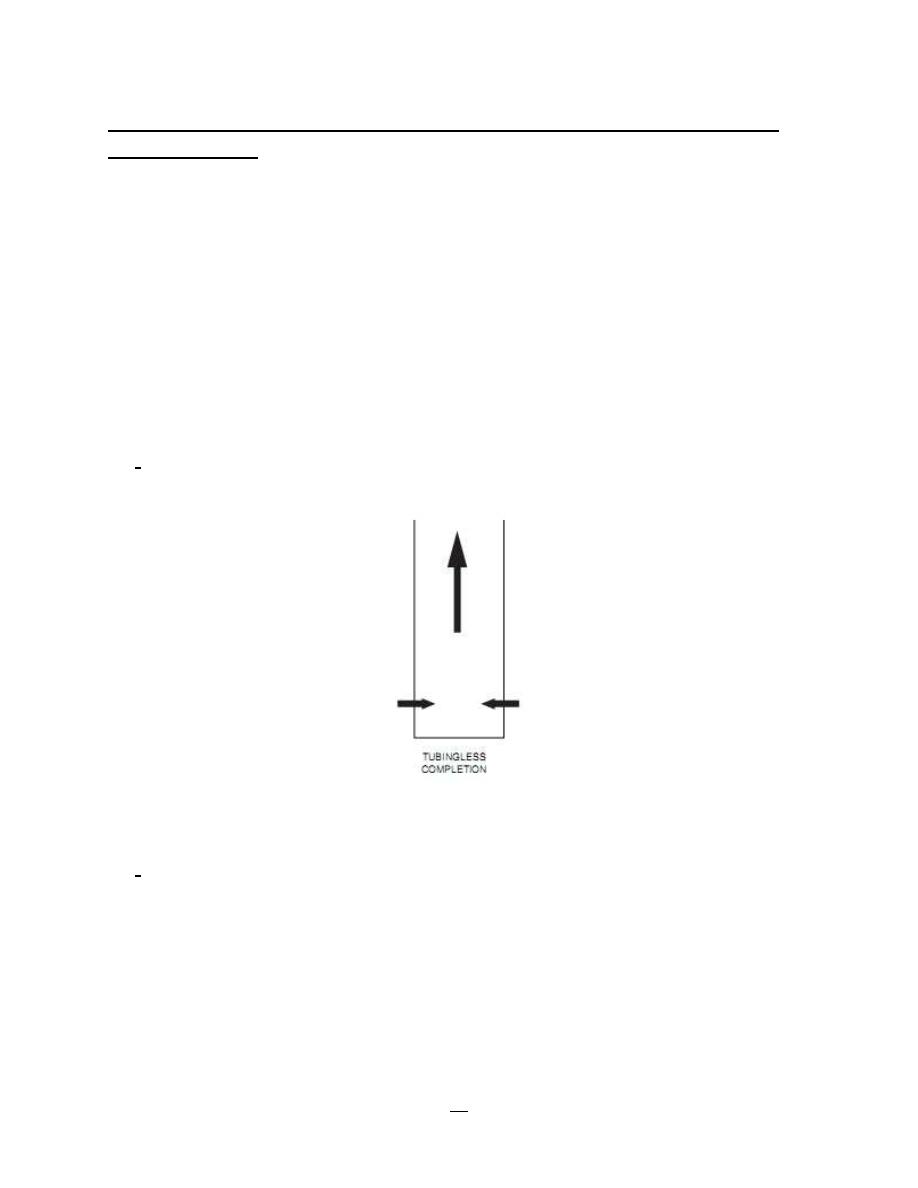
-
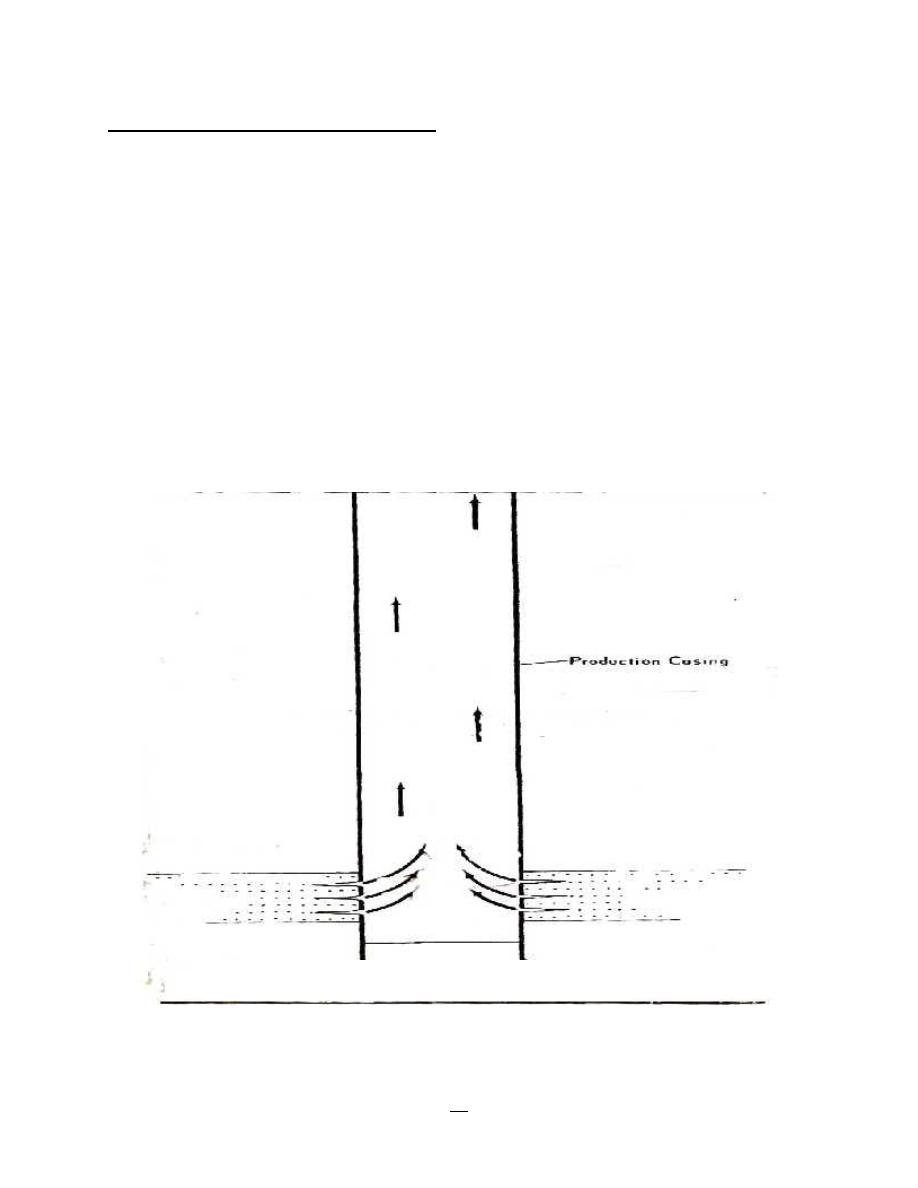
Tubingless Casing Flow: This type of completion use in wells produces with high
production rates and medium or low closed, flowing pressures. See figure - .20
Figure - 20: Tubingless Completion
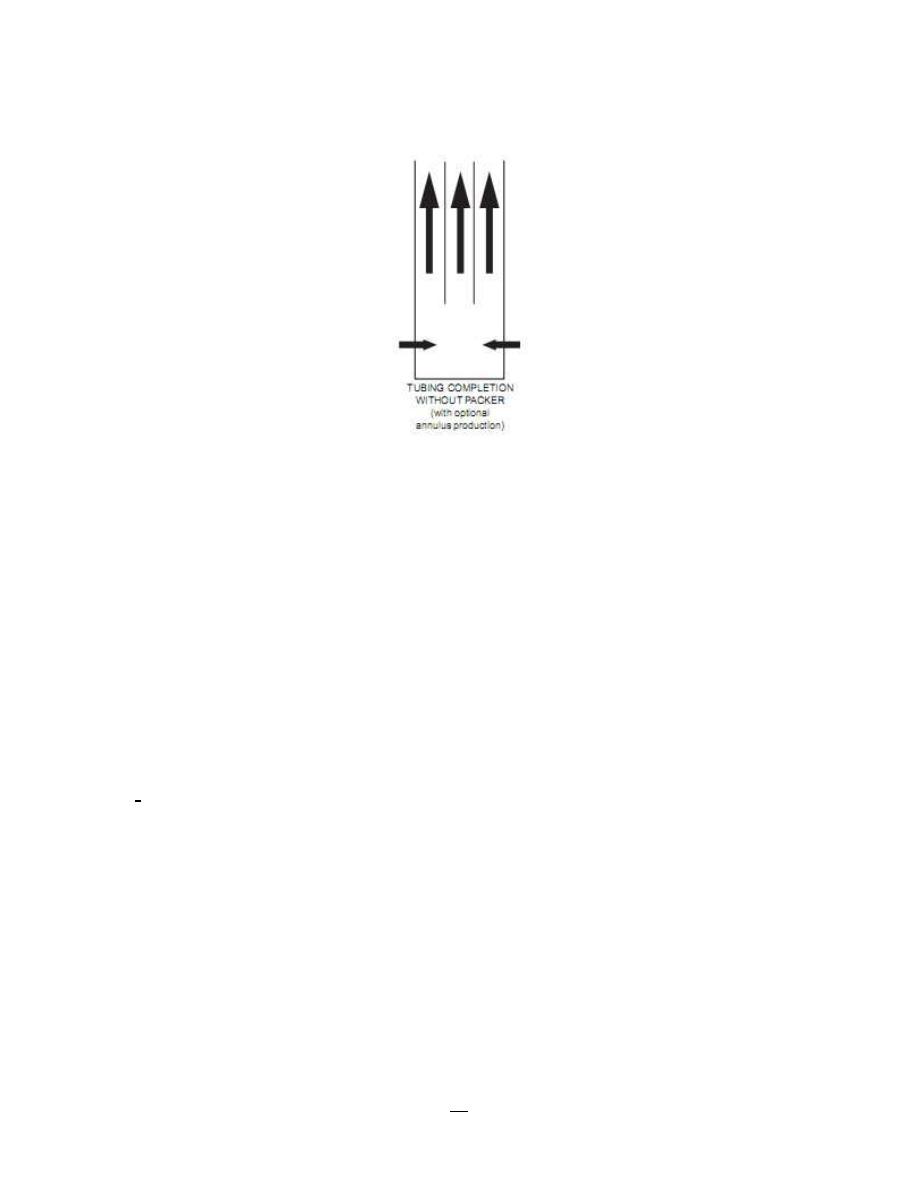
-
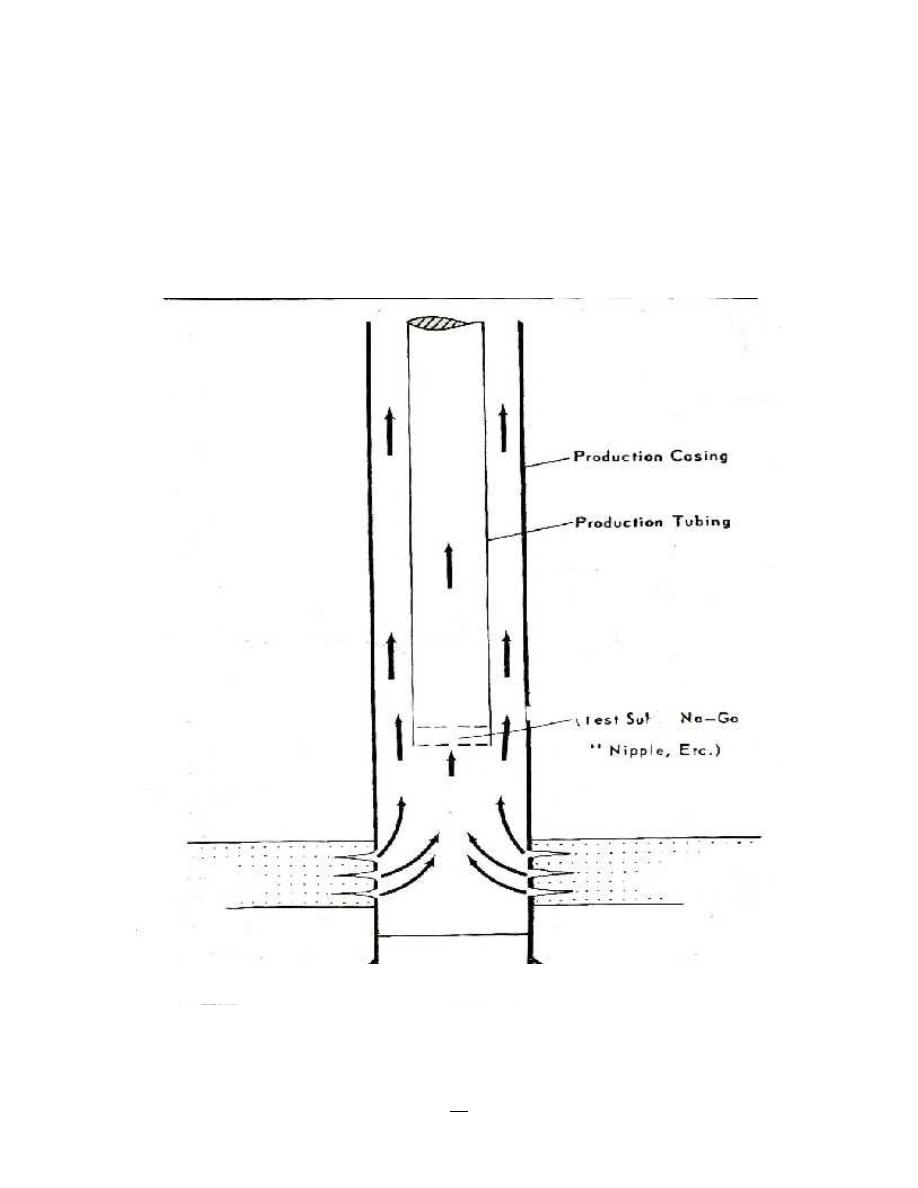
Casing and Tubing Flow: In this type of completion the well produce through annulus
and tubing in same time, but the production rate in this type being less than in type of
producing through production casing. See figure - 21. Valid reasons for tubing may
include:
1- Better flow efficiency.
2- Permit circulation of kill fluids, corrosion inhibitors or paraffin solvents.
3- Provide multiple flow paths for artificial lift system.
4- Protect casing from corrosion, abrasion, or pressure.
28
Production Engineering – I Herish N. Hamarash
5- Provide indicate of monitoring bottom-hole flowing pressure.
Figure - 21: Casing and Tubing Flow
Tubing Flow without Annular Isolation: In situations where annular flow in a casing-string
completion would result in excessive phase slippage with consequent increased flowing pressure
loss and potential instability, the consideration could be given to merely closing the annulus at
surface and preventing flow. However, in reservoirs where the flowing bottomhole pressure is at
or below the bubble point, gas as it flows from the formation to the tubing tailpipe will migrate
upwards under buoyancy forces and some gas will accumulate in the annulus. This will result in
an increase in the casing head pressure at surface. In this type of completion the casing is
exposed continuously to produce fluid with the possibilities of erosion or corrosion. This,
coupled with the potential for annular heading, suggests that unless annular flow is required then
the annulus should not be left open to production, despite its simple design.
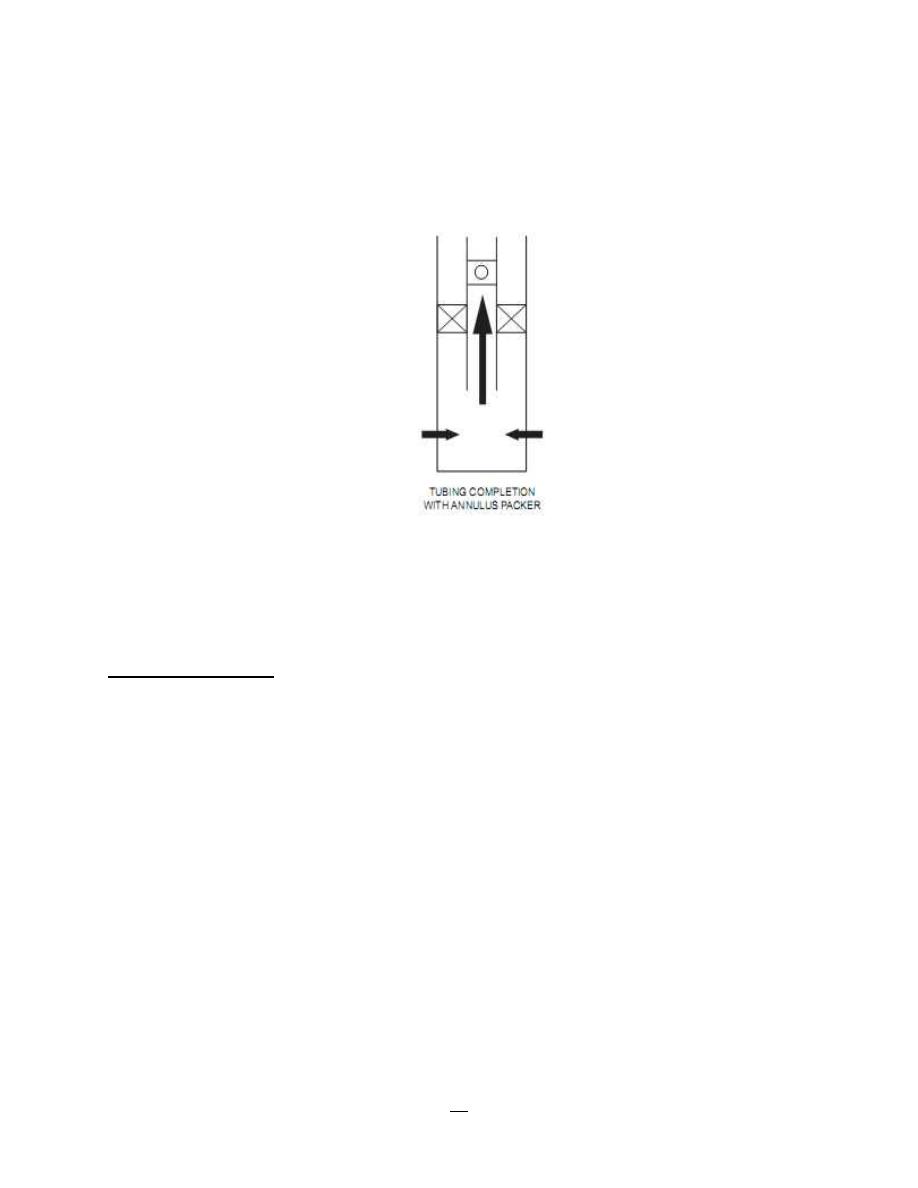
-
Tubing Flow with Annulus Isolation: For cases where a large cross sectional area for
flow is not necessary, then an open annulus can cause complications as discussed in 2.3
above. Therefore, in the majority of cases where tubing flow will take place, the annulus
is normally isolated by the installation of a packer. The packer has a rubber element which
when compressed or inflated will expand to fill the annulus between the tubing and the
casing. The packer is normally located as close to the top of the reservoir as possible to
minimize the trapped annular volume beneath the packer and hence the volume of gas
which could accumulate there. However, if the packer is installed, the ability to U-tube or
circulate fluid between the tubing and annulus is removed. If such a circulation capability
is required then it is necessary to install a tubing component which will allow annulus
communication or alternatively rely upon the ability to perforate the tubing which
consequently would necessitate tubing replacement prior to the recommencement of
29
Production Engineering – I Herish N. Hamarash
production. In both cases, the circulation point is normally as deep in the well as possible,
but above the packer. This completion system is by far the most widely used and offers
maximum well security and control. See Figure - 22 bellow:
Figure - 22: Tubing Flow with Annulus Isolation
Completion String
For any completion string we can define a range of operations or capabilities which may be
required. Some of the capabilities are considered to be essential, such as those providing
operational security or safety, whilst others can provide improved performance or flexibility.
However, as the degree of flexibility provided by the completion is increased, the more complex
is the design process and normally a sophisticated design will result which includes a large number
of string components.
Basic completion string functions and facilities
The basic facilities provided by a completion string must allow it to continue the production or
injection of fluids over as long a period as possible without major intervention to conduct well
repairs. Further, at all times, the design must ensure the safe operation of the well and reliably
allow for its shutdown in a variety of situations.
The completion string, production casing and wellhead must act as a composite pressure system
which prevents formation fluids and pressure escaping from the reservoir except via the production
tubing and the Xmas Tree into the surface processing facilities.
The following are considered to be the essential attributes for the majority of completion string
installations:
30
Production Engineering – I Herish N. Hamarash
A. The ability to contain anticipated flowing pressure and any hydraulic pressures
which may be employed in well operations and conduct fluid to surface
(production) or the reservoir (injection wells) with minimal flowing pressure loss
and optimal flow stability.
B. The ability to isolate the annulus between the casing and the production tubing if
flow instability is likely or it is desirable to minimize reservoir fluid contact with
the production casing.
C. The ability to affect downhole shut-in either by remote control or directly activated
by changing well flowing conditions, in the event that isolation at surface is not
possible.
D. A means to communicate or circulate (selectively when required) between the
annulus and the tubing.
E. A provision for physical isolation of the tubing by the installation of a plug to allow
routine isolation e.g. for pressure testing of the tubing.
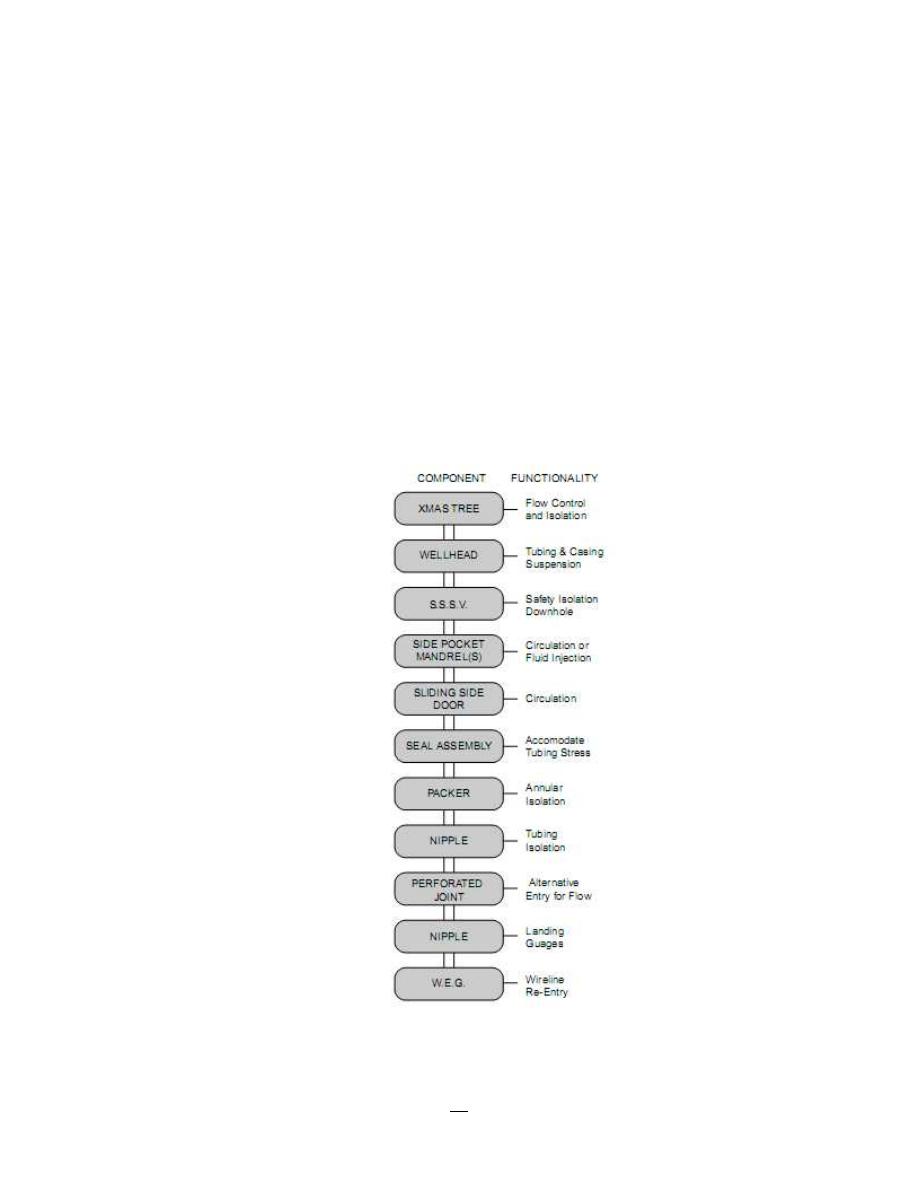
Figure - 23 bellow is showing the general completion string components:
Figure - 23: General well completion string
31
Production Engineering – I Herish N. Hamarash
Conventional tubular configurations
:
The conventional completions methods consist of production casing have outside diameter
greater than 4 ½ inch, and include this is because that there are sizes production tubing vary to
reach 4 ½ inches;
Single-zone completion
Factors leading to selection of single-zone “conventional” completions:
1- High production rates.
2- Corrosive well fluids.
3- Operator tradition.
4- High pressures governmental policies.
Probability of well competition for single-zone depending on objectives from well drilling, and
that include:
Well produce through production casing
This type of completion use in wells produce with high production rates and medium or low closed,
flowing pressures. See figure - 24:
Well produce through production casing and production tubing
Figure - 24: Well produce through production casing
32
Production Engineering – I Herish N. Hamarash
In this type of completion the well produce through annulus and tubing in same time, but the
production rate in this type being less than in type of producing through production casing. See
figure - 25. Valid reasons for tubing may include:
6- Better flow efficiency.
7- Permit circulation of kill fluids, corrosion inhibitors or paraffin solvents.
8- Provide multiple flow paths for artificial lift system.
9- Protect casing from corrosion, abrasion, or pressure.
10- Provide indicate of monitoring bottom-hole flowing pressure.
Figure – 25: Well produce through production casing and production tubing
33
Production Engineering – I Herish N. Hamarash
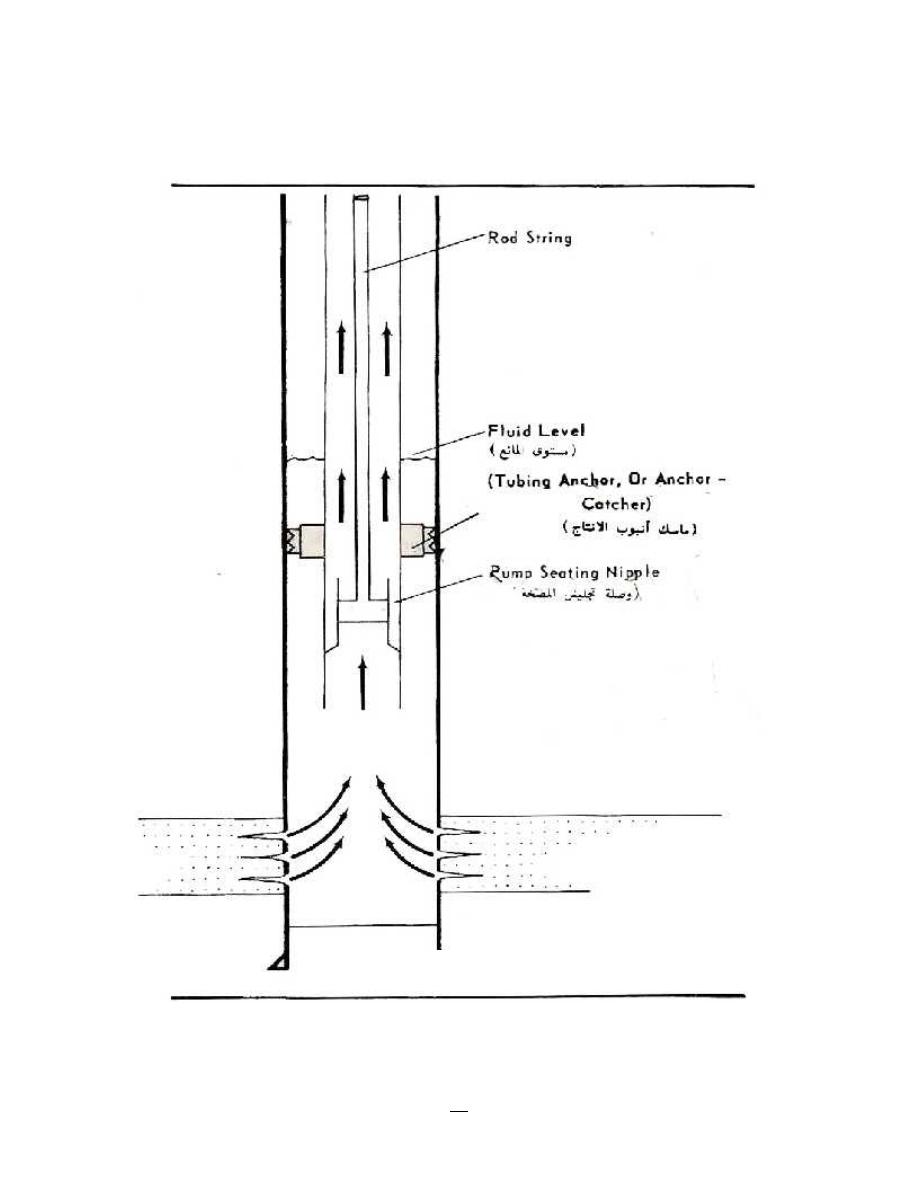
Well produce by artificial lift
In this type the well produce by pumping, where the tubing run in hole with pump seating nipple
to depth below working fluid level in well, see figure - 26.
Figure - 26: Well produce by pumping
34
Production Engineering – I Herish N. Hamarash
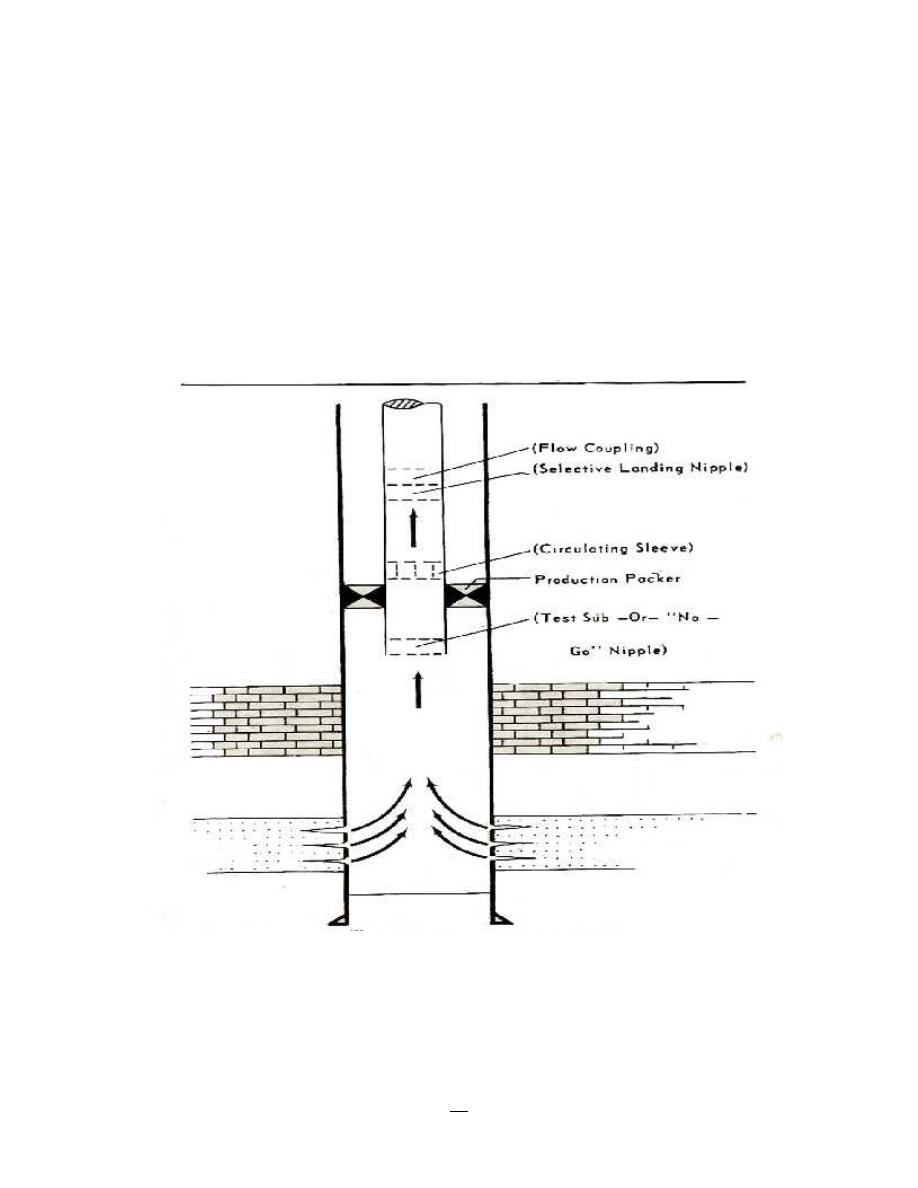
Well produce through production tubing
The well completed by using tubing and single production packer, in this completion the maximum
potential of well to produce by high flow rate impossible, compare with the well produce through
production casing and the well produce through production casing and production tubing, see
figure - 27. A packer should be run only where it accomplishes a valid objective such as:
1- Improve or stabilize flow.
2- Protect casing from well fluids or pressure however, it should be recognized that use of a
packer may increase pressure on casing in the event of a tubing leak.
3- Contain pressure in conjunction with an artificial lift system or safety shut-in system.
4- Hold on annular well-killing fluid.
Figure - 27: Well produce through production tubing
35
Production Engineering – I Herish N. Hamarash
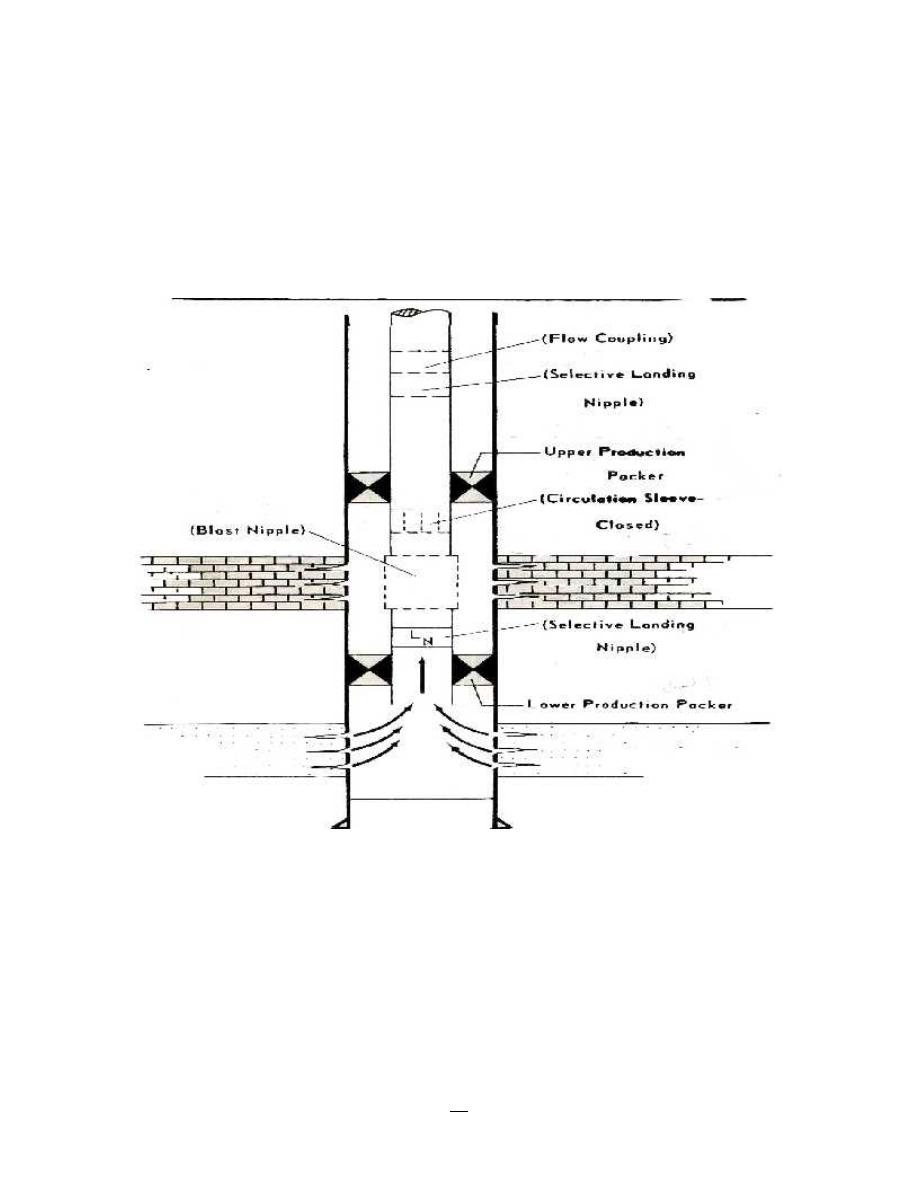
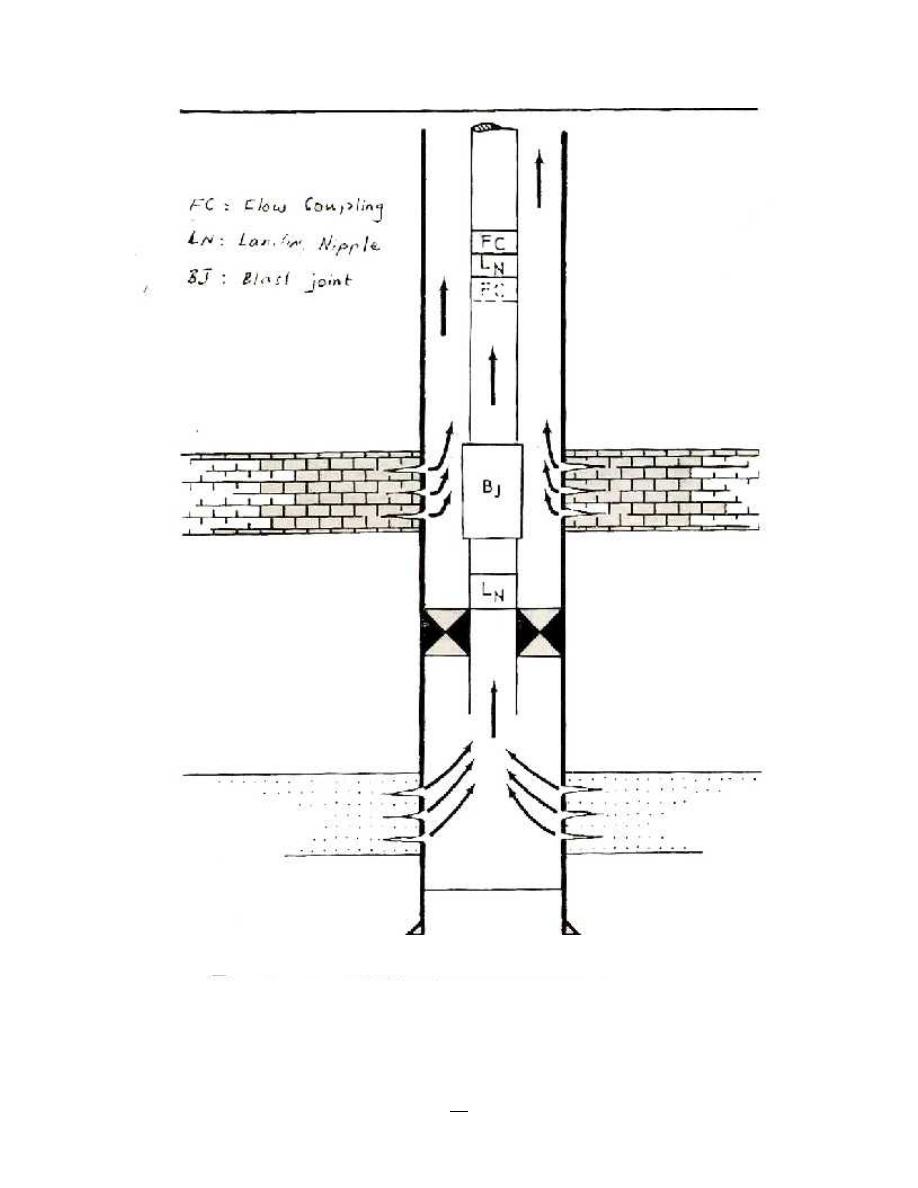
Single- well with alternate completion
This type is used, when the well penetrate two producing formations. The alternate produce
formation perforation at the primary well completion, then isolate by using dual production packer,
the alternate formation started to produce after the lower producing formation depleted by
perforating the part of tubing in front of alternate formation, see figure - 28. Blast joint used in
tubing part in front of alternate producing formation to resist the scratch that cause by produce
fluids, because the blast joint have thick wall.
Figure - 28: Single- well with alternate completion

36
Production Engineering – I Herish N. Hamarash
Multiple-zone completion
Factors leading to selection of multiple completions:
1- High producing rate
2- Faster payout
3- Multi-reservoir control equipments
Numerous configurations are possible utilized single or multiple strings of tubing;
Dual completion-Single string-single packer
There is both tubing and annulus flow, see figure - 29. This is the lowest cost conventional dual.
Limitations
1- Upper zone cannot be produced through tubing, unless lower zone is blanked off.
2- Casing subject to pressure and corrosion.
3- Only lower zone can be artificially lifted.
4- Upper zone sand production may stick tubing.
5- Work-over of upper zone requires killing lower zone.
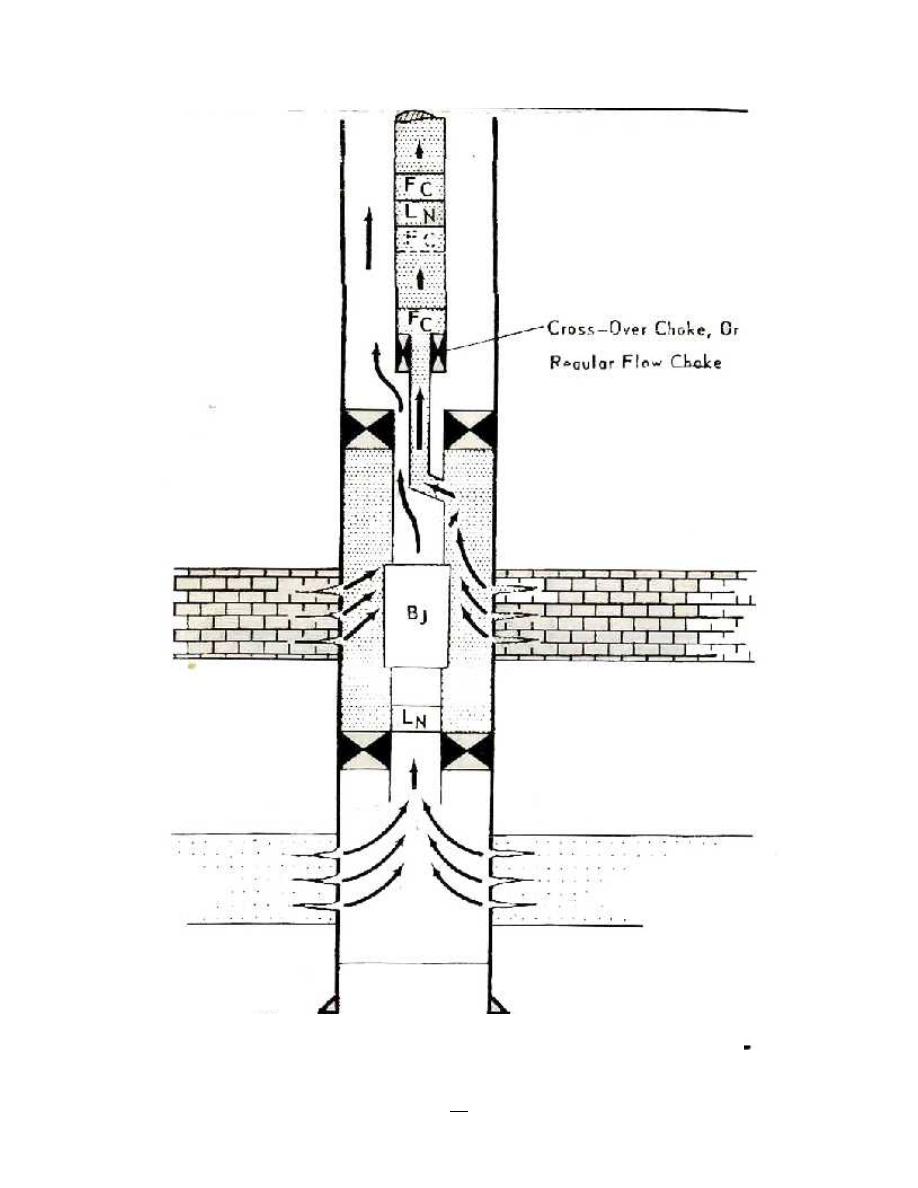
Cross-over dual completion-Single string-dual packer
Again, There is both tubing and annulus flow, see figure -30. Advantage is that cross-over choke
permits upper zone to be flowed through tubing.
Limitations
1- Casing subject to pressure and corrosion.
2- Must kill both zones for work-over of upper zone.
3- Any zones impossible can be artificially lifted.
37
Production Engineering – I Herish N. Hamarash
Figure - 29: Dual completion-Single string-single packer
38
Production Engineering – I Herish N. Hamarash
Figure – 30: Cross-over dual completion-Single string-dual packer
39
Production Engineering – I Herish N. Hamarash
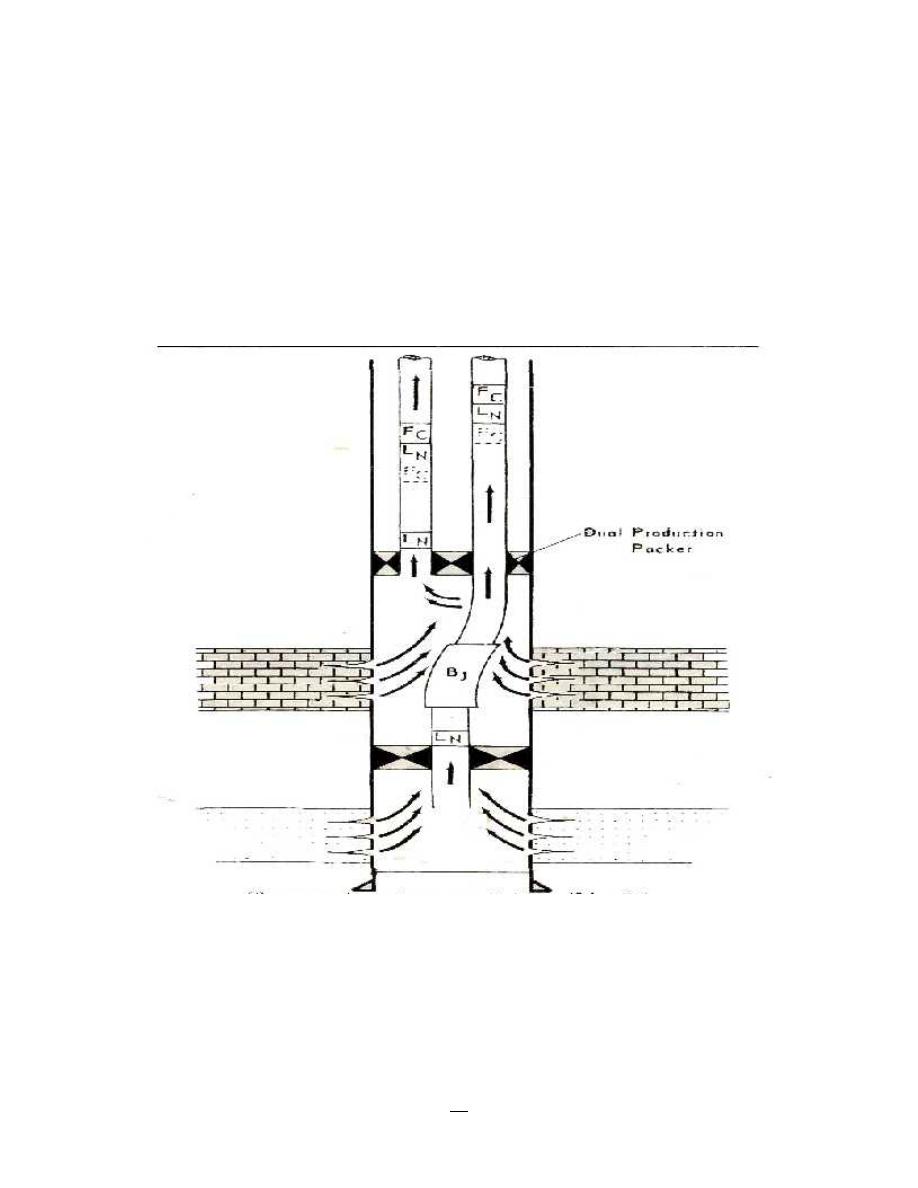
Dual completion-Parallel string-multiple packer
This is shown in figure - 31.
Advantages
1- Can lift several zones simultaneously.
2- Concentric tubing and wire line work-over practical in all zones.
Limitations
1- High cost.
2- Susceptibility to tubing and packer leaks.
3- Hesitation to perform stimulation treatments or work-over of individual zones.
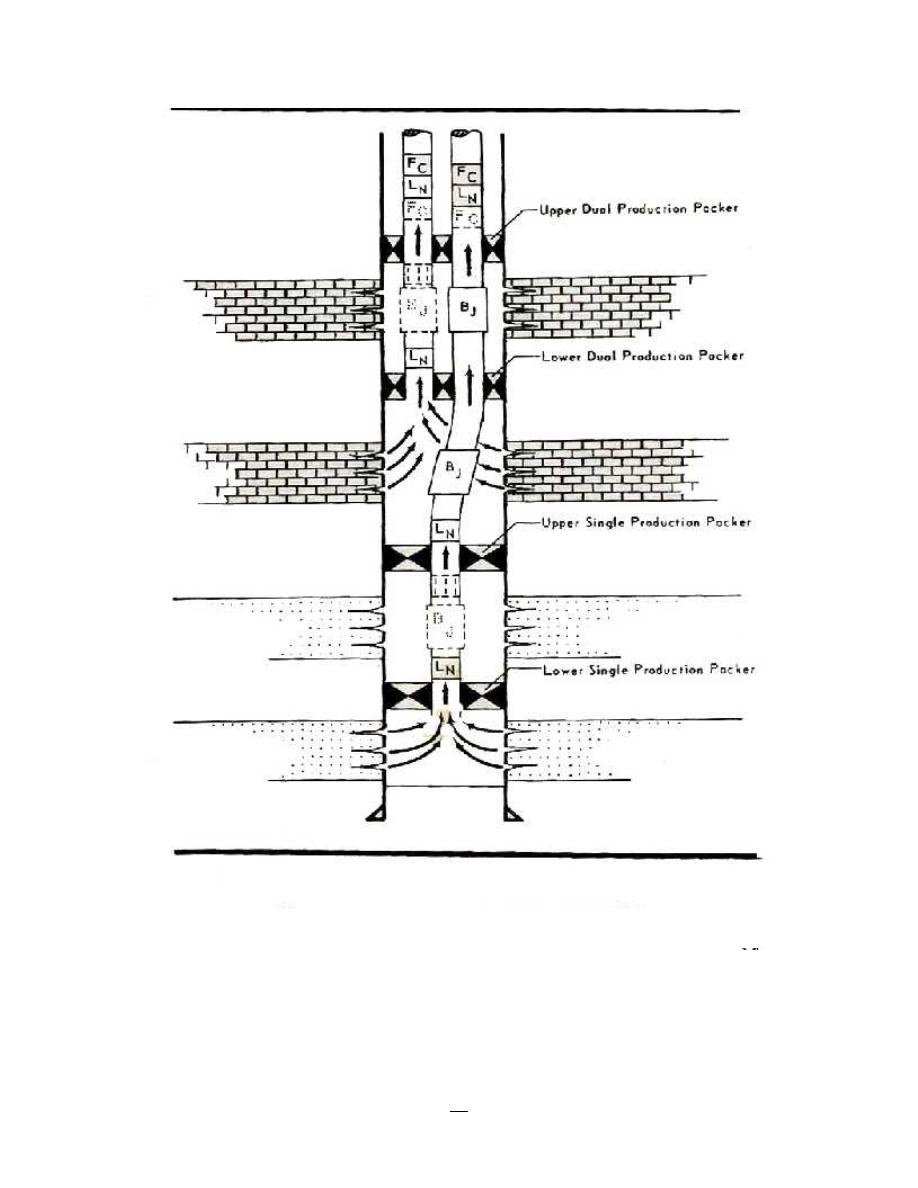
Parallel dual completion with two alternate completions.
This is shown in figure - 32.
Limitations
Difficult of treating or even reperforating individual zones unless well is killed and tubing is pulled
Figure - 31: Dual completion-Parallel string-multiple packer
40
Production Engineering – I Herish N. Hamarash
Figure - 32: Parallel dual completion with two alternate completions
41
Production Engineering – I Herish N. Hamarash
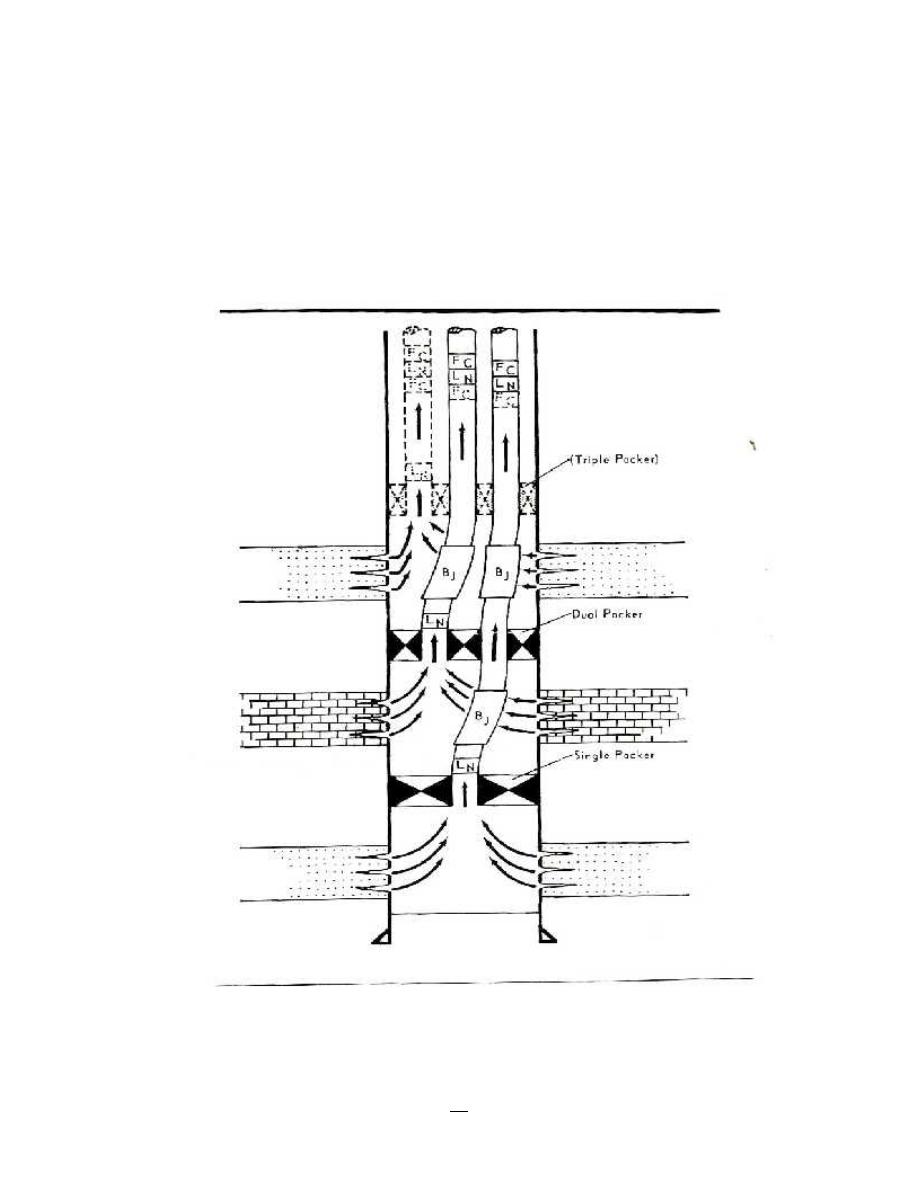
Triple completion
In this completion design, two or three production tubing used with production packers, see figure
- 33. In this type could produce with high production rates in one well, that make faster payout.
Limitations
1- Difficult made this completion.
May be communication occur between the fluids inside well, that produce from the three
formations
Figure – 33: Triple completion

42
Production Engineering – I Herish N. Hamarash
Completion Equipment
1- Production casing
Production casing is the last casing, which runs in hole then seated and cemented. In some
completions design the producing fluids produce through production casing, also run through it
production tubing and production packer. The different types of casing are classified according to
API standard classification. Selecting of casing type depending on completion programmer factors
and operating condition.
2- Production Tubing
The production tubing runs in hole for production and well control purpose, and to run in hole
measurement instrument through it. There are several types of tubing according to standard API.
3- Liner
Liner is part of casing which hanger in well, it doesn’t run from surface. Used to satisfy two
purposes:
1- Reduce the cost, which can be used as alternative to casing run from surface, when the
casing was damaged.
2- Used in sand control and gas coning.
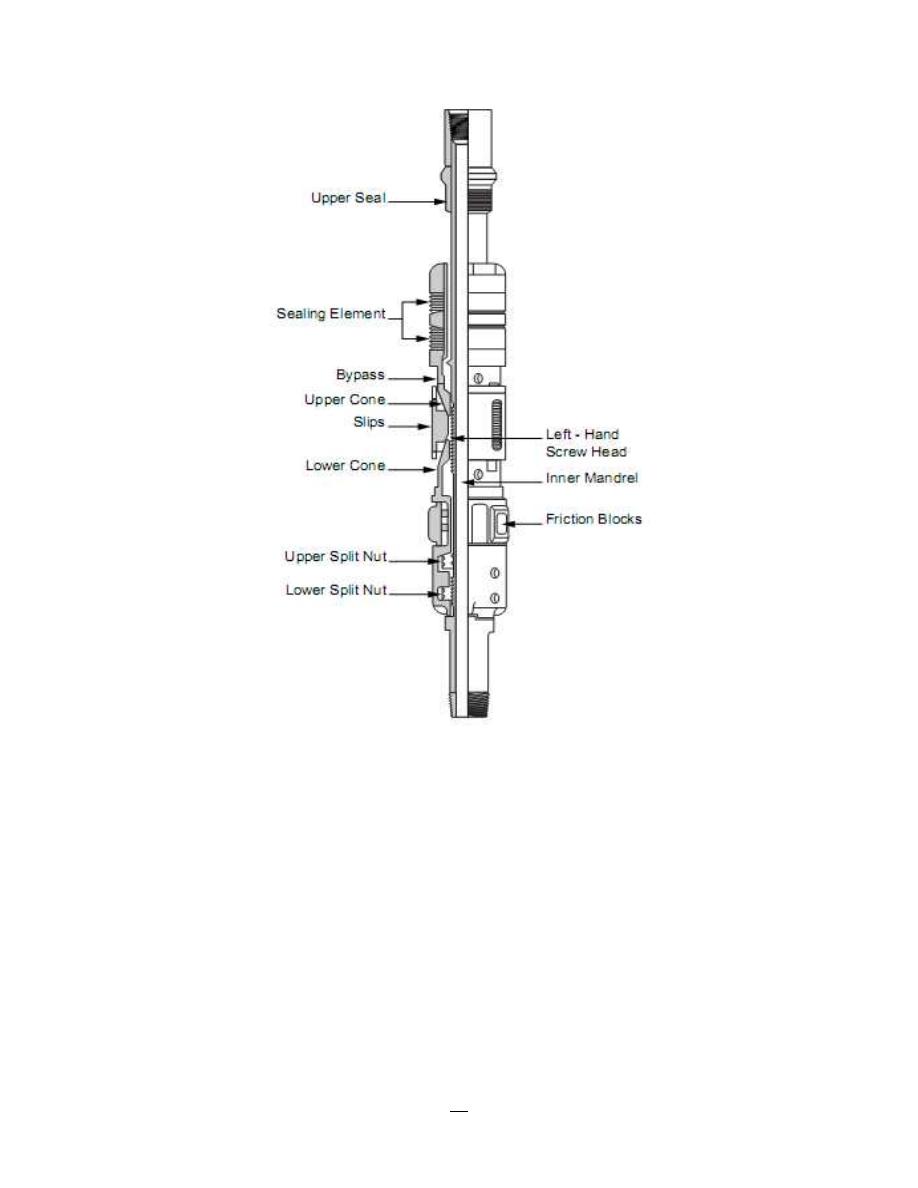
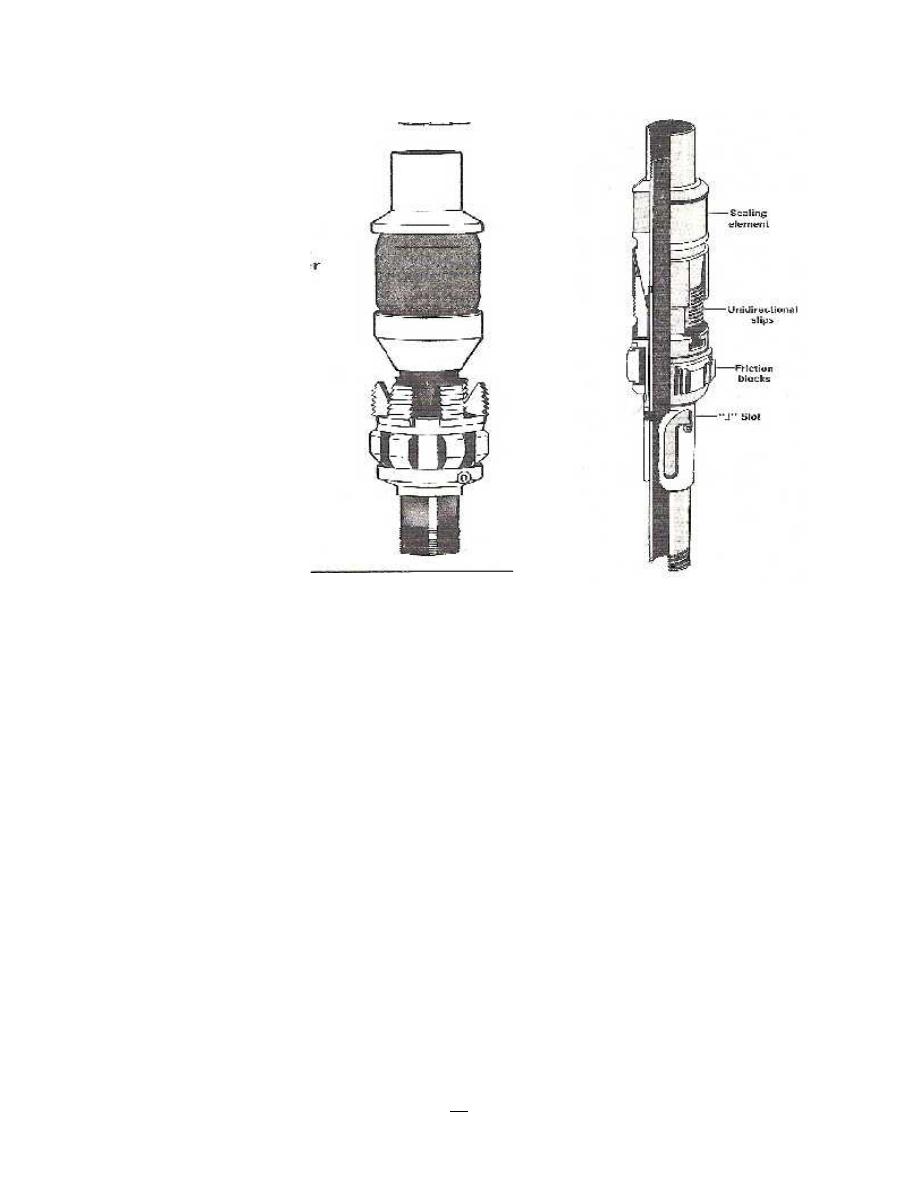
4- Production packer
Generally, production packers are classified into two types; permanent packer (this type could not
pull it out of hole, unless milling it then cleanout) and retrievable packer (this type could pull it
out of hole mechanically and can used it again). The main purpose from using packer is to isolate
the annulus from production zone (see figure –34 for the major components in production packer),
and it is useful to the following matters;
1- Protection the upper parts of casing from high pressure, and from any reaction with the
fluids that cause corrosion of casing in cases of production, injection and stimulation.
2- Protection the well form any leaks occur in casing.
3- Using in conjunction with subsurface safety valves (SSSV) to provide the safety.
4- To hold kill fluids or treating fluids in casing annulus.
43
Production Engineering – I Herish N. Hamarash
Figure - 34: Major Components of Production Packer

44
Production Engineering – I Herish N. Hamarash
5- Sliding Sleeve
Sliding sleeve is a nipple seat above production packer, used to open production tubing above
packer for fluids circulation operations and control on well in work-over operations. This nipple
opened and closed by special tools run in well by slick-line through tubing.
6- Subsurface Control Equipment
This equipment involves:
1- Subsurface safety valves (SSSV) used inside tubing which plug the tubing (close in the
well) at a certain depth in case the surface valves failed. Such as Ball valves and flapper
valves. These valves can control directly and indirectly.
2- Bottom hole-chokes and regulator used to reduce well head flowing pressure to prevent
hydrates (fluid freezing) in surface control equipment and surface flowing lines. This
equipment used in wells has high pressure, such as Ground Seat Bean and Positive Orifice
Bean.
3- Subsurface safety valves (chock valves) for injection wells, this valves used to prevent
reverse flow (back flow, control on flow direction), such as stem and seat valve and ball
valve.
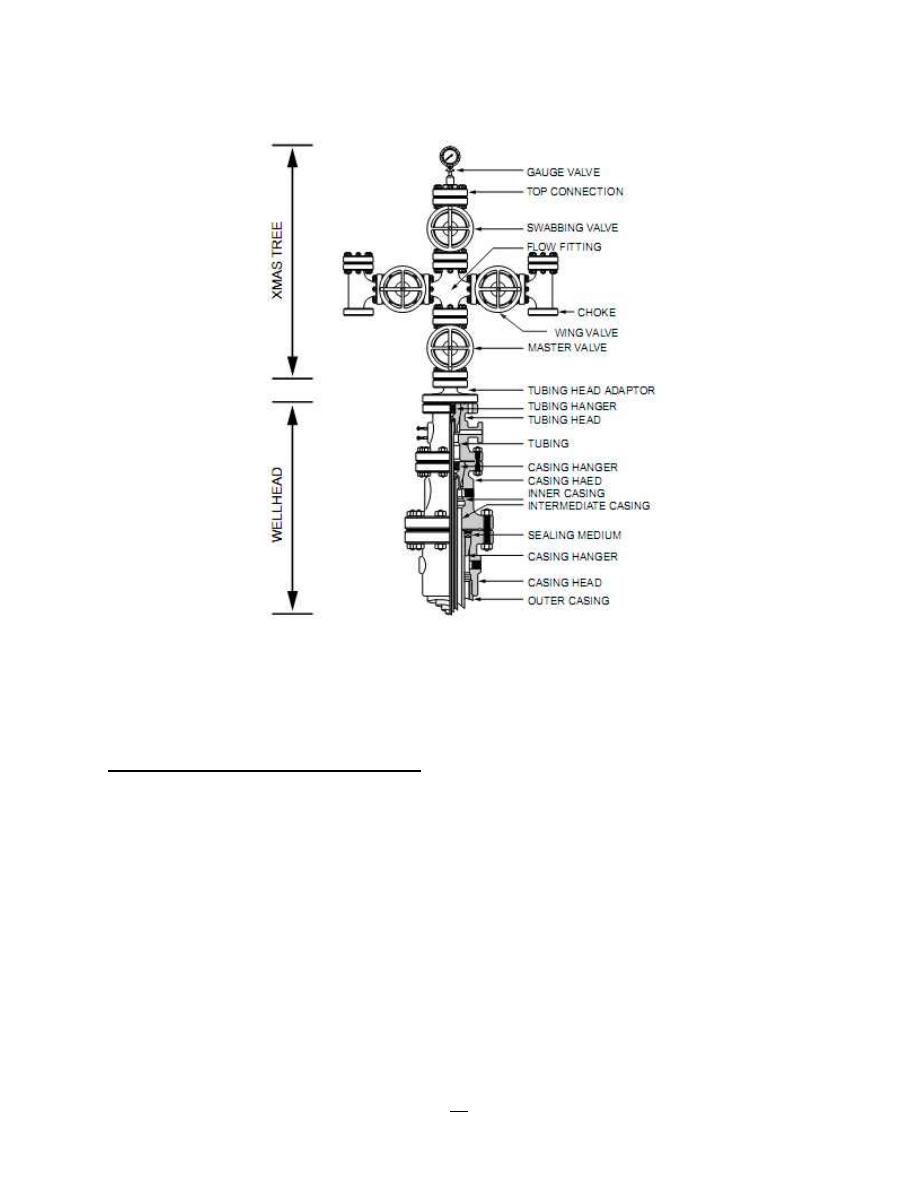
7- Wellhead/Xmas Tree
The wellhead provides the basis for the mechanical construction of the well at surface. It provides
for:
Suspension of all individual casings and tubulars, concentrically in the well.
Ability to install a surface closure/flow control device on top of the well namely:
-
Blow Out Preventer during drilling
-
X-mass tree for production and injection
Hydraulic access to the annuli between casing to allow cement placement and between
the production casing and tubing for well circulation.
The purpose of the Xmas tree is to provide valve control of the fluids produced from or injected
into the well. The Xmas tree is normally flanged up to the wellhead system after running the
production tubing. The wellhead provides the facility for suspending the casing strings and
production tubing in the well. There are a number of basic designs for Xmas trees, one of the
simplest is shown in Figure -35. Briefly, it can be seen that it comprises 2 wing valve outlets,
normally one for production and the other for injection, e.g. well killing. Additionally, the third
outlet provides vertical access into the tubing for wireline concentric conveyancing of wireline or
coiled tubing tools.
The lower valve is the master valve and it controls all hydraulic and mechanical access to the well.
In some cases, the importance of this valve to well safety is so great that it is duplicated. All outlets
have valves which in some cases are manually operated or in the case of sophisticated platform
systems and subsea wellsare remotely controlled hydraulic valves operated from a control room.
45
Production Engineering – I Herish N. Hamarash
Figure - 35: Simple Wellhead Assembly including Casing Spools and Xmas Tree
Production packer setting methods
1- Mechanical setting method
Production packer seated by moving production tubing in a certain direction, based on that there
are three types of packers:
A- Weight-Set Packer
The weight set packer is economical and ideally suited to low pressure situation, this packer
employ a slip and cone arrangement with the slips attached to a friction device such as drag springs
or drag blocks. The friction device engages the casing and holds the slips stationary with respect
to the remainder of the packer, see figure - 36.
The vertical movement of tubing causes the cone to move behind the slips and anchor the packer
in the casing. Tubing weight is then applied to expand the packing element (rubber element).
Release is affected by picking up tubing weight to pull the cone from behind the slips.
46
Production Engineering – I Herish N. Hamarash
Figure -36: Weight set packer
B- Tension-Set Packer
Tension packers are frequently used in shallow wells where insufficient tubing weight is available
to seal a weight-set packer. It are essentially set by pulling tension on the tubing by run the tubing
upside, release is effected by supply tension (run downside the tubing weight).
This features renders the tension packer particularly suitable for water injection wells or
stimulation work.
C- Rotational -Set Packer
These types of packers are set by rotate the production tubing and supply tubing weight in same
time or by rotate only, Release or back of the packer is effected by rotate the tubing to right
direction. It’s better to use this type in vertical shallow or medium wells.
2- Hydraulic Setting method
The packer with production tubing runs in hole through casing to a certain depth, after that the
packer set hydraulically by supply or increase the pressure gradually inside tubing. There is shear
plug below the packer, which cause pressure increased inside tubing (close tubing end) during

47
Production Engineering – I Herish N. Hamarash
packer setting operation, then it opened by drop steel segment or increased the pressure to critical
value. There is another type of packers, which the tubing closed below packer by steel ball or
equalizing check valve set in special nipple below packer. Principle advantage to use this type is:
the tubing can be landed, Christmas tree installed, and well circulated with a light fluid or gas
before setting the packer to initiate production without swabbing.
3- Electric setting method
By wire-line and electric cable the entire assembly packer is run in hole to the desired setting
depth. An electrically detonated powder charge was exploded inside packer that causes movement
of setting tools which set the packer, then the production tubing run in to engage with packer.
Well Completion Program
Well completion operations beginning after ending well drilling and cementing the production
casing. The well completion operations is very important therefore, it should be take in account all
risk and problems that predicted occurred on well in well completion program, and provide all
important required equipment and tools, these operations done by used drilling or work-over rig,
and sometimes need exist fire man in the location.
We will take simple well completion program for cased hole well to illustrate the operations steps;
1- Run in hole the last casing (production casing), land and cement it. At least wait for 72
hours to dry the cement. then install blow out preventers (BOP`s).
2- Run in hole adequate bit by drilling pipes to clean the well-bore from any residual cement,
also to check the bottom hole (total depth). Circulating the drill mud inside the well to sure
that well-bore be cleaning, then pull out of hole drilling pipes and bit.
3- Run in hole Cement Bond Log (CBL) to check the quality of cementing of production
casing.
4- Run in hole production tubing to bottom hole, then displace drill mud by completion fluid
through tubing until clean the well-bore from drill mud.
5- Observe the well behavior by notice any flow of completion fluid, that take indicate for
any leaks in production casing.
6-
In case of no leaks, and the well behavior is normal (static) after displace the mud, then
the tubing is rise and hang to depth above the highest perforated about 30 meters. After
that the well is observed to insure from the well and pressure stabilized.
7- Removed the BOP`s, and install the tubing head spool (donate).
8- Install X-mas tree and construct the valves, then test the X-mas and valve by work pressure
for time at least 15 minute per valve.
9- Install special perforating equipment on well head, which include pressure control
equipment and container that contain bullet and accessories.
10- Put the bullet gun in container, which the bullet is arranged according to perforating
configuration and with respect to depth of the perforated zone.

48
Production Engineering – I Herish N. Hamarash
11- After set the container on X-mas tree, the master valves is opened then the bullet gun run
in hole to depth of the zone that will be perforated. In perforated operations, the casing
joints are avoided to perforated which the casing joints locater are characterized by run in
hole Casing Collar Locater (CCL) log.
12- The zone will perforate by bomb the bullet from surface by special control station,
generally noticed increased the well head pressure after the perforated of the production
zone.
13- Pull out of hole the bullet gun and accessories to surface and closed the X-mas valves, the
well head pressure continued increased gradually.
14- The well head valves (tubing and annulus valves) linked to burn pipe to burn the fluid in
burn pit.
15- The well opened to flow by small choke size for cleanout purpose, the hydrocarbons fluid
was burned in burn pit that far about 300 meters from the well.
16- The burned of hydrocarbons was continued until the well cleaned from completion fluid or
water or residual drill mud, and the well reached stabilized condition. Then the well closed
and it will be ready to done evaluated tests.

49
Production Engineering – I Herish N. Hamarash
Perforation
Perforating of Oil and Gas Wells
In the majority of completions, once the reservoir has been drilled, production casing or a liner is
run into the well and cemented in place. To provide the communication path between the reservoir
and the wellbore, it will be necessary to produce holes through the wall of the casing, the cement
sheath and penetrate into the formation. This is accomplished by a technique called perforating.
The basic operation requires that a series of explosive charges are lowered into the well either on
an electric conductor (wireline cable), or on tubing or drillstring, and when the charges are located
at the required depth, they are detonated to produce a series of perforations through the wall of the
casing and the cement sheath.
Since the perforations will hopefully provide the only communication between reservoir and
wellbore, it is necessary to carefully design and execute the perforating operation, to provide the
required degree of reservoir depletion control and maximize well productivity/injectivity.
Although technology is available insure good perforating in most wells, unsatisfactory perforating
tends to be rule in many areas. The three most prevalent causes for poor perforating probably are:
1- A lack of understanding of the requirements for optimum perforating.
2- Inadequate control of gun clearance.
3-
The rather widespread practice of a warding perforating job on the basis of price, rather
than job quality.
Perforating Techniques
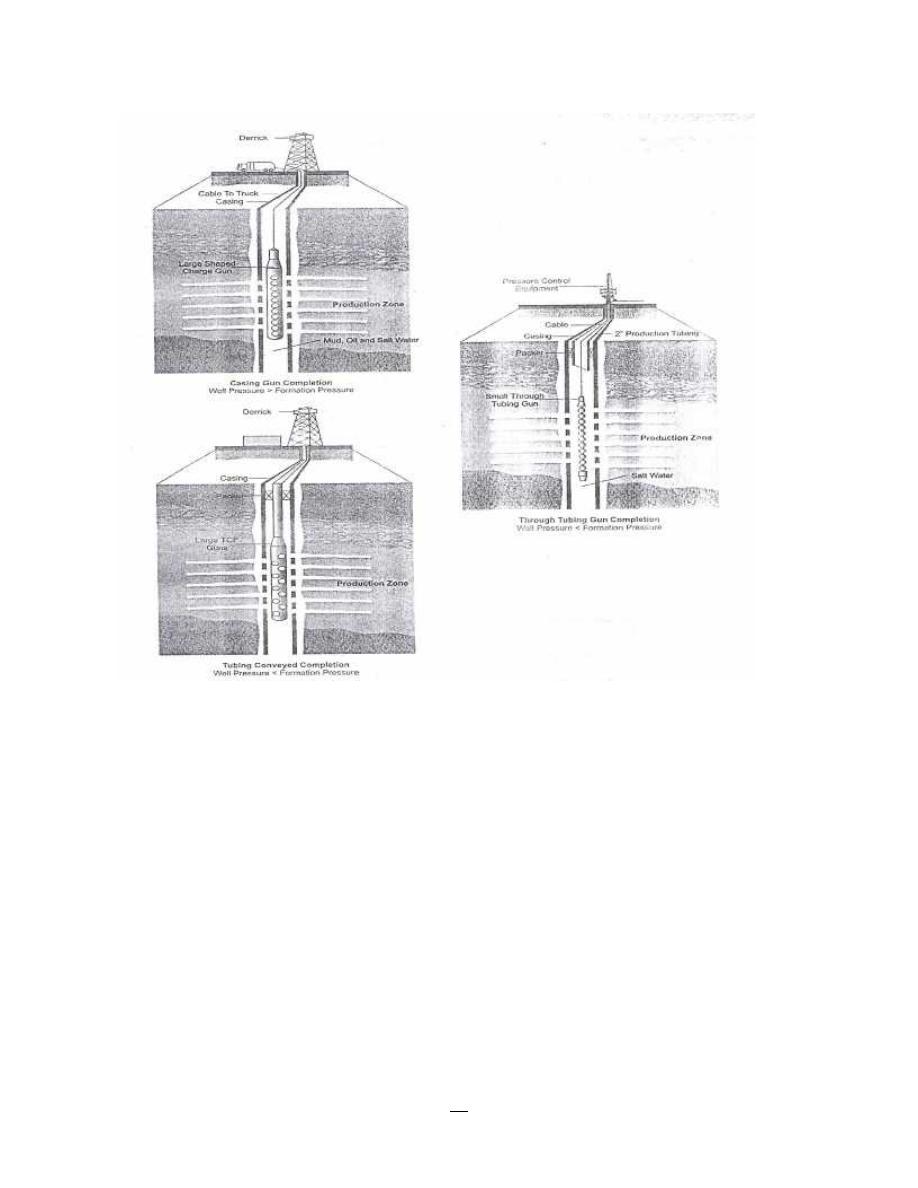
There are three main perforating methods of cased wells:
1- Bullet Perforators
Bullet guns have outside diameter 3 ¼ inch or larger, are applicable in the formation with
compressive strength less than about 6000 psi. Bullet perforators in the 3 ¼ inch or larger size
range, may provide deeper penetration that many jet guns in formations with less than about 2000
psi compressive strength.
This type could not used it through X-mas tree and tubing because the larger size of outsider
diameter of bullet guns, therefore, it used under drill mud control and install BOP`s on well head.
The Bullet guns run in hole by wire-line and connected with electric bomb instrument, when the
bullet is shoot, its velocity reached about 3300 ft/sec and it penetrate the casing and formation to
depth about 5 inch. The bullet loses velocity and energy when the gun clearance exceeds 0.5 inch.

50
Production Engineering – I Herish N. Hamarash
2- Jet perforators
This type characterized small size of Jet guns (2 1/8, 1 11/16 inch), so it could use through X-mas
and production tubing. Therefore, it is the better and more safety method used to perforate the
wells. The bullet consist from a solid metal body moved at a high speed about 20000 ft/sec, which
the solid material convert to liquid because the bomb wave high pressure, that make the bullet
penetrate the casing and formation to depth about 12 inch behind the casing. Bullet density equal
4 bullet/ft of perforated zone.
3- Hydraulic perforators
Used to make a fracture in production casing and the formation behind the casing. The fracture
create hydraulically by inject special liquid with high pressure and high inject velocity through
small choke size (1/4 inch). Sometimes add to inject liquid solid material (like sand) to assist in
penetration of casing and formation.
This method used to penetrate wells that drilled for water injection because this method creating
large perforate, which does not plug easily due to the suspension in the injected water.
See figure - 37 for perforating techniques:
51
Production Engineering – I Herish N. Hamarash
Figure - 37: Perforating Techniques
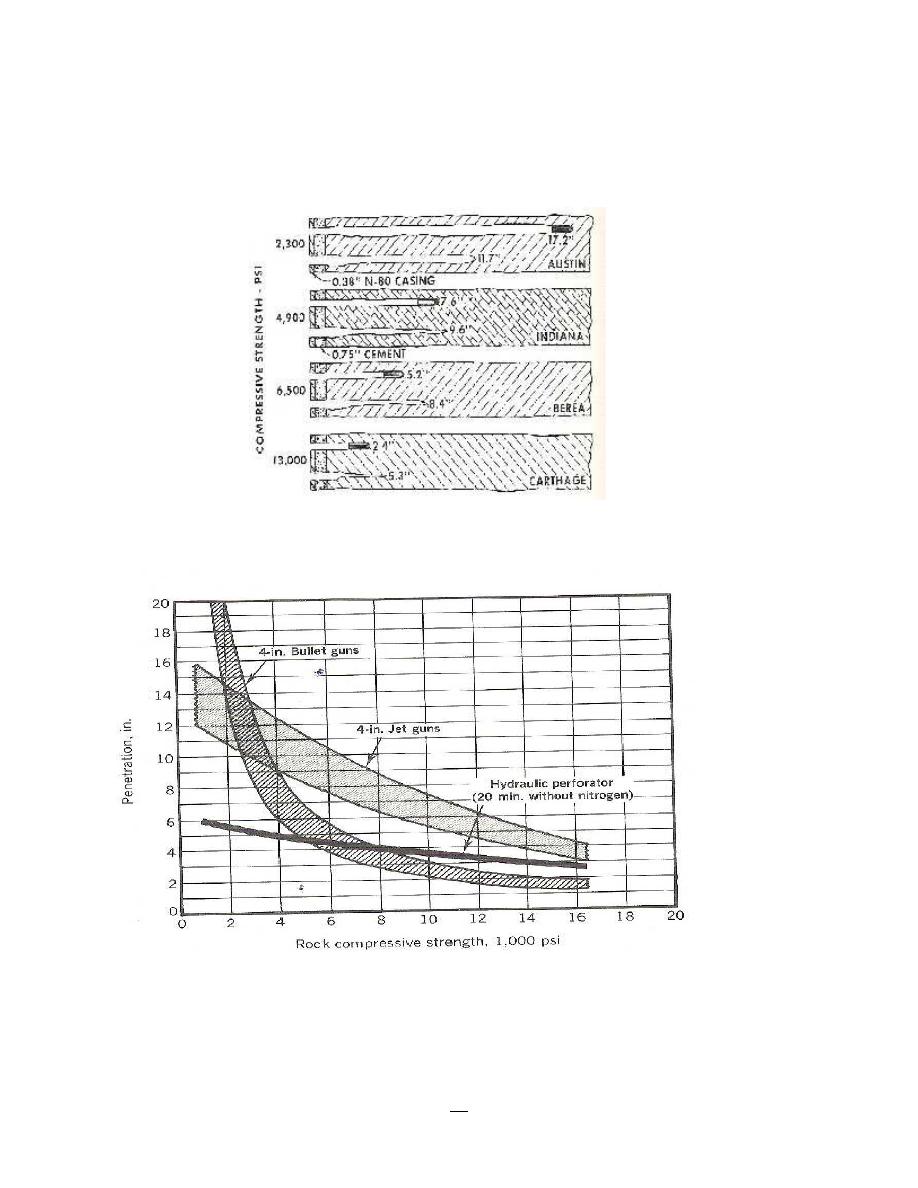
Effect of formation strength on perforator performance
As shown in figure - 38, jets penetrate deeper than bullets in hard formation. However, some best
bullet guns may penetrate deeper than some jets in low compressive strength formations,
particularly if guns are fired at zero clearance.
52
Production Engineering – I Herish N. Hamarash
Figure - 39 shows that penetration of jets, bullets, and hydraulic perforator was reduced with
increased compressive strength of formation penetrated. However, bullet penetration declined at a
more rapid rate as rock strength increased.
Figure - 38: Effect of formation compressive strength on penetration efficiency of bullet and jet
perforators
Figure - 39: Bullet, Jet and Hydraulic perforator performance in formations of various
compressive strength

53
Production Engineering – I Herish N. Hamarash
Perforation Charge Arrangement
In the preparation of a perforation gun, a number of charges are assembled on a carrier such that
upon detonation they will yield a series of perforations into the formation. The arrangement
provides for variation in the number of shots to be fired per unit interval, i.e. the shot density and
the direction in which all, or individual, charges will be shot, i.e. the shot phasing.
The number of shots installed in a perforating gun varies from low shot density, e.g. less than 1
shot/ft, to higher shot densities of up to 16 shots/ft. The lower shot densities are normally adequate
for production in reservoirs of moderate to high productivity or are selected for specific injection
operations where flow control is required. The higher shot densities will provide improved inflow
performance in all reservoirs but may only be significantly beneficial in reservoirs with a low
vertical permeability or where severe local drawdown might give rise to formation sand collapse.
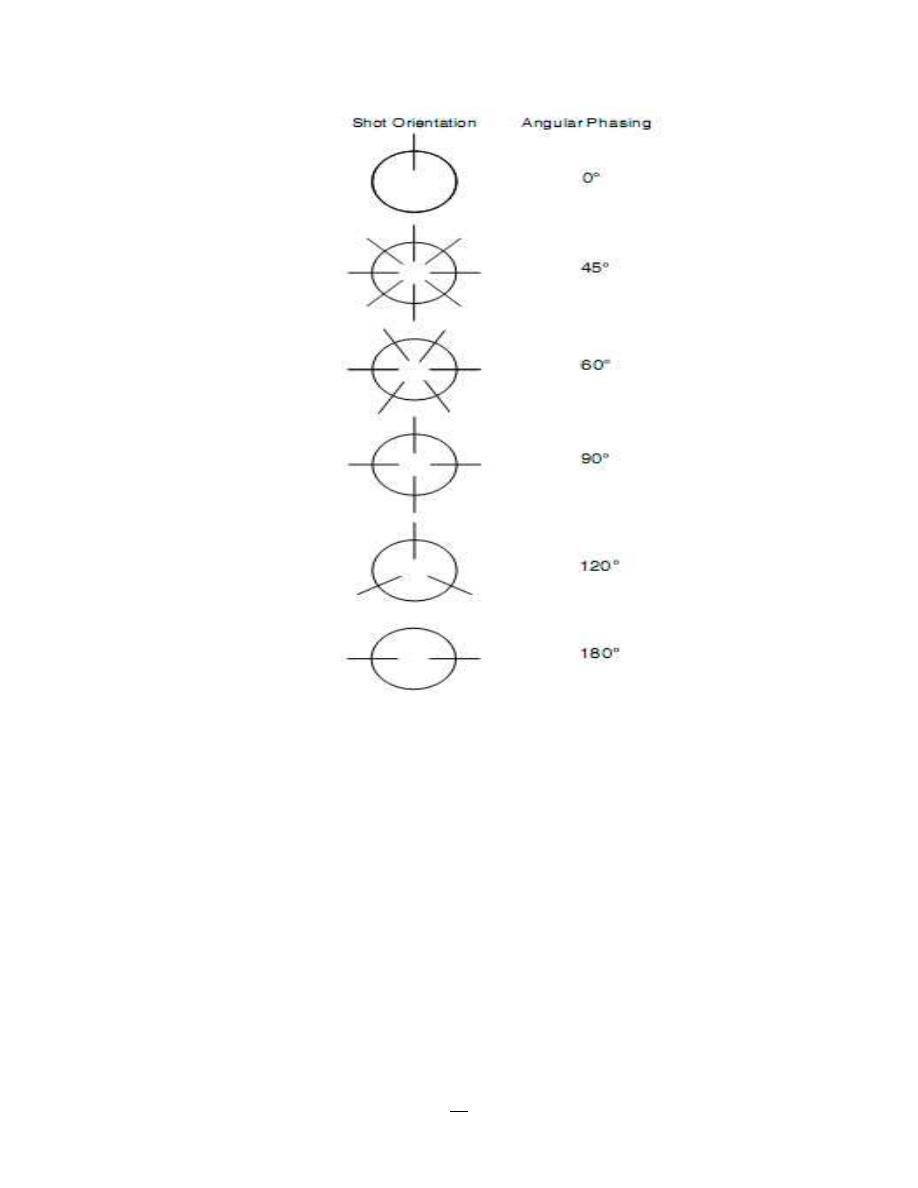
The orientation of perforations defined as the angular phasing can be:
1- 0° or in-line firing which can provide the minimum clearance for all perforation if the gun
is positioned to fire on the low side of the hole.
2- 45° to 90° phasing which provides the nearest approximation to radial flow.
3- 180° phasing in either of the two planar directions.
4- 120° phasing either with all 3 shots firing at 120° to each other or omitting 1 charge such
that the 2 shots fire at +60° and -60° angular phase.
The phase orientations are depicted in (Figure - 40). All perforation flow patterns are utilised. 90°
phasing which provides the best radial depletion can be very effective when conducted with high
shot densities. However, the selection of phasing will depend not only on shot densities but gun
size, gun clearance, formation isotropy or anisotropy with respect to permeability. It is clear that
for each shot density a number of options regarding phasing can exist, for example, 4 shots/ft can
normally be fired at 0°, 90° or 180° phasing (Figure – 41).
54
Production Engineering – I Herish N. Hamarash
Figure - 41: Perforation Shot Phase Pattern
55
Production Engineering – I Herish N. Hamarash
Figure- 42: Perforation shot Density: Example of four shots/foot in line firing and 90º phasing
Perforating Fluid
Before perforation operators, the well should fill with a fluid does not cause any formation damage
when it connect with produce formation. The perforation should done at formation pressure lager
than hydrostatic pressure. There are different types of perforating fluid as following;
1- Salt water (Brine) or Oil; when used purity fluid, it will do not cause perforate plug. But
when the perforation operation done with difference pressure from well towards the
perforated formation, which cause moving suspension (fines of jets or bullets) into
perforators.
2- Acetic acid; this acid is the best perforating fluid under most conditions. Inhibitor corrosion
add to acetic acid to prevent corrosion of metal when connect with the acid for long period
and at high temperature, in case of absence of H2S gas.
3- Nitrogen gas; in case of perforation low pressure formation, or rig time and swabbing cost
is very expense, it better used Nitrogen gas in perforation operations.

56
Production Engineering – I Herish N. Hamarash
Selection of Perforated Intervals
The perforated interval in production zone selected based on result all or most the following
factors:
1- Electric, sonic, and radioactive logs show the border of oil and water formation.
2- Result of drill stem tests that conduct during well drilling.
3- Cores that extract from producing formation.
4- Geologic formations.
Take in account the following factors when select the perforating intervals;
1- The bottom perforated should far from Oil Water Contact (OWC) to avoid water coning.
2- The top perforated should far from Gas Oil Contact (GOC) to avoid gas coning.
3- Select zones with high porosity and permeability and avoid shale zones.
4- Select interval perforation that complete perforated with minimum numbers of guns run
(the gun length is 10 meters), to minimize the cost and provide the safety.
5- The well should fill with a fluid does not cause any formation damage.
57
Production Engineering – I Herish N. Hamarash
Water and Gas Coning
Coning is a term used to describe the mechanism underlying the upward movement of water and/or
the down movement of gas into the perforations of a producing well or the open hole interval.
Coning can seriously impact the well productivity and influence the degree of depletion and the
overall recovery efficiency of the oil reservoirs. The specific problems of water and gas coning are
listed below.
1- Costly added water and gas handling.
2- Reduced efficiency of the depletion mechanism.
3- The water is often corrosive and its disposal costly.
4- Loss of the total field overall recovery.
Delaying the encroachment and production of gas and water are essentially the controlling factors
in maximizing the field’s ultimate oil recovery.
The coning is primarily the result of movement of reservoir fluids in the direction of least
resistance, balanced by a tendency of the fluids to maintain gravity equilibrium. The analysis may
be made with respect to either gas or water. Let the original condition of reservoir fluids exist as
shown schematically in figure - 43, water underlying oil and gas overlying oil.
Figure - 43: Original reservoir static condition
Production from the well would create pressure gradients that tend to lower the gas-oil contact and
elevate the water-oil contact in the immediate vicinity of the well. Counterbalancing these flow
gradients is the tendency of the gas to remain above the oil zone because of its lower density and
of the water to remain below the oil zone because of its higher density. These counterbalancing
forces tend to deform the gas-oil and water-oil contacts into a bell or cone shape as shown
schematically in figure - 44.
58
Production Engineering – I Herish N. Hamarash
Figure - 44: Gas and Water coning
There are essentially three forces that may affect fluid flow distributions a round the well-bores.
These are:
1- Capillary forces.
2- Gravity forces.
3- Viscous forces.
Capillary forces usually have negligible effect on coning and will be neglected. Gravity forces are
directed in the vertical direction and arise from fluid density difference.
Viscous forces refer to the pressure gradients associated fluid flow through the reservoir as
described by Darcy’s law. Therefore, at any given time, there is a balance between gravitational
and viscous forces at points on and away from the well completion interval. When the dynamic
(viscous) forces at the well-bore exceed gravitational forces, a “cone” will ultimately break into
the well.
We can expand on the above basic visualization of coning by introducing the concept of:
-
Stable cone.
-
Unstable cone
-
Critical production rate.
If a well is produced at a constant rate and the pressure gradients in the drainage system have
become constant, a steady-state condition is reached. If at this condition the dynamic forces at the
well are less than the gravity forces, then the water or gas cone that has formed will not extend to
the well. Moreover, the cone will neither advance nor recede, thus establishing what is known as
a stable cone. Conversely, if the pressure in the system is an unsteady-state condition, then an
unstable cone will continue to advance until steady-state conditions prevail.
The critical production rate is the rate above which the flowing pressure gradient at the well causes
water (or gas) to cone into the well. It is, therefore, the maximum rate of oil production without
concurrent production of the displacing phase by coning. At the critical rate, the built-up cone is
stable but is at a position of incipient breakthrough.

59
Production Engineering – I Herish N. Hamarash
Defining the conditions for achieving the maximum water-free and/or gas-free oil production rate
is a difficult problem to solve. Engineers are frequently faced with the following specific problems:
1- Predicting the maximum flow rate that can be assigned to a completed well without the
simultaneous production of water and/or free-gas.
2- Defining the optimum length and position of the interval to be perforated in a well in order to
obtain the maximum water and gas-free production rate.
Critical rate Q
oc
is defined as the maximum allowable oil flow rate that can be imposed on the well
to avoid a cone breakthrough. The critical rate would correspond to the development of a stable
cone to an elevation just below the bottom of the perforated interval in an oil-water system or to
an elevation just above the top of the perforated interval in a gas-oil system.
There are several empirical correlations that are commonly used to predict the oil critical rate,
including the correlations of:
1- Meyer and Gardner and Pirson Methods.
2- Craft and Hawkins Method.
3- Chaney Et AL. Method
1- Meyer and Gardner and Pirson Methods
Meyer, Gardner, and Pirson suggest that coning development is a result of the radial flow of
the oil and associated pressure sink around the well-bore. In their derivations, Meyer, Gardner,
and Pirson assume a homogeneous system with a uniform permeability throughout the reservoir,
i.e., k
h
= k
v
. It should be pointed out that the ratio k
h
/k
v
is the most critical term in evaluating and
solving the coning problem. They developed three separate correlations for determining the critical
oil flow rate:
-
Gas coning
-
Water coning
-
Combined gas and water coning.
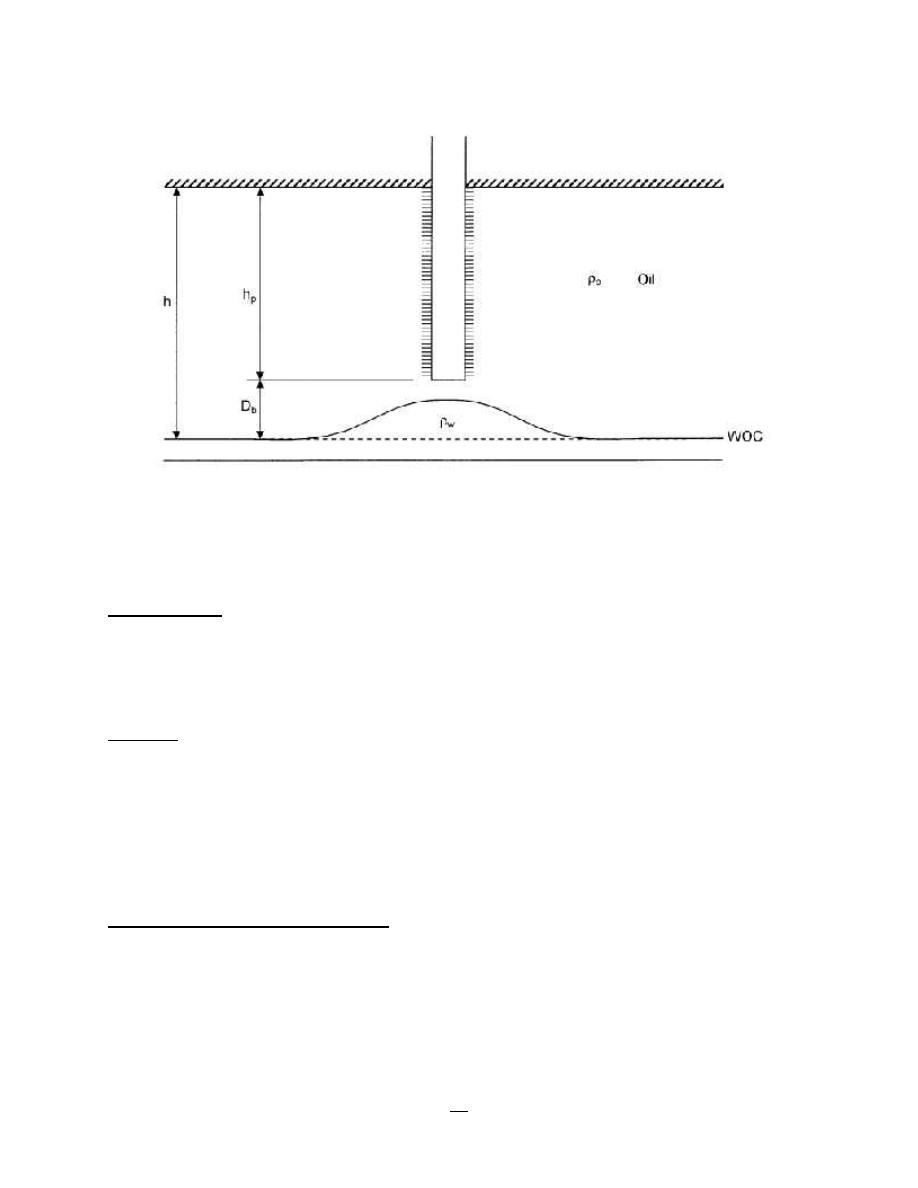
Gas coning
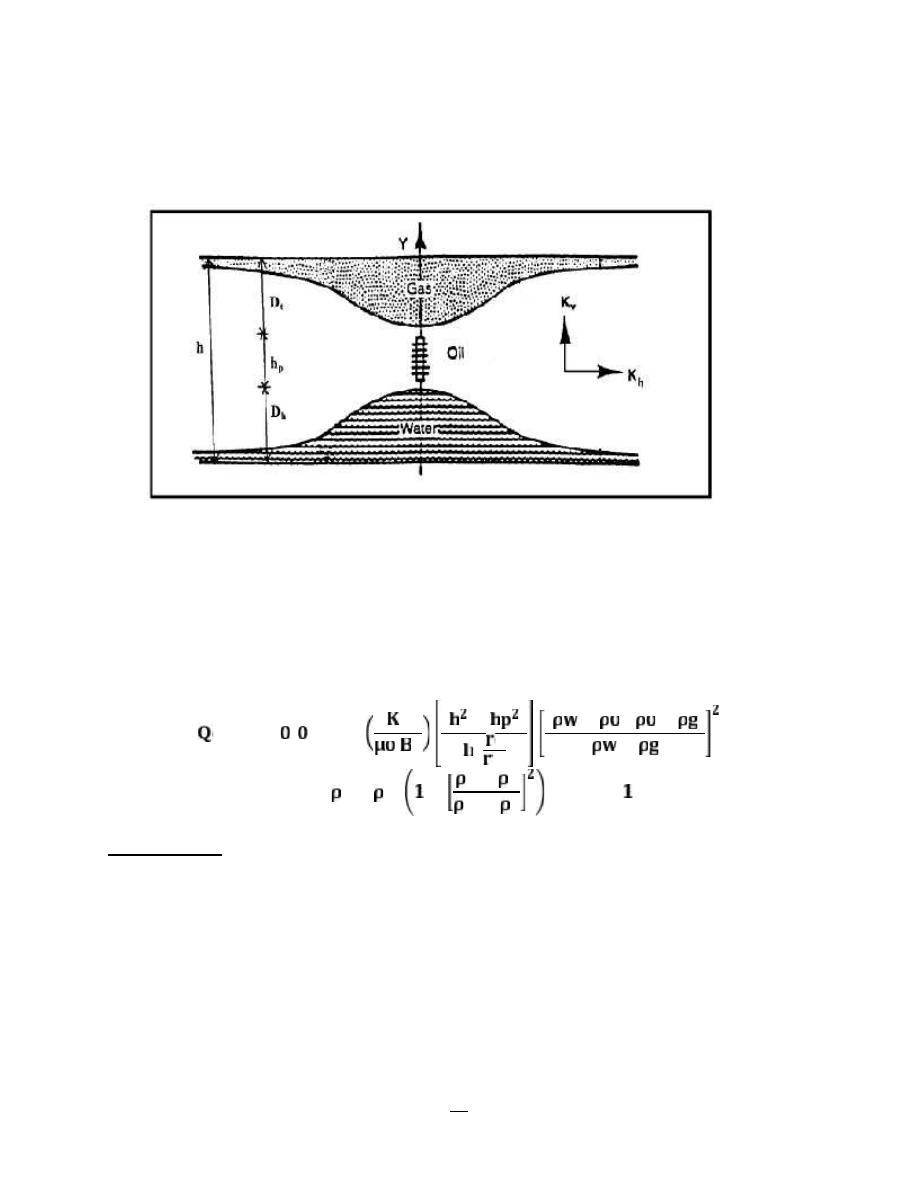
Consider the schematic illustration of the gas-coning problem shown in figure - 45. Meyer,
Gardner, and Pirson correlated the critical oil rate required to achieve a stable gas cone with the
following well penetration and fluid parameters:
-
Difference in the oil and gas density.
-
Depth D
f
from the original gas-oil contact to the top of the perforations.
-
The oil column thickness h.
The well perforated interval h, in a gas-oil system, is essentially defined as:
h =
h
p
– D
f
60
Production Engineering – I Herish N. Hamarash
Figure - 45: Gas coning
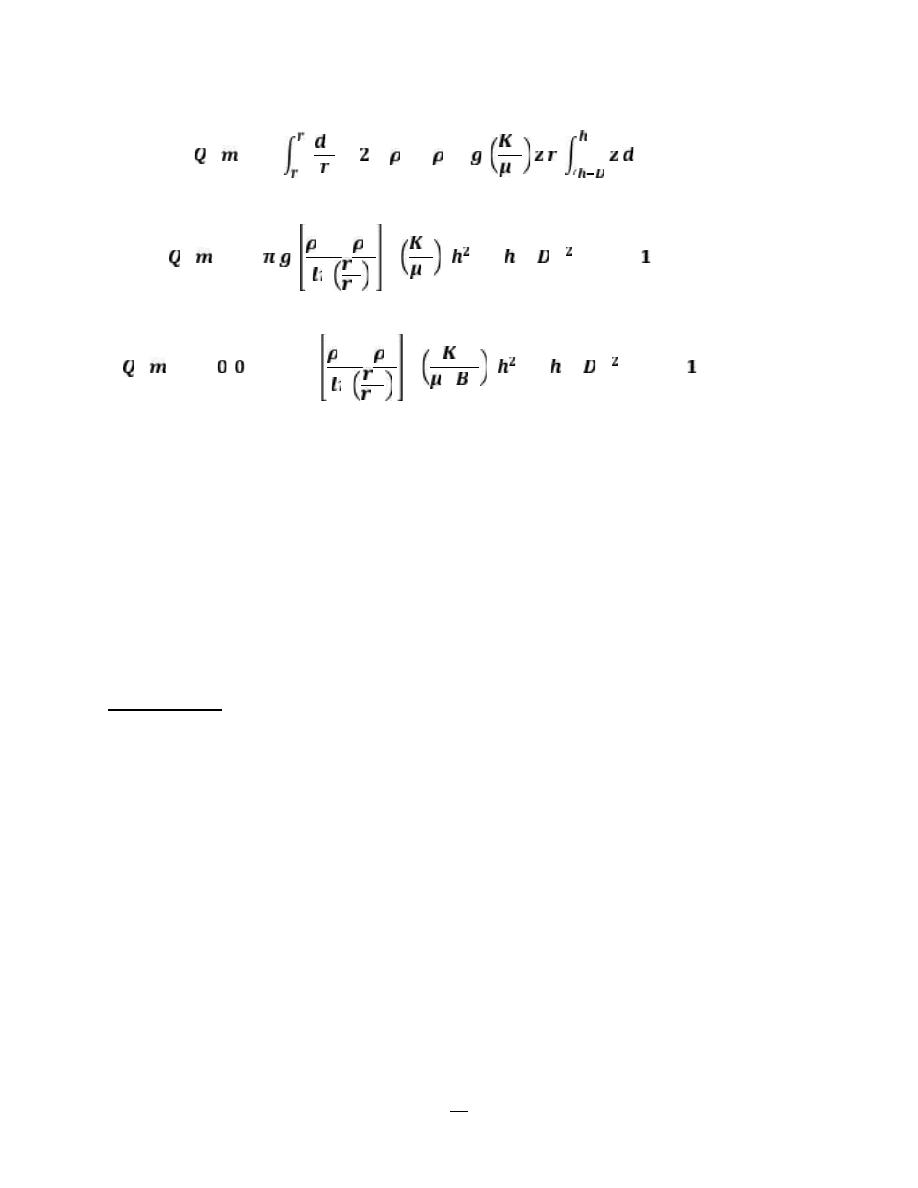
Meyer, Gardner, and Pirson propose the following expression for determining the oil critical flow
rate in a gas-oil system:
Summary of assumptions for gas-oil system:
1. Capillary forces usually have negligible effect on coning and will be neglected.
2. No gas drive, that means GOR remain constant
Ф = Potential = H
For any point, calculate H
=
+
−
… … … ( )
= ∗ → =
Hgas = z + Pg / (ρgas *g) ………. (2)
Hoil = z + Po / (ρoil *g) ………..(3)
Since Pc = zero i.e., Po = Pg (where Pc = Pg-Po = zero)
& Hg = constant (i.e., no gas drive).
For eg.(2) , solving for Pg →
(Hg – z) * ρg *g = Pg
..........(2-a)
61
Production Engineering – I Herish N. Hamarash
& also eq.(3) becomes:-
(Ho – z) * ρo * g = Po ………(3-a)
Since Pc = zero → Po = Pg
Then eq. (2-a) = eq. (3-a)
……….(4)
g
z) ρo *
–
= (Ho
g
z ) ρg *
–
(Hg
Solve eq. (4) for Ho
Ho = Hg * (ρg/ρo) + z [(ρo – ρg)/ρo] ……. (5)
Where Hg is constant
Derivative equation (5) respect to Ho
dHo = [(ρo-ρg)/ρo] dz …….(6)
'
Darcy`s law Q = k A ΔP / μ L (for linear flow)
Solving for oil flow:
Q → Qo
k → ko
L → dr
μ → μo
Radial area ↔ A = 2πrz
ΔP = ρo g dHo
Where P = ρ g H
Then Darcy's law →
Qo = 2π ρo g (ko/μo) z r (dHo/dr) ……. (7)
Substitute the value of (dHo) [i.e. eg.(6) in eq.(7)]
For radial flow
Qo = 2π (ρo – ρg) g (ko/μo) z r (dz/dr) ………. (8)
z
r
62
Production Engineering – I Herish N. Hamarash
=
=
(
−
)
(
_
. =
−
∗
[ − ( −
) ] … … … ( )
Or in field units
. = .
∗
−
∗
[ − ( −
) ] … … … ( )
= maximum oil production rata without gas coning (critical rate), STB/day
max
o
Q
= oil density, gram/ cm³
o
ρ
= gas density, gram/ cm³
g
ρ
= drainage area radius, ft
e
r
bore radius, ft
-
= well
w
r
= oil permeability, md
o
k
o = oil viscosity, cp
μ
Bo = oil formation volume factor, bbl/STTB
h = thickness of oil zone (producing zone), ft
D
t
= Depth from the original gas-oil contact to the top of the perforations, ft
h
p
= Completion interval (Perforated interval), ft.
1):
-
Example (1
A vertical well is drilled in an oil reservoir overlaid by a gas cap. The related well and
reservoir data are given below:
= 110 md
v
= k
h
Horizontal and vertical permeability, i.e., k
= 0.85
ro
relative permeability, k
Oil
= 47.5 lb/ft³
o
Oil density, ρ
= 5.1 lb/ft³
g
Gas density, ρ
= 0.73 cp
o
Oil viscosity, µ
= 1.1 bbl/day
o
Oil formation volume factor, B
Oil column thickness, h = 40 ft
= 15 ft
p
Perforated interval, h
= 25 ft
t
of perforations, D
Depth from GOC to top
63
Production Engineering – I Herish N. Hamarash
0.5 ft
w =
r
bore radius,
-
Well
= 660 ft
e
Drainage radius, r
Using Meyer, Gardner, and Pirson relationships, calculate the critical oil flow rate.
Solution
The critical oil flow rate for this gas-coning problem can be determined by applying
equation (11). The following two steps summarize Meyer, Gardner, and Pirson
methodology.
o
Step 1. calculate effective oil permeability, k
k = 0.85 * 110 = 93.5 md
ro
= k
o
k
by applying equation (11)
oc
Step 2. solve for Q
-
(40
-
2
(5.1/62.4))/ln(660/0.25)](93.5/073*1.1) [40
-
(47.5/62.4)
=Qo max=0.001535[(
oc
Q
]
2
25)
=Qo max= 21.20 STB/day
oc
Q
Water Coning
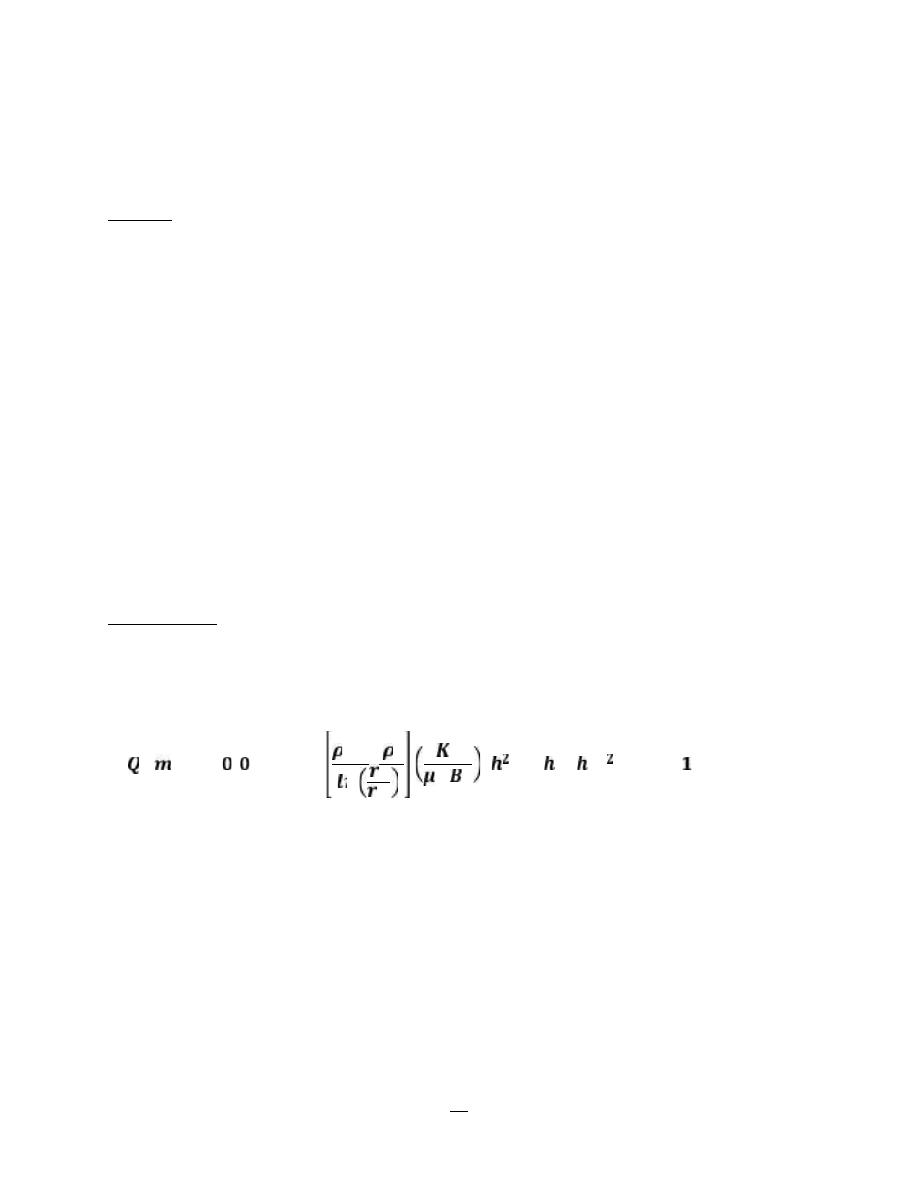
Meyer, Gardner, and Pirson proposed a similar expression for determining the critical oil rate in
the water coning system shown schematically in figure - 46.
The proposed relationship has the following form:
. = .
∗
−
[ − ( −
) ] … … … ( )
64
Production Engineering – I Herish N. Hamarash
Figure - 46: Water coning
Where:
ρw = water density, gram/ cm³
D
b
= Depth from the original water-oil contact to the bottom of the perforations, ft
2):
-
Example (1
Resolve example (1-1) assuming that the oil zone is underlaid by bottom water. The water
density is given as 63.76 lb/ft. the well completion interval is 15 ft as measured from the
top of the formation (no gas cap) to the bottom of the perforations.
Solution:
The critical oil flow rate for this water-coning problem can be estimated by applying
equation (12). The equation is designed to determine the critical rate at which the water
cone “touches” the bottom of the well to give.
Qo max = 0.001535 [((63.76/62.4)-(47.5/62.4))/ ln(660/0.25)] (93.5/0.73*1.1) [40
2
- -15
2
]
Qo max = 8.13 STB/day
Simultaneous Gas and Water coning
If the effective oil-pay thickness h is comprised between a gas cap and a water zone figure - 47,
the completion interval h
p
must be such as to permit maximum oil-production rate without
having gas and water simultaneously produced by coning, gas breaking through at the top of the
interval and water at the bottom.
65
Production Engineering – I Herish N. Hamarash
This case is of particular interest in the production from a thin column underlaid by bottom water
and overlaid by gas.]
Figure - 47: The development of Gas and Water coning
For this combined gas and water coning, Pirson (1977) combined equation (11) and (12) to produce
the following simplified expression for determining the maximum oil-flow rate without gas and
water coning:
Qomax = Qow + Qog …. (13)
= .
( −
) (
−
)(
−
)
−
+ (
− )
−
−
−
… … … … ( )
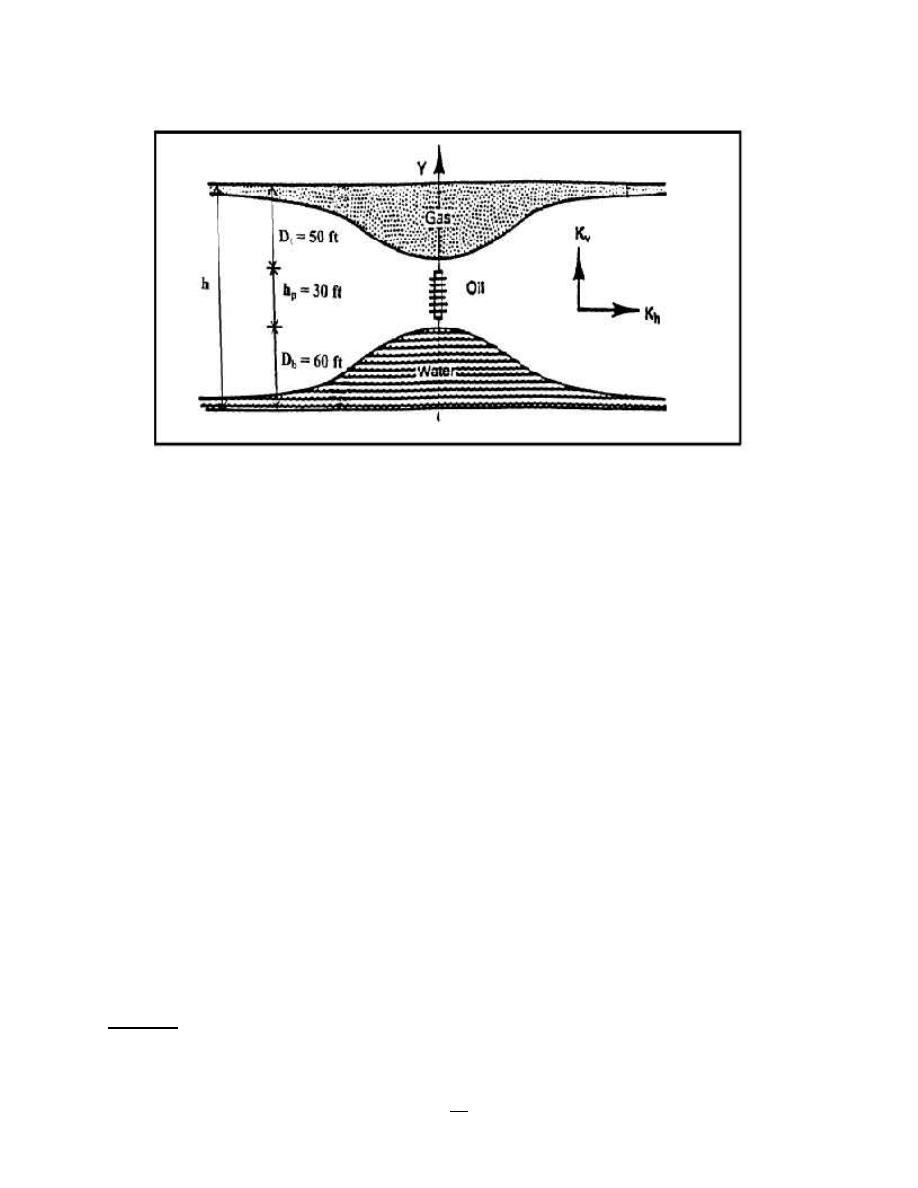
Example (1-3):
A vertical well is drilled in an oil reservoir that is overlaid by a gas cap and underlaid by bottom
water. Figure - 48 shows an illustration of the simultaneous gas and water coning.
66
Production Engineering – I Herish N. Hamarash
Figure – 48: Gas and Water coning problem (example, 1-3)
The following data are available:
= 110 md
v
= k
h
Horizontal and vertical permeability, i.e., k
= 0.85
ro
Oil relative permeability, k
= 93.5 md
o
Oil effective permeability, k
= 47.5 lb/ft³
o
Oil density, ρ
= 63.76 lb/ft³
w
Water density, ρ
b/ft³
= 5.1 l
g
Gas density, ρ
= 0.73 cp
o
Oil viscosity, µ
= 1.1 bbl/STB
o
Oil formation volume factor, FVF, B
Oil column thickness, h = 65 ft
= 15 ft
p
Perforated interval, h
= 25 ft
t
Depth from GOC to top of perforations, D
0.5 ft
w =
r
bore radius,
-
Well
Drainage radius, r
e
= 660 ft
Calculate the maximum permissible oil rate that can be imposed to avoid cones breakthrough,
i.e., water and gas coning.
Solution:
Apply equation (14) to solve for the simultaneous gas-and water coning problem, to give:
67
Production Engineering – I Herish N. Hamarash
Qomax =0.001535(93.5/0.73*1.1)[(65
2
-15
2
)/(ln(660/0.25)]
[((63.76/62.4)-(47.5/62.4))(((47.5/62.4)-(5.1/62.4))/((63.76/62.4)-(5.1/62.4)))
2
+((47.5/62.4)-
(5.1/62.4))(1-(((47.5/62.4)-(5.1/62.4))/((63.76/62.4)-(5.1/62.4))))
2
]
Qomax = 17.1 STB/day
Pirson derives a relationship for determining the optimum placement of the desired h
p
feet of
perforation in an oil zone with a gas cap above and a water zone below. Pirson proposes that the
optimum distance D
t
from the GOC to the top of the perforations can determined from the
following expressed:
= (ℎ – ℎ ) 1 −
−
−
… . . (15)
Where the distance D
t
is expressed in feet.
Example (1-4):
Using the data given in example (1-3), calculate the optimum distance for the placement
of the 15 foot perforations.
Solution:
Applying equation (15) gives:
D
t
= (65 – 15 ) [ 1- 47.5 – 5.1 ] = 13.9 ft
63.76 – 5.1
There are other methods in water and gas coning calculation like:
-
Craft & Hawkins Method
-
Chaney Et AL. Method
68
Production Engineering – I Herish N. Hamarash
Completion Efficiency
Generally, there are difference types of well completions; the cased-hole completion has
advantage characterize the open-hole completion by:
1- Excessive gas or water production can be controlled more easily.
2- Can be selectively stimulated.
3- Adaptable to multiple completion techniques.
The advantage of cased-hole completion comes in account of loss in well potential to produce
with maximum rate because of casing and perforation. Also it is not unusual during drilling,
completion, or work-over operations for materials such as mud filtrate, cement slurry, or clay
particles to enter the formation and reduce the permeability around the well-bore which cause
potential loss. This effect is commonly referred to as “well-bore damage” and the region of
altered permeability is called the “skin zone” this zone can extend from a few inches to several
feet from the well-bore as shown in figure - 49, it express by positive skin factor (s = +). Many
other wells are stimulated by acidizing or fracturing, which in effect increases the permeability
near the well-bore, expressed by negative skin factor (s = -). Figure - 50 shows pressure profile
through porous media.
Figure – 49: near well bore skin effect
.
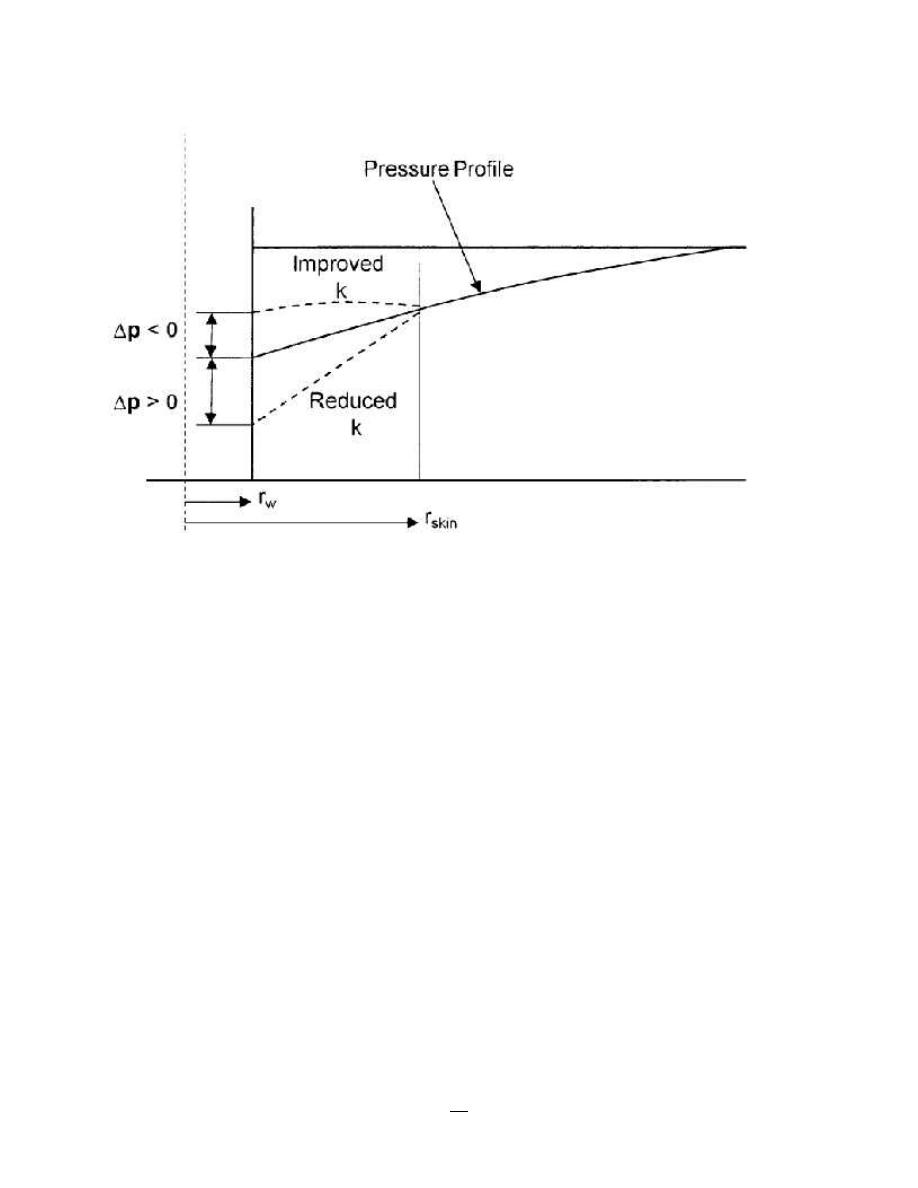
69
Production Engineering – I Herish N. Hamarash
According to the above factors that cause pressure loss, there are many skin factors as following:
St = S
fm
+ S
c
+S
pp
Where;
S
fm
= Formation skin factor due to alteration formation characteristics (permeability).
Many wells either have a zone of reduced permeability near the well-bore resulting from drilling
or completion operations or have been stimulated by acidizing or hydraulic fracturing.
Those factors that cause damage to the formation can produce additional localized
pressure drop during flow. This additional pressure drop is referred to as ∆p
skin
. On the other
hand, well stimulation techniques will normally enhance the properties of the formation and
increase the permeability around the well-bore, so that a decrease in pressure drop is observed.
The resulting effect of altering the permeability around the well-bore is called the skin effect.
Figure (2) compares the difference in the skin zone pressure drop for three possible
outcomes:
-
First outcomes: ∆p
skin
> 0, indicates an additional pressure drop due to well-bore damage,
i.e., k
skin
< k and s = +.
Figure – 50: pressure profile, reprehensive of positive and negative skin effects.
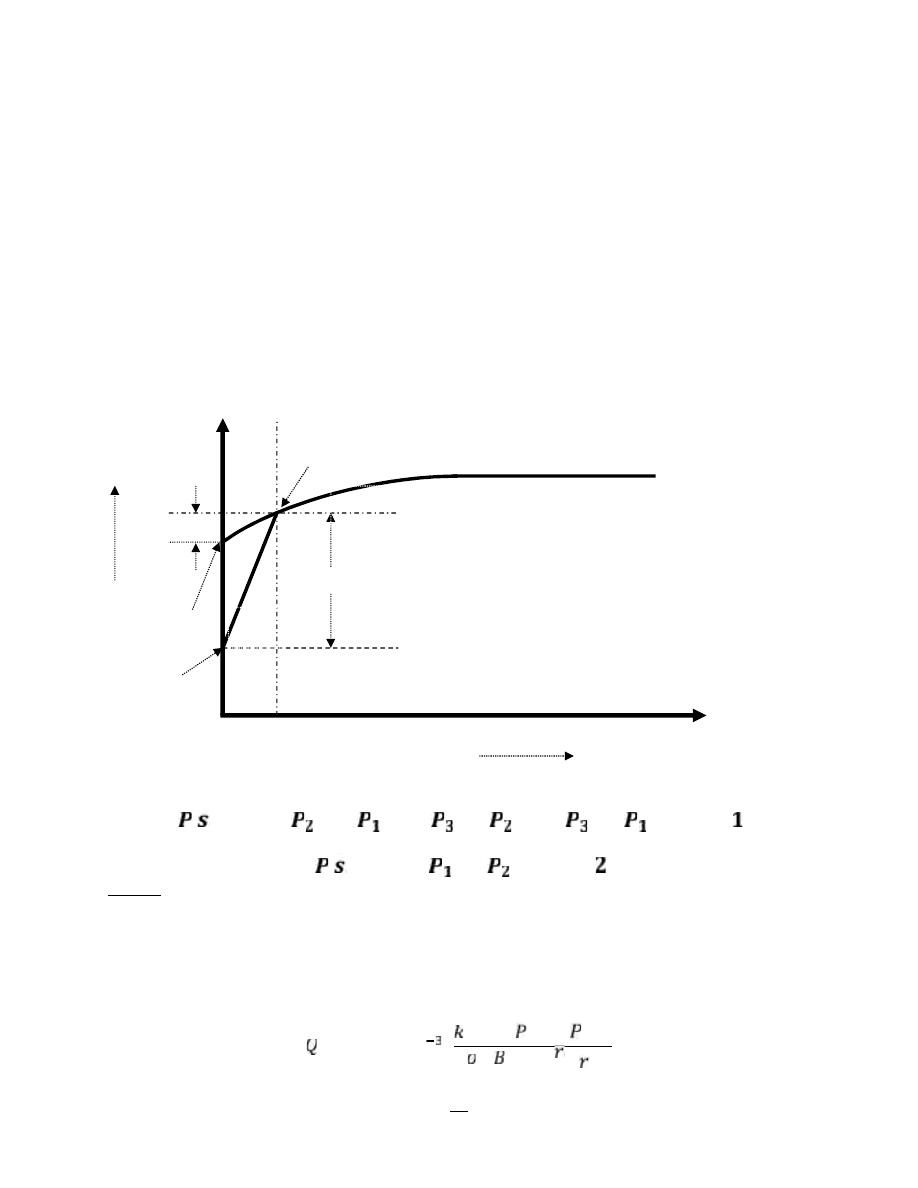
70
Production Engineering – I Herish N. Hamarash
-
Second outcomes: ∆p
skin
< 0, indicates less pressure drop due to well-bore improvement, i.e.,
k
skin
< k and s = -.
-
Third outcomes: ∆p
skin
= 0, indicates no changes in the well-bore condition, i.e., k
skin
= k and
s = 0.
Hawkins (1956), suggested that the permeability in the skin zone, i.e., k
skin
, is uniform and the
pressure drop across the zone can be approximated by Darcy`s equation. Hawkins proposed the
following approach as shown in below figure:
∆p
skin
= [∆p in skin zone due to k
skin
- ∆p in skin zone due to k]
∆
= (∆
− ∆ ) = (
−
) − (
−
) … … … ( )
∆
= (
−
) … … … ( )
Where:
ΔΡ
2
= pressure drop in the altered zone around the well bore ( r
s
, k
skin
).
ΔΡ
1
= pressure drop in the undamaged zone ( r
s
, k ).
Apply Darcy's law for radial-steady state flow with field units.
= 7.08 ∗ 10
∗ ℎ ∗ (
−
)
μ ∗
∗ ln( ⁄ )
P
1
P
3
P
2
r
w
r
s
Distance (r)
(ΔΡ)2
(ΔΡ)1
k
skin
k
Pressure ( P
wf
)

71
Production Engineering – I Herish N. Hamarash
p
ws
= static bottom hole (well bore) pressure, psi.
p
wf
= flowing bottom hole (well bore) pressure, psi.
ΔΡ
1
= 141.2 Q
o
μ
o
B
o
ln(r
s
/r
w
)
………(3)
kh
ΔΡ
2
= 141.2 Q
o
μ
o
B
o
ln(r
s
/r
w
)
……...(4)
k
skin
h
Substitute Eq. (3) & (4) in Eq. (2)
ΔΡ
skin
= 141.2 Q
o
μ
o
B
o
ln(r
s
/r
w
) / k
skin
h - 141.2 Q
o
μ
o
B
o
ln(r
s
/r
w
) / kh
ΔΡ
skin
= 141.2 Q
o
μ
o
B
o
[ (k – k
skin
) ln( r
s
) ] ……(5)
kh k
skin
r
w
Van Everdingen defined ΔΡ
skin
as:-
(ΔΡ
skin
)
fm
= 141.2 Q
o
μ
o
B
o
(S
fm
) ……(6)
kh
Solving for S
fm
equalizing Eqs. (5) & (6).
S
fm
= [ (k – k
skin
) ln( r
s
) ] …….(7)
k
skin
r
w
Re-exam Eq. (7)
Case-1 k = k
a
No damage, No stimulation
S
fm
= 0 , ΔΡ
skin
= 0
Case-2 k < k
a
Damage
S
fm
= +ve , ΔΡ
skin
= +ve increase total pressure drop
when produce with constant rate.
Case-3 k > k
a
Stimulation
S
fm
= -ve , ΔΡ
skin
= -ve decrease total pressure drop
when produce with constant rate.
S
pp
= skin factor due to partial penetration of the formation.
The skin factor S
pp
, is affected by perforations in only a portion of the total formation thickness
(effect of incompletely perforated interval). This factor causes an additional pressure drop near the
well. The purpose from partial penetration of the formation is avoided water and gas coning.
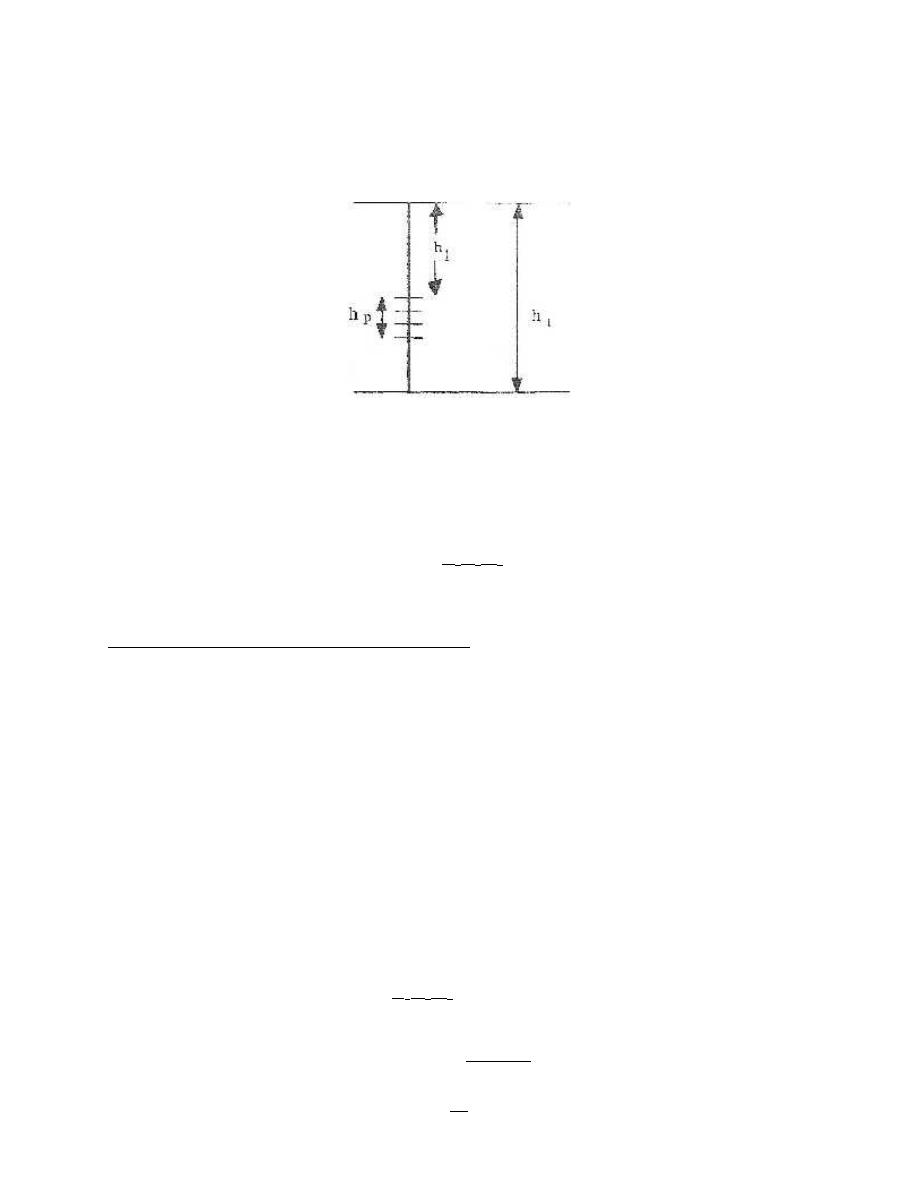
72
Production Engineering – I Herish N. Hamarash
S
pp
is depended on penetration ratio (b = h
p
/ h
t
) and (h
p
/ r
w
). Where, h
t
is the total formation
thickness, h
p
is height of the perforated interval, and r
w
is well-bore radius. As shown in figure -
51
S
pp
value is determined by figure – 52:by use value of b and (h
p
/ r
w
).
S
pp
is always +ve.
Also: (ΔΡ
skin
)
pp
= 141.2 Q
o
μ
o
B
o
(S
pp
)
Kh
S
c
= skin factor due to completion configuration.
Skin factor due to completion configuration is determined by use figure (1-41), (1-42), and figure
(1-43), and the following data.
1- Perforating techniques (Bullet guns, Jet guns, Hydraulic perforator), and formation compressive
strength. Used to determine formation penetration (distance of bullet penetrate the formation).
2- Perforation phase.
3- Area of perforated interval.
4- Perforation density, (number of perforation per foot of perforated interval).
(S
c
)
chart
is corrected according to perforated zone, by: .
(S
c
)
cor
= (S
c
)
chart
(h
t
/ h
p
)
Also:
(ΔΡ
skin
)
c
= 141.2 Q
o
μ
o
B
o
(S
c
)
cor
kh
or
(ΔΡ
skin
)
c
= 141.2 Q
o
μ
o
B
o
(S
c
)
chart
Figure – 51: partial penetration of formation by a well.

73
Production Engineering – I Herish N. Hamarash
kh
p
So:
St = S
fm
+ S
c
+S
pp
(ΔΡ
skin
)
total
= (ΔΡ
skin
)s
fm
+ (ΔΡ
skin
)
spp
+ (ΔΡ
skin
)s
c
(ΔΡ
skin
)
total
= 141.2 Q
o
μ
o
B
o
(S
t
)
kh
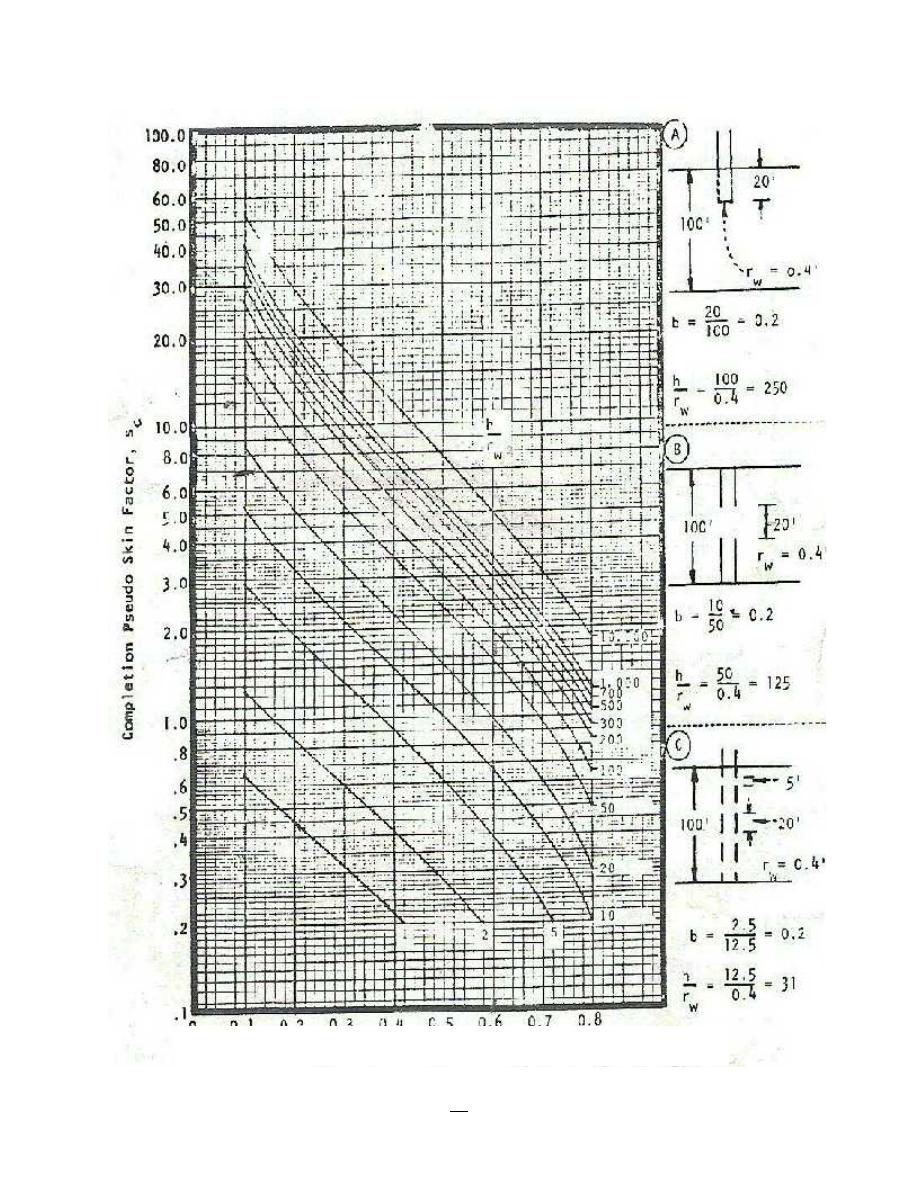
74
Production Engineering – I Herish N. Hamarash
Figure – 52: skin factor due to partial penetration of the formation, S
pp
.
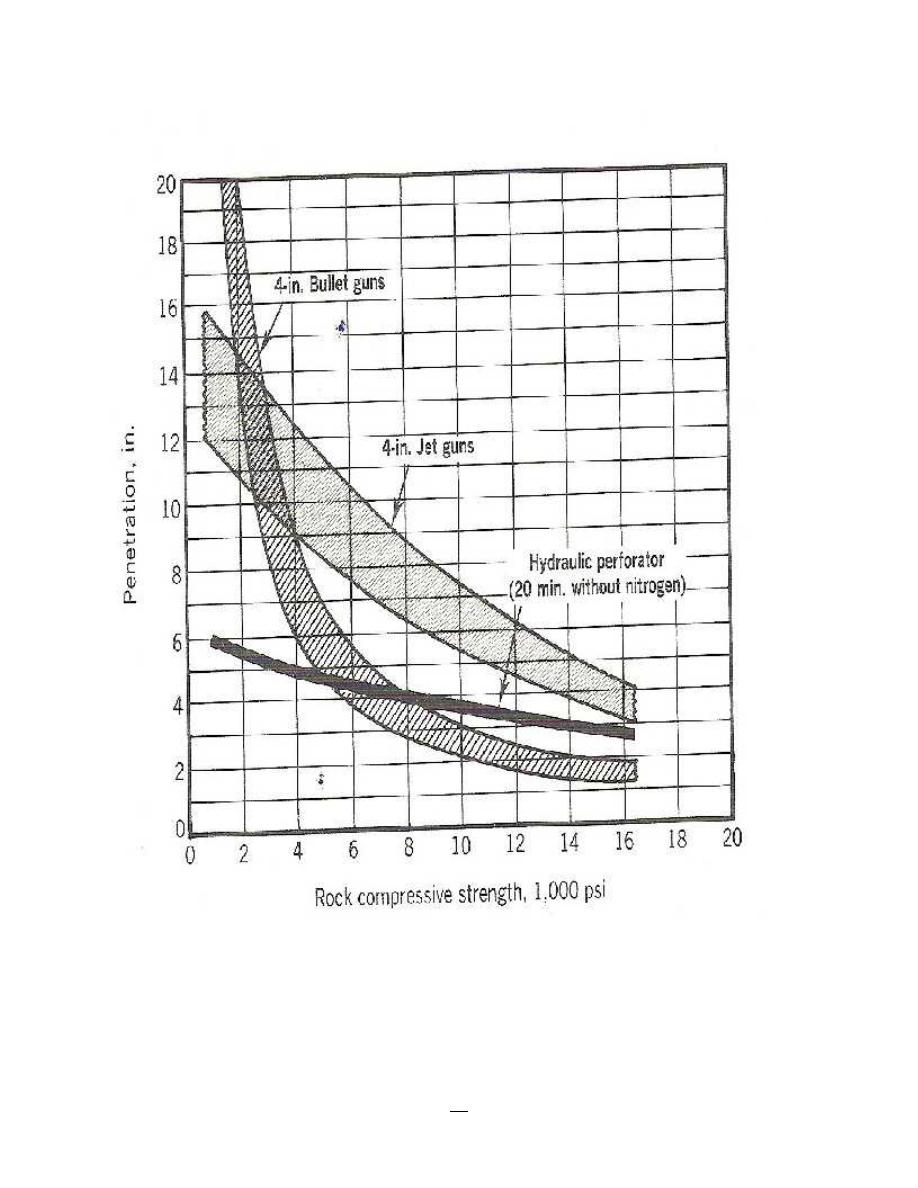
75
Production Engineering – I Herish N. Hamarash
Figure (1-41), Bullet, Jet and Hydraulic perforator performance in formations of various compressive strength.
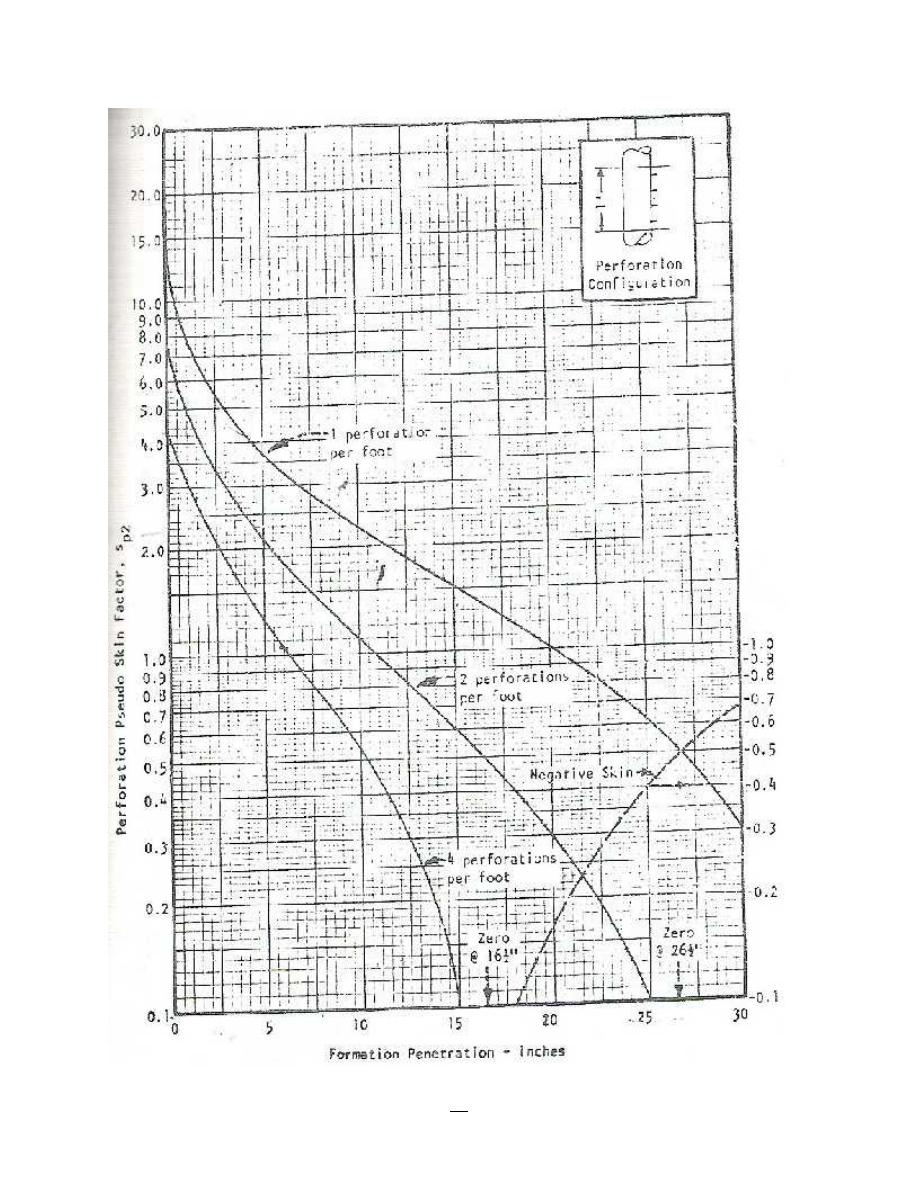
76
Production Engineering – I Herish N. Hamarash
Figure (1-42), skin factor due to completion configuration, S
c
. well-bore diameter = 9
7/8 inch, perfora on diameter = ½ inch, perforation phase in one side
.
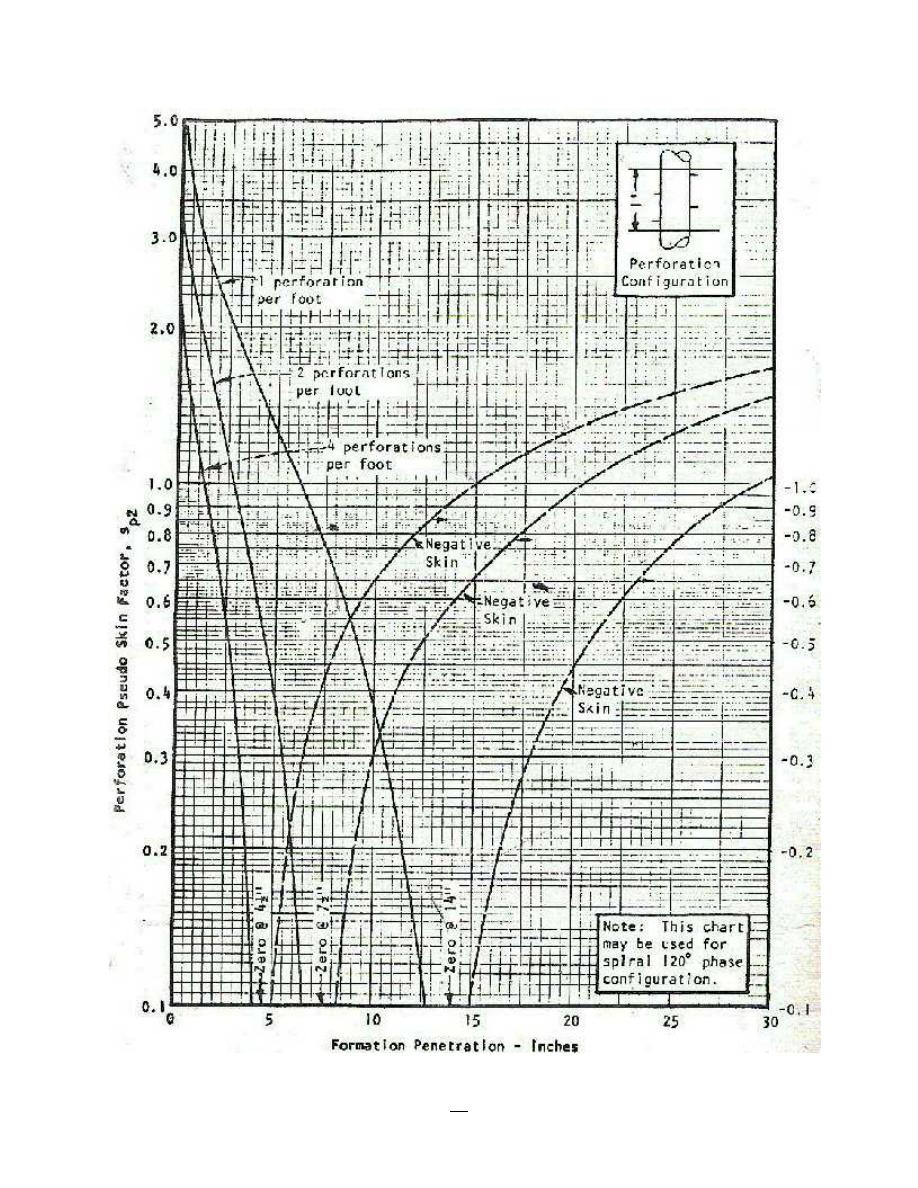
77
Production Engineering – I Herish N. Hamarash
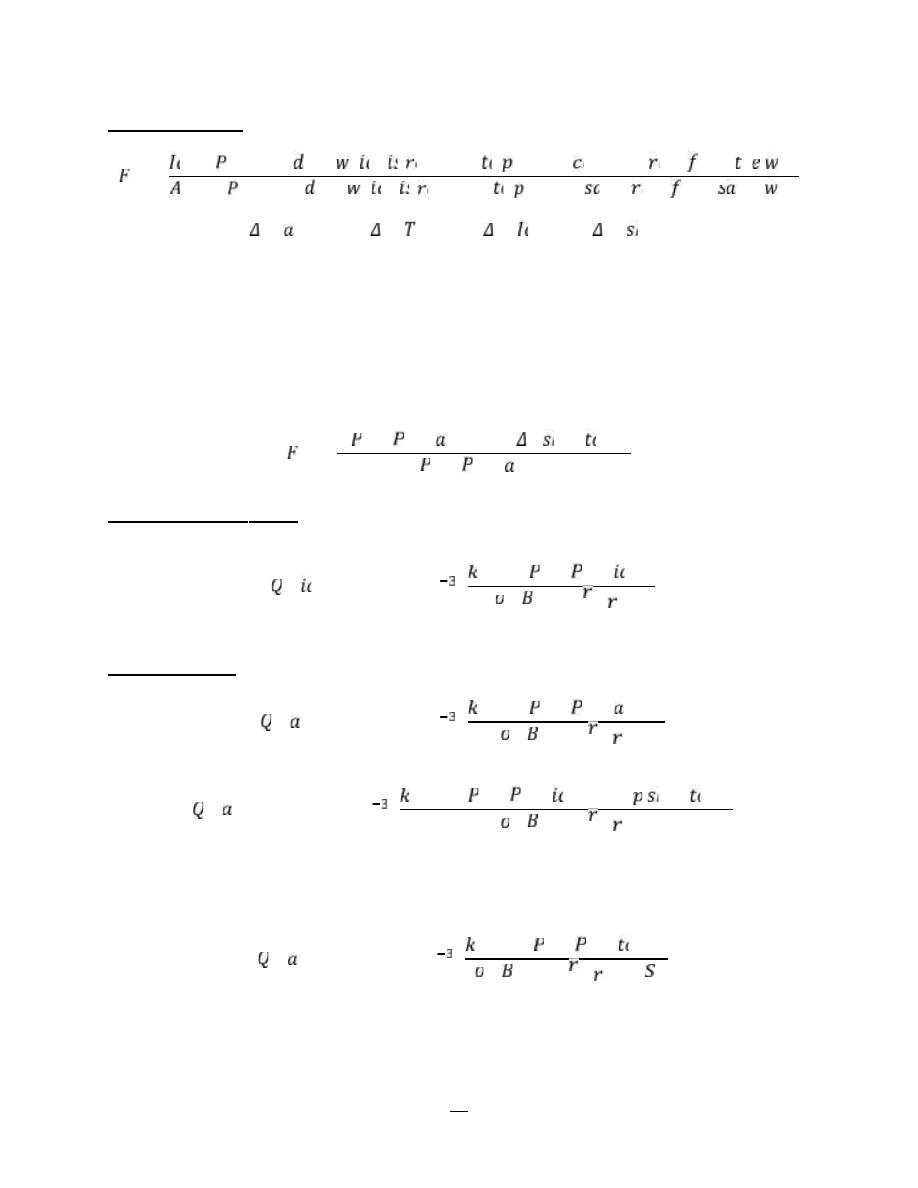
78
Production Engineering – I Herish N. Hamarash
Flow efficiency
=
ℎ ℎ
ℎ
ℎ ℎ
(
) =
(
) =
(
) +
(
)
Or
(p
e
-p
wf
)
actual
= (p
e
-p
wf
)
total
= (p
e
-p
wf
)
ideal
+ (∆p)
skin
Then
=
[(
−
)
− (
)
]
[(
−
)
]
- Ideal case (S
t
= 0)
( )
= 7.08 ∗ 10
∗ ℎ ∗ (
−
)
μ ∗
∗ ln( ⁄ )
- Actual case
( )
= 7.08 ∗ 10
∗ ℎ ∗ (
−
)
μ ∗
∗ ln( ⁄ )
( )
= 7.08 ∗ 10
∗ ℎ ∗ [(
−
)
+ (∆
)
μ ∗
∗ ln( ⁄ )
Or
( )
= 7.08 ∗ 10
∗ ℎ ∗ [(
−
)
]
μ ∗
∗ [ln( ⁄ ) + ]

79
Production Engineering – I Herish N. Hamarash
FE > 1 Stimulation
FE < 1 Damage
p
e
= Average reservoir pressure.
p
wf
= Flowing bottom hole pressure.
Example;
From this data:
Oil column thickness = 25 ft, ko = 100 md, μo = 0.5 cp, Perforated zone thickness = 15 ft (from
upper oil zone), Radius of drainage area =660 ft, Total pressure drop = 1000 psi, well bore radius
= (3/8) ft, Bo ( oil formation volume factor) = 1.4 RB/STB, Perforating diameter = 2 inch,
perforating (shots) density = 4 perforation(shots) / ft.
Jet guns used to perforation operation, and the bullet penetrate the casing and cement
only (formation penetration = zero), and perforation phase in one side (all perforation in one side).
1- Ideal flow rate.
(Q
o
)
ideal
= 7.08*10
-3
kh (p
e –
p
wf
) / μ
o
B
o
ln(r
e
/r
w
)
(Q
o
)
ideal
= 7.08*10
-3
*100*25*1000/ [0.5*1.4* ln(660/0.375)
(Q
o
)
ideal
= 3383.5 STB/DAY.
2- Actual flow rate.
(Q
o
)
actual
= 7.08*10
-3
kh (p
e –
p
wf
) / μ
o
B
o
{ln(r
e
/r
w
) + St}
St = S
fm
+ (S
c
)
cor
+S
pp
S
fm
= 0 → no information
S
pp
→
ht//r
w
= 25/0.375 = 66.67
hp/ht = 15/25 = 0.6
From figure (1-40) S
pp
= 1.7
(S
c
)
cor
→
From figure (1-42) (S
c
)
chart
= 4.25
(S
c
)
cor
= (S
c
)
chart
(h
t
/ h
p
)
(S
c
)
cor
= 4.25* (25 / 15 ) = 6.88
So:
S
t
= 0 + 6.88 + 1.7 = 8.58
(Q
o
)
actual
= 7.08*10
-3
* 100*25*1000 / 0.5*1.4μ
o
B
o
{ln(660/0.375) + 8.58}
(Q
o
)
actual
= 1555.4 STB/DAY

80
Production Engineering – I Herish N. Hamarash
3- Pressure drop due to skin.
(ΔΡ
skin
)
total
= 141.2 Q
o
μ
o
B
o
/ kh (S
t
)
(ΔΡ
skin
)
total
= 141.2 *1555.4*0.5*1.4 / 100*25 (8.58)
(ΔΡ
skin
)
total
= 528.74 psi
FE = [ (p
e
– p
wf
) – (ΔΡ
skin
)
total
] / [ p
e
- p
wf
]
FE = [ 1000 – 528.74 ] / [ 1000 ]
FE = 0.47

81
Production Engineering – I Herish N. Hamarash
Drill Stem Testing, DST
Drill Stem testing provides a method of temporarily completing a well to determine the
productivity characteristics of a specific zone. As originally conceived, a Drill Stem Test provided
primarily an indication of formation content. Also the pressure versus time chat was available.
Reservoir characteristics that may be estimated from DST analysis include;
Average effective permeability
Reservoir pressure
Identify reservoir fluids
Well-bore damage
Barriers, fluid contacts
Radius of investigation
Depletion
Tools Used in DST
The type of DST tolls depends on the testing well, whether it is cased or open hole.
a- Surface pressure control equipments
It is a collection of valves, flanges and nipples set on well head, used to control on flow
rate and internal closed or flowing pressure.
b- Drill pipe
Drill pipe used as connection between surface equipment and test equipment.
c- Reverse circulation sub
This sub valve used to circulation the drill mud (reveres circulation, from annulus to inside
drill pipe), for killing the well and control on well after the test was finish or in emergency
cases, and the valve used to empty the drill test stem from fluids when pull out of hole.
During the tools run in hole this valve remain closed and still closed until the test was
finished, after that its open to control on well.
d- Drill collar
Used to set the packer and open or close tester valve by its weight.
e- Reverser circulation ports
Also, used to reverse circulation of drill mud after the test was complete.
f- Closed in pressure valve

82
Production Engineering – I Herish N. Hamarash
The valve used to close the drill stem after the test was finish.
g- Flow choke
The flow choke with a specific diameter (5/8 inch) used to fluid flow through it and to
calculations purpose.
h- Tester valve
This valve used to control on fluid movement (flow or close), the valve is closed by put the
drill stem under tension, or open it by slack off the stem. (Some times the valve called multi
flow evaluator MFE).
i- Upper pressure recorder
This instrument includes pressure record that consists from spiral tube that moves
according to amount of supply pressure, the tube shifting is transit through a small needle
to a black chart (previously, set on it lines with a specific pressure). All operations that
occur during the test will recorded on the black chart as pressure versus time profile.
j- Hydraulic jar
It is a motional nipple, used to release the test stem in stuck case.
k- Safety joint
This joint is useful in case of stem stuck. When stem does not release, could back the part
of stem by open it from the safety joint.
l- Packer
It is the important part of the test stem; consist from steel and rubber part. After set the
packer by supply a certain weight, the rubber part will isolate the upper of well from the
formation (remove the hydrostatic pressure from the formation). After the test on formation
was completed, then the packer return to its normal situation by removes the supplied
weight, and the formation will be under control by the hydrostatic mud column pressure.
m- Perforated pipe
Through this pipe the oil and gas enter inside the test stem.
n- Temperature recorder
This recorder used to record tested formation temperature.
o- Bottom pressure recorder
Its second pressure instrument also used to record flowing and closed bottom-hole pressure.

83
Production Engineering – I Herish N. Hamarash
p- Tail pipe anchor
Tail pipe anchor is the last part of test stem used for support purpose.
Basics of DST operations
Simply a drill stem test is made by running in the hole on drill pipe a bottom assembly consisting
of a packer and a surface operated valve. The DST valve (tester valve) is closed while the drill
string is run, thus pressure inside the drill pipe is very low compared to hydrostatic mud column
pressure (some times fill inside drill pipe with amount of water, called water cushion to reduce the
impact of high pressure). Once on bottom, the packer is set to isolate the desired formation zone
from mud column, and the control valve is opened to allow formation fluids to enter the drill pipe.
After suitable period, the valve is closed, and a pressure build-up occurs below the valve as
formation fluids repressure the area around the well-bore. After a suitable build-up time, the
control valve usually is opened again, and the flowing and shut-in periods repeated, (several times
if desired), to obtain additional data and verification. Figure – 54 shows schematically a simple
single-flow period operational sequence.
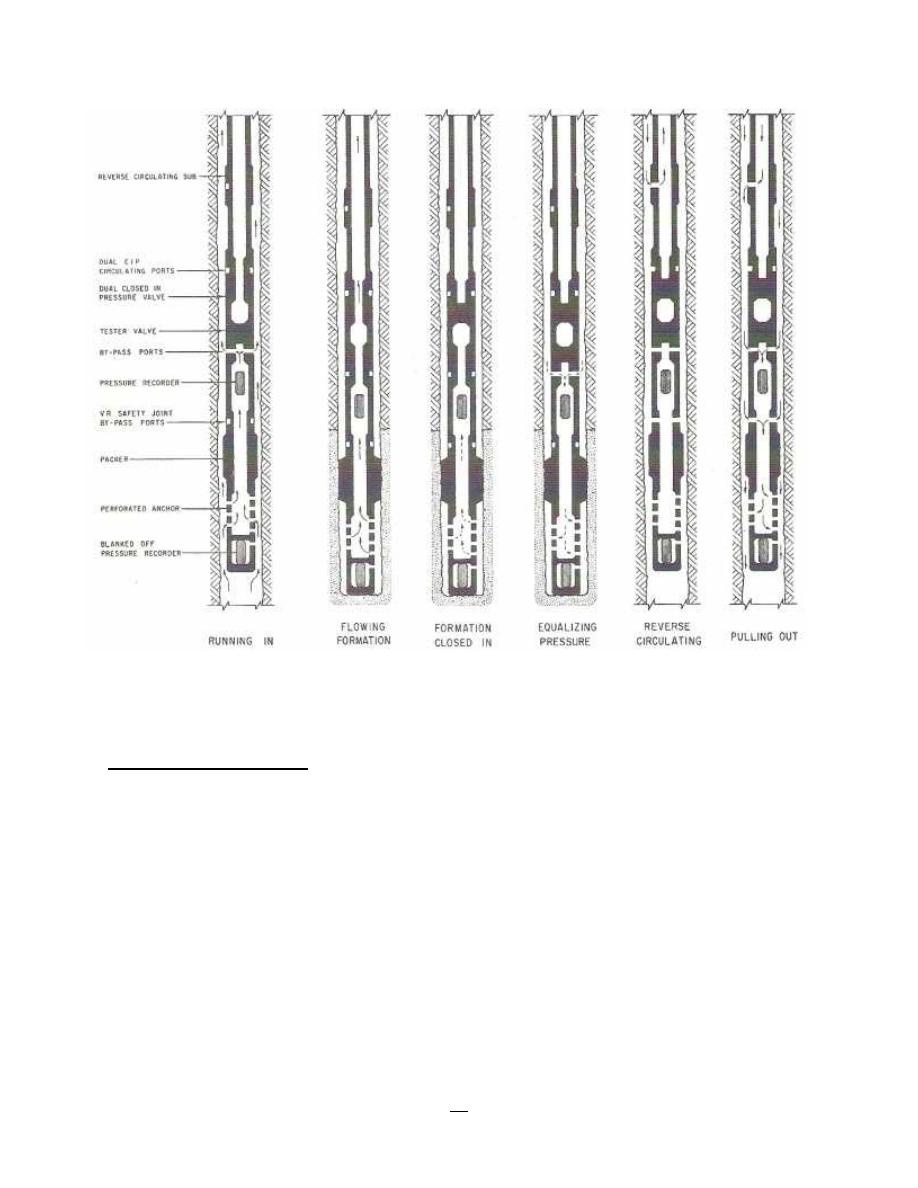
84
Production Engineering – I Herish N. Hamarash
Figure – 54: Fluid passage diagram, open-hole drill stem test.
Pressure versus Time Plot
The entire sequence of events is recorded on a pressure vs time plot shown schematically in figure
- 55. As the tools are run in the hole, the pressure records the increase in hydrostatic mud column
pressure. The pressure at point A is termed the initial hydrostatic mud pressure.
Initial Flowing and Shut-in Periods- one objective of the DST is to determine the static or shut—
in reservoir pressure of the zone. To measure true static reservoir pressure, any over-pressured
condition near the well-bore, due to drilling fluid filtration or fluid compression in setting the
DST packer, must first be relieved by a short flowing period.
The control valve is then closed and pressure builds-up toward static reservoir pressure. Depending
on the length of the flowing period, the length of the shut-in period, and certain reservoir
parameters, the pressure may or may not level out at the true static reservoir pressure. Thus point
B, initial shut-in pressure, may be somewhat less than true static reservoir pressure.
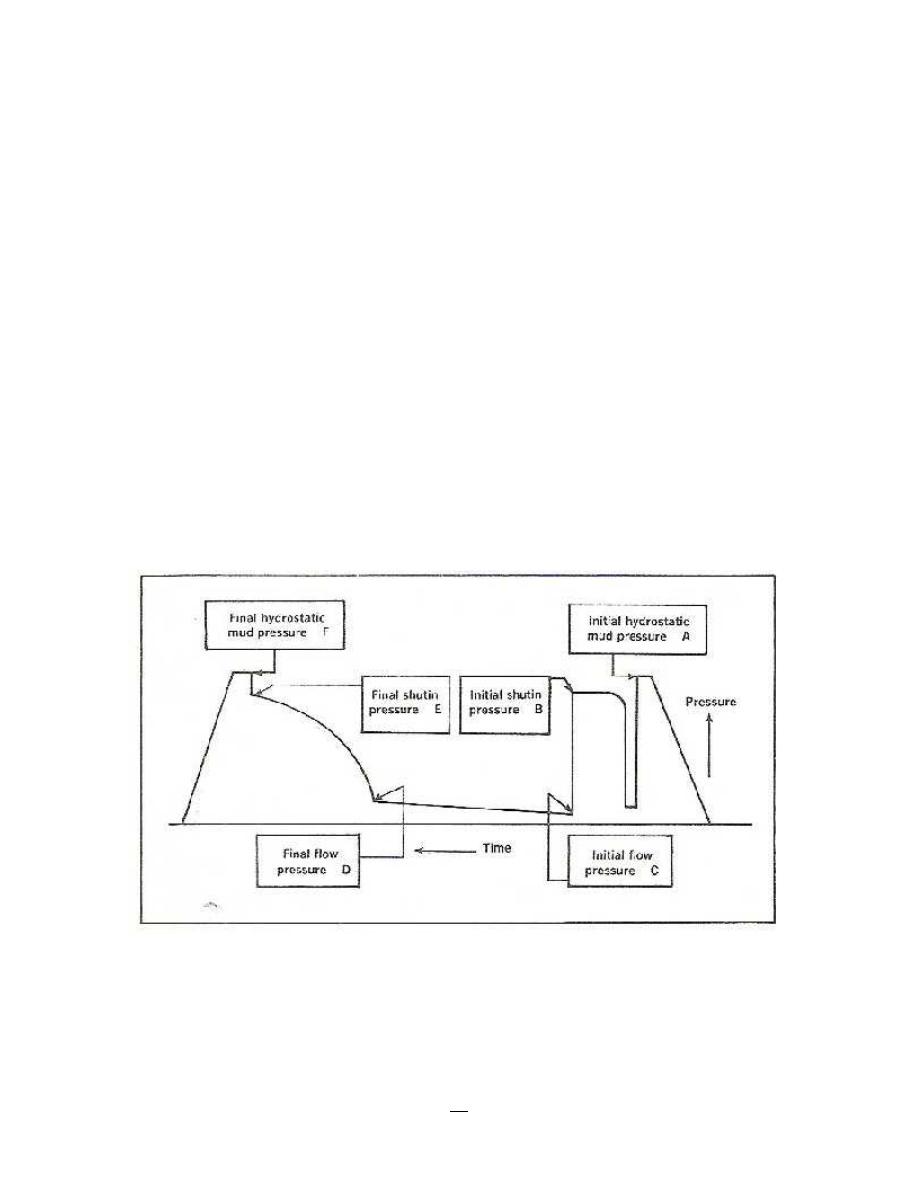
85
Production Engineering – I Herish N. Hamarash
Second Flowing and Shut-in Periods- the objective of the second flowing and shut-in periods is to
permit the calculation of reservoir parameters, as well as to determine fluid production. As the
control valve is opened, pressure falls to point C (initial flowing pressure). As fluids move into the
drill pipe above the recorder, pressure increases, reflecting the increase in hydrostatic head of
liquid and in back pressure, due to flow restrictions in the tools.
After a suitable period of time, depending on test objectives, hole conditions and the cost of rig
time, the tool is shut-in. The pressure at the moment of shut-in, point D, is termed the final flowing
pressure. Recorded pressure then rises toward point E, the final shut-in pressure. Usually the final
shut-in pressure is significantly less than the static reservoir pressure, again due to limitation of
time relative to reservoir parameters.
This second pressure build-up portion of the DST, following a reasonably long flowing period,
usually provides data for transient pressure analysis. Some-times DST`s are designed having two
reasonably long flowing period and subsequent shut-in periods, to provide verification of
calculations, and to permit more sophisticated well testing techniques. Figure – 56 is typical of
actual multiple-flow-period charts with key points described therein.
Figure - 55: Sequence of events in a DST
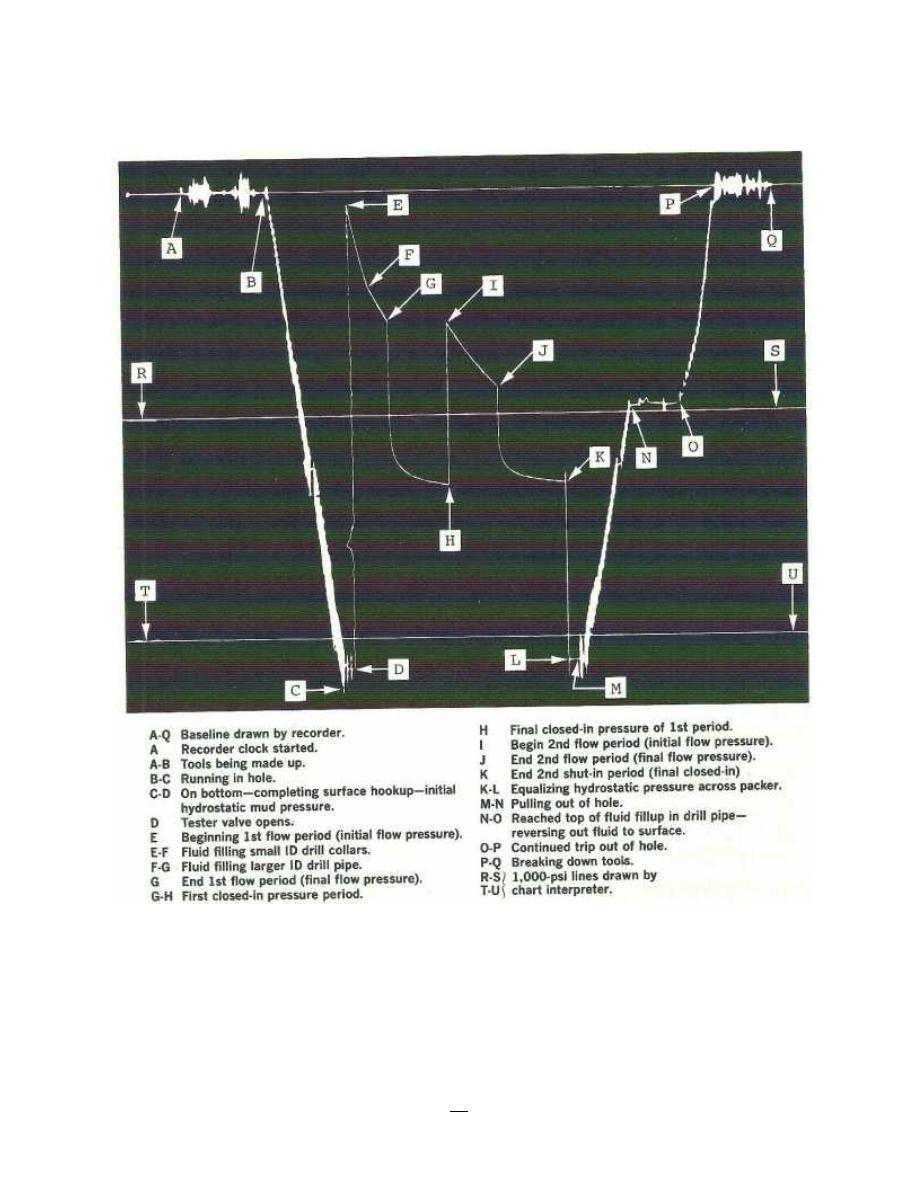
86
Production Engineering – I Herish N. Hamarash
Figure -56: Typical chart for multiple-flow period DST
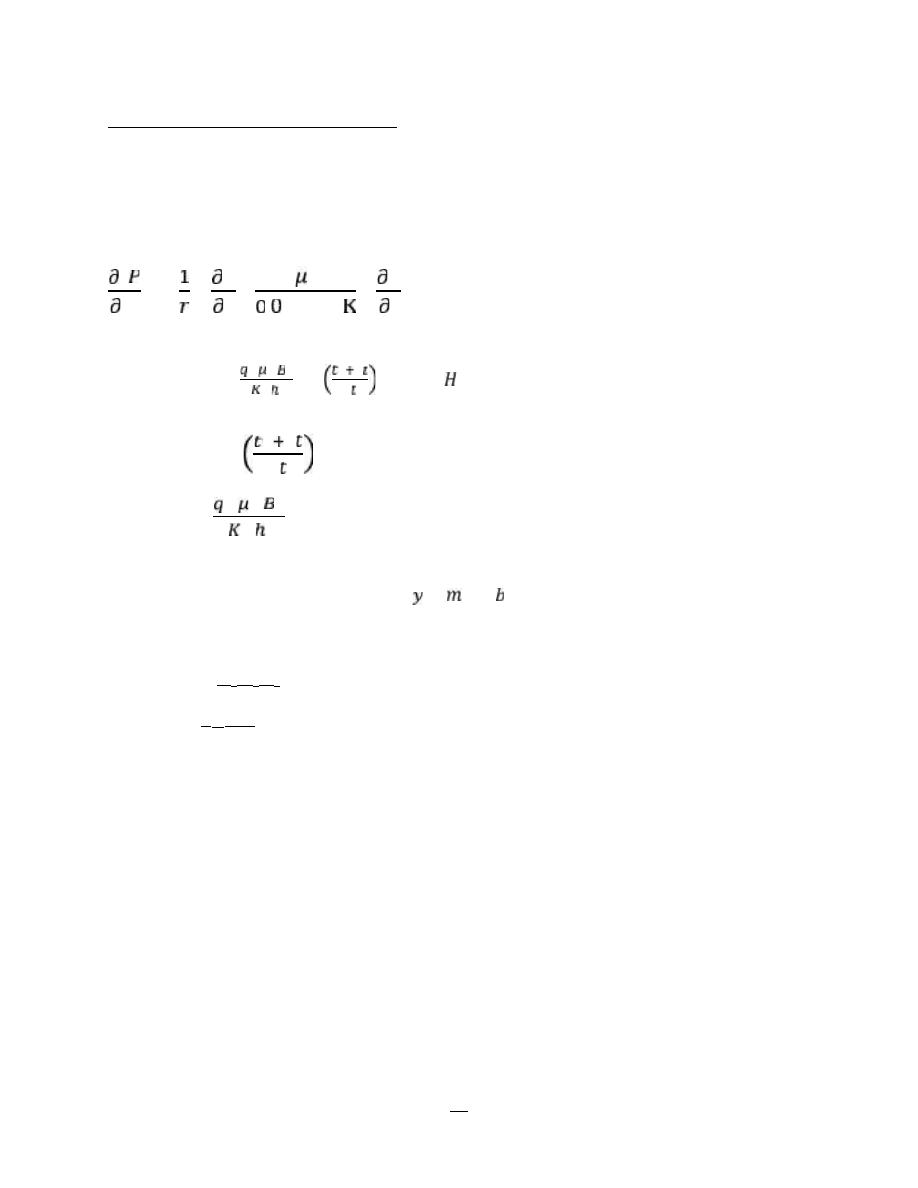
87
Production Engineering – I Herish N. Hamarash
Theory of Pressure Build-up Analysis
Horner equation- transient pressure analysis of a DST is based on the Horner pressure build-up
equation. This equation describes the repressuring of the well-bore area during the shut-in period,
as formation fluid moves into the “pressure drop” created by the following portion of the DST,
Horner equation is the one of solutions of diffusivity equation for fluid flow in porous media:
²
²
+ .
=
∅
.
.
………. (Diffusivity Equation) …… (2-1)
p
ws =
p
i –
162.6
log
∆
∆
… … … . (
) … … … … … … … . . (2 − 2)
p
ws =
p
i + m
log
∆
∆
m =
162.6
… … … … … … … (2 − 3)
Comparing Eq.(2-3) with the equation of a straight line,
=
+
y ~ p
ws
b ~ p
i
m ~ 162.6 q
o
B
o
µ
o
k
o
h
x ~ log ((t
p+
∆t) )
∆t
y = a + mx
p
ws
= shut in pressure (bottom hole pressure) measured in the well-bore during build up,
psi
p
i
= static or initial shut-in reservoir pressure, psi
k
o
= oil permeability, md
B
o
= formation volume factor, RB/STB
q
o
= oil production rate, STB/day
∆t = shut in time, hr
t
p
= flowing time, hr
µ
o
= oil viscosity, cp
h = production zone thickness, ft
c
t
= reservoir fluid compressibility, dimensionless
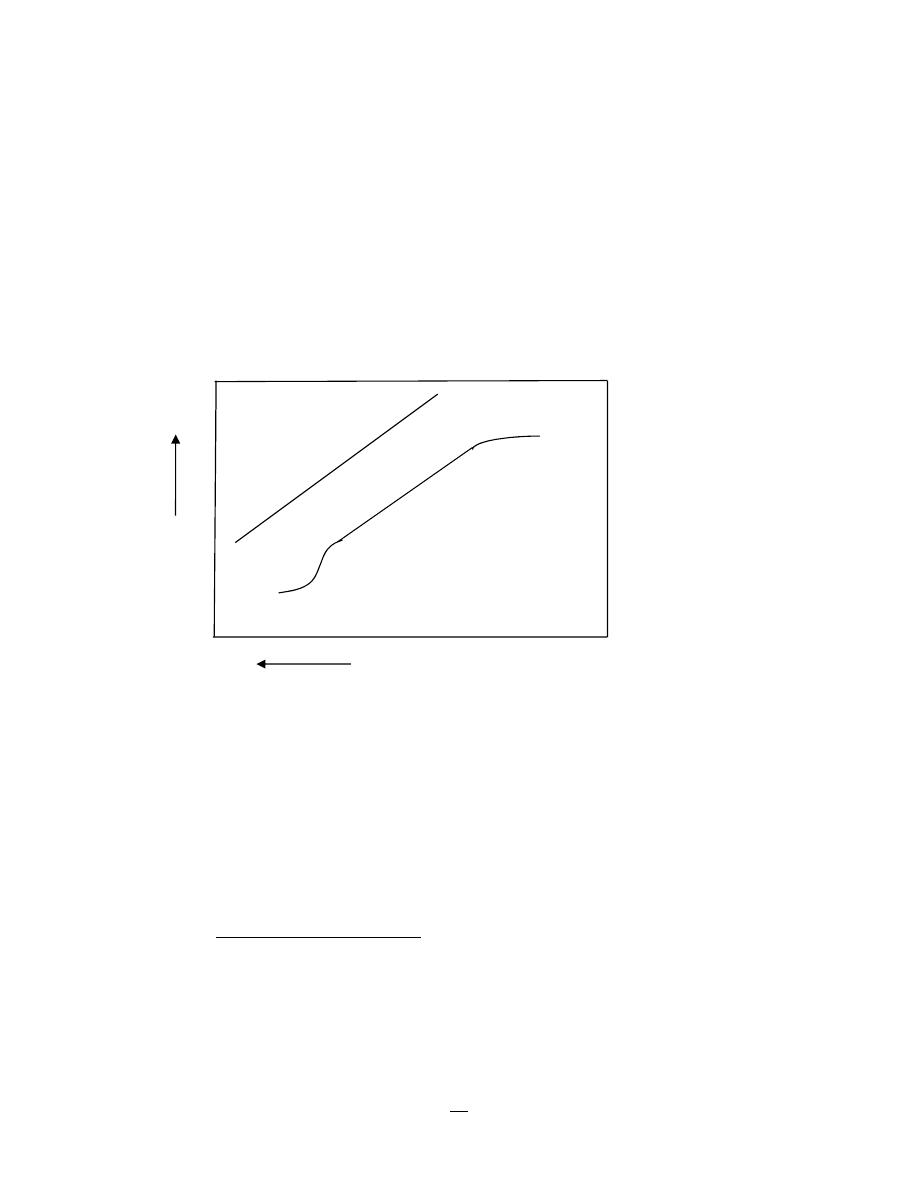
88
Production Engineering – I Herish N. Hamarash
Conditions which must be assumed during the build-up period for Horner equation to be strictly
correct are:
1- Radial flow, steady state flow
2- infinite-acting reservoir
3- Homogenous & isotropic porous media
4- Single phase flow
5- Gravitational force is ignored
Assuming these conditions are met, then Horner build-up plot of p
ws
versus ((t
p
+ ∆t)) /∆t) on
semi-logarithmic paper should yield as shown in figure - 57:
For ideal buildup pressure test, obtain a single straight line for all times, any well-bore damage
or stimulation is considered to be concentrated in a skin of zero thickness at the well-bore; at
the instant of shut-in, flow into the well-bore ceases totally.
For actual buildup test, obtain a curve with a complicated shape. To explain what went wrong,
the radius of investigation concept is useful. Based on this concept, we logically can divide a
buildup curve into three regions;
I.
An early-time region (ETR) during which a pressure transient is moving through
the formation nearest the well-bore, (include well-bore effects → well-bore storage,
skin factor and non-Darcy effects).
LTR
MTR
ETR
Figure -57: Horner plot for pressure buildup test.
P
WS
LOG (( t
p
+∆t)/∆t)
Ideal well
Actual well
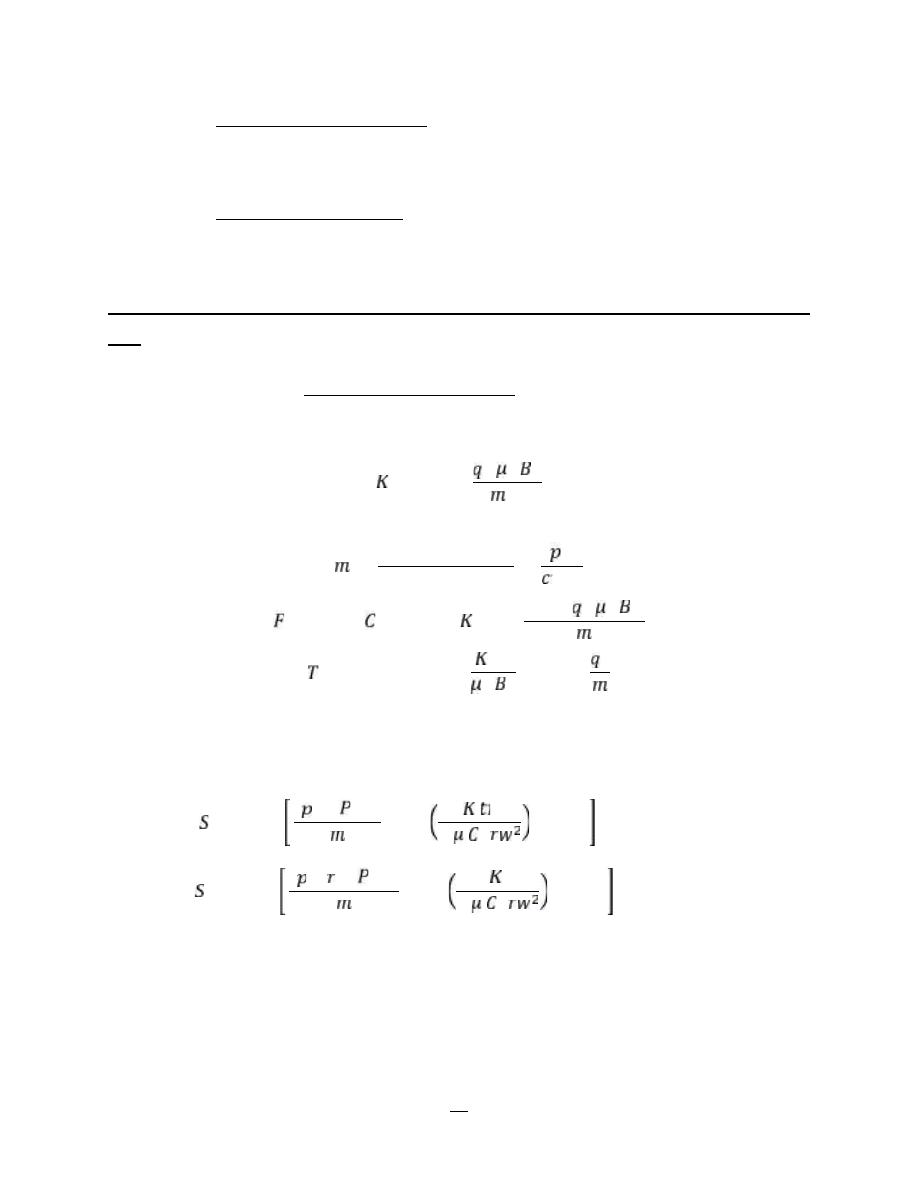
89
Production Engineering – I Herish N. Hamarash
II.
A middle-time region (MTR) during which the pressure transient has moved away
from the well-bore and into the bulk formation. And the data are take from this
region to estimate formation properties because its consider reservoir behavior.
III.
A late-time region (LTR), in which the radius of investigation has reached the well's
drainage boundaries.
Steps of determining reservoir properties by using Horner plot to analysis pressure buildup
test:
1- Plot p
ws
vs. ((t
p
+ ∆t) / ∆t ) on semi-logarithmic paper, then delineate the straight line from
MTR is called the correct semi-log straight line , the straight line slope (m) is found by
simply subtracting the pressure at any two points on the straight line that are one cycle
apart on the semi-log paper. Using absolute value of (m) to estimate effective formation
permeability (k
o
), by using this equation;
= 162.6
ℎ
Where;
=
(pws2 – pws1)
(log(10) – log(1)) =
=
ℎ =
162.6
=
ℎ
= 162.6
2- From semi-log graph, the original reservoir pressure (p
i
), is estimated by extrapolating the
straight line to infinite shut-in time where ((t
p
+ ∆t) / ∆t) = 1.
3- Also can determine skin factor, s from the data available, by use the following equation:
= 1.151
( −
)
− log ∅
+ 3.23 … … … . . (2 − 4)
Or
= 1.151
( 1ℎ −
)
− log ∅
+ 3.23 … … … (2 − 5)
In summary, if we plot p
ws
vs. log ((t
p
- ∆t) / ∆t) with information obtained from a pressure buildup
test, we can estimate effective permeability, k, original reservoir pressure, p
i
, and the skin factor,
S.
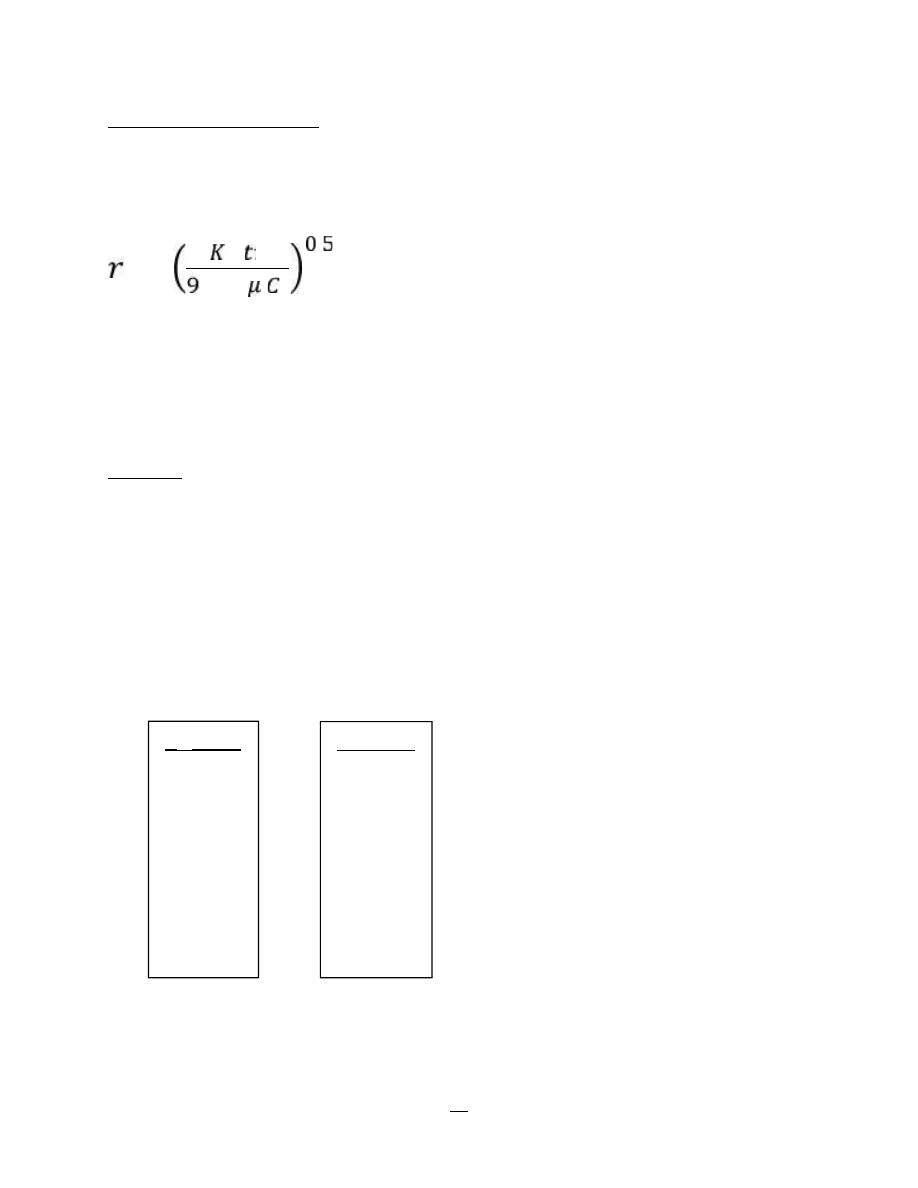
90
Production Engineering – I Herish N. Hamarash
Radius of investigation ( r
i
)
It's a distance that a pressure transient has moved into a formation following a rate change in a
well, this distance is related to formation rock and fluid properties and time elapsed since the rate
change.
=
∅
.
.............. (2-6)
r
i
= investigation radius, ft. k
o
= permeability, md. t
p
= flow time, hours. Ø = porosity.
µ
o
= viscosity, cp. c
t
= total compressibility, psi
-1
Example:
DST analysis, from this data
Thickness of testing formation = 50 ft
Section length of produce oil = 600 ft (steam testing)
Steam testing consist of:
1- Drill collar pipe length = 300 ft , capacity = 0.0061 bbl/ft
2- Drill pipe capacity = 0.0142 bbl/ft
Oil API = 35, reservoir temperature = 120 F
t
p
i = 5 minute, Δti = 30 minute, p
ws
i = 1910 psi
t
p
f= 60 minute, Δtf = 45 minute, p
wf
f = 350 psi, p
ws
f = 1765 psi
Data of p
ws
f vs. Δtf
Determine the following:
1-
p
i
2-
q
o
3-
k
o
= ?, µ
o
= 1.5 cp, B
o
= 1.15 RB/STB, Net pay thickness = 10 ft
p
ws
f (psi)
965
1215
1405
1590
1685
1725
1740
1753
1765
Δtf (min)
5
10
15
20
25
30
35
40
45
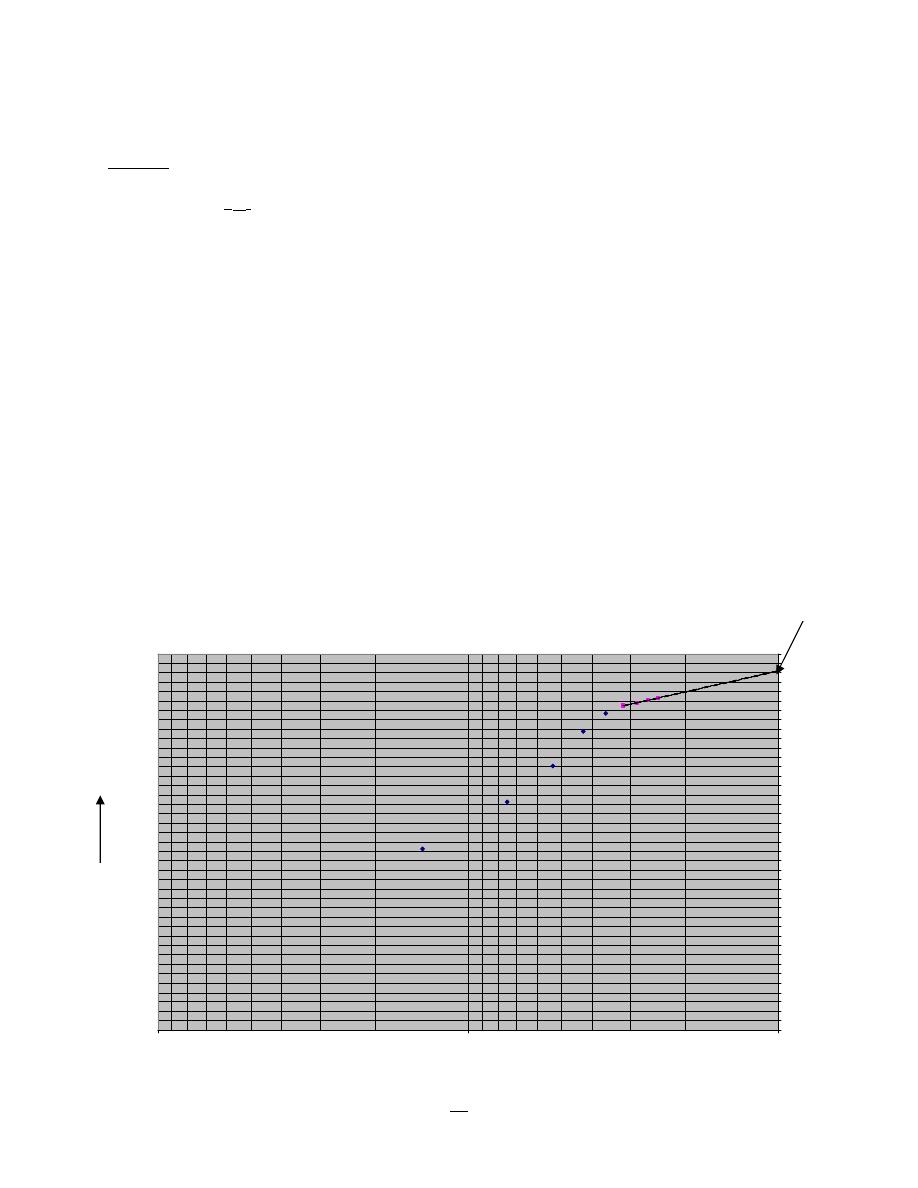
91
Production Engineering – I Herish N. Hamarash
4-
FE
5-
r
i
= ?, Ø = 10%, c
t
= 8.4*10
-6
psi
-1
Solution
1- Plot p
ws
f vs. ((t
p
+Δt)/Δt) on semi-log paper, draw the straight line from the transient
region, extent the line to intercept it with ((t
p
+Δt)/Δt) = 1, to determine p
i
= 1910 psi.
2- Total produce oil rise in drilling pipe = 600 ft during 65 minute flowing time, then oil
volume in drill collar pipe = (300*0.0061 = 1.83 bbl), oil volume in drill pipe =
(300*0.0142 = 4.26 bbl), the total oil volume produce = (1.83+4.26 = 6.09 bbl).
q
o
= 6.09 bbl / 65 min * 1440 min/day = 135 bbl/day.
3- By slope of straight line, determine k
o
k
o
= 162.6* 135*1.5*1.15 / 372*10 = 10.2 md
4- Determine FE,
S =
1.151 [((1910-350)/372) - (log(10.2*(65/60) / 0.1*1.5*8.4*10
-6
0.333²) + 3.23]
S = - 0.55
ΔP
skin
= 141.2 *(135*1.5*1.15 / 10.2*10) * -0.55 = -323.4 psi
FE = 1910 – 350 – (-323.4) / 1910 – 350 = 1.2
5- r
i
= [ 10.2*65 / 5.76 * 10
4
*0.1*1.5*8.4*10
-6
]
½
= 95.6 ft
0
50
100
150
200
250
300
350
400
450
500
550
600
650
700
750
800
850
900
950
1000
1050
1100
1150
1200
1250
1300
1350
1400
1450
1500
1550
1600
1650
1700
1750
1800
1850
1900
1950
2000
1
10
100
P
i
= 1910 psi
p
ws
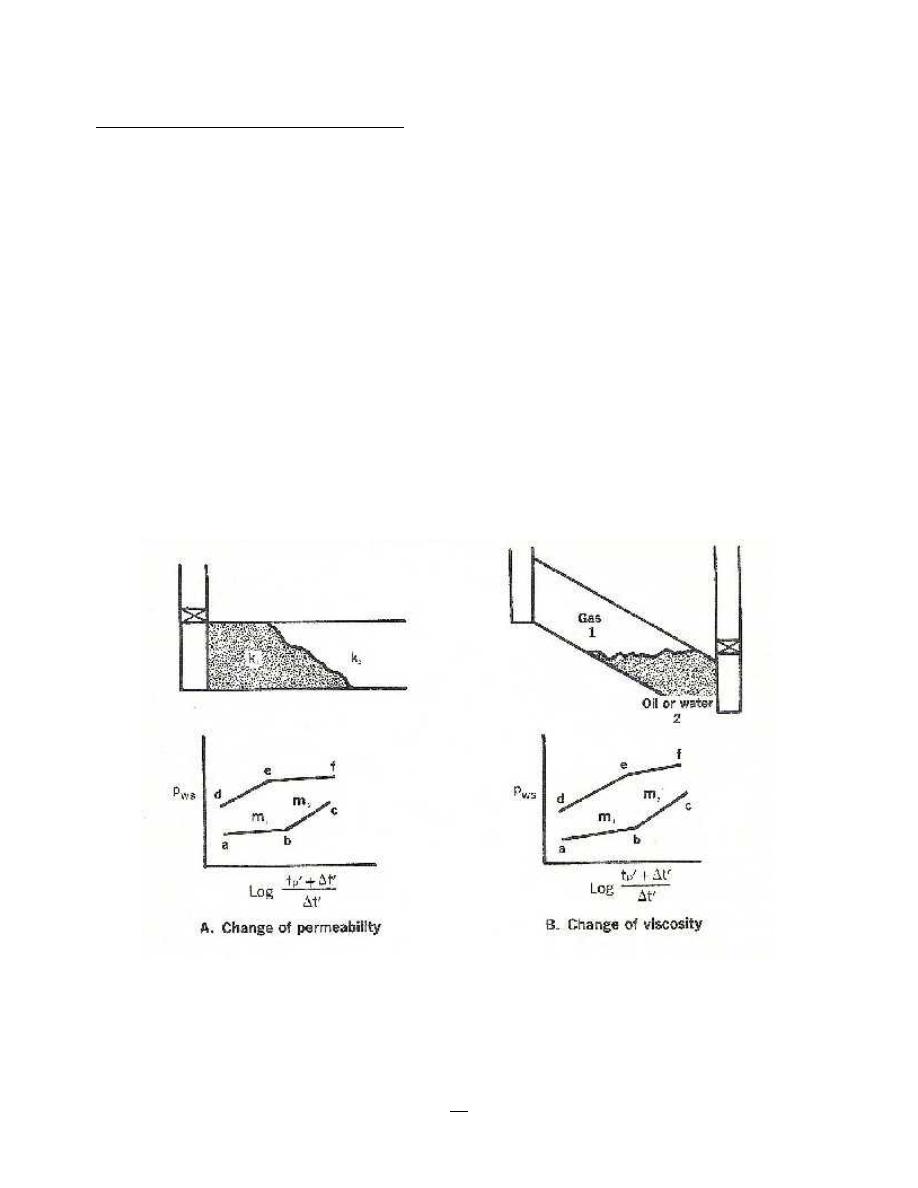
92
Production Engineering – I Herish N. Hamarash
Reservoir and fluid anomaly indications
Many times the assumption of the Horner build-up equation, homogeneous formation, single phase
flow and infinite reservoir, do not hold in an actual case. If changes occur within the radius of
investigation of the DST, they can be detected by a change in slope of the Horner build-up plot.
Permeability or Viscosity- Examining the Horner slope equation, it is seen that if rate of flow q
remains constant, then permeability k, or fluid viscosity µ, are likely suspects for change as the wave
of increasing pressure travels toward the well-bore.
Permeability may change due to natural lensing or due to formation damage, figure – 58 A. It is
doubtful, however, that formation damage would affect sufficient volume of formation to be
detected as a change of slope on the build-up plot. Fluid viscosity could change due to a change in
fluid phase or type (i.e., gas to oil). “Seeing” the gas-liquid contact from the up-structure well of
figure – 58 B, would be difficult, due to the normally short radius of investigation through a gas
column. Seeing the gas-liquid contact from the down-structure well is a much more likely
possibility.
Figure – 58: Effect of changing permeability and viscosity
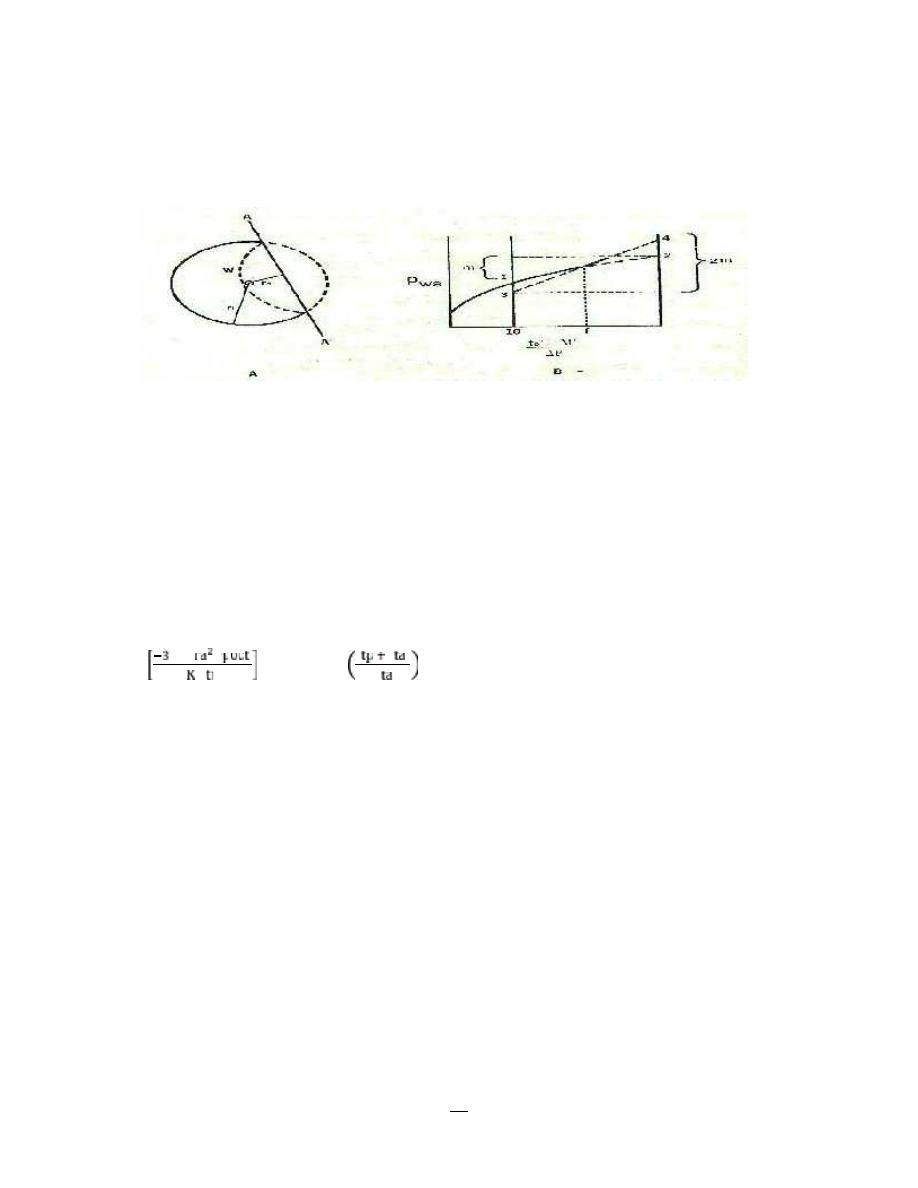
93
Production Engineering – I Herish N. Hamarash
Barrier- A sealing barrier such as a fault or permeability pinch-out can cause a change of m. if
the barrier is a straight line as A-A` in figure – 59 A, then the build-up slope will change by a
factor of 2, figure – 59 B.
Figure - 59Effect of a fault
In summary, a change in permeability, or viscosity, or existing of a barrier, all can cause a change
in the slope of the Horner plot. Thus, the fact that a change in slope appears on the build-up plot
leaves open the question of what caused the anomaly. This must be resolved through other geologic
or reservoir information.
Distance to anomaly (Fault)- The distance to the anomaly, (r
a
) whether it be a barrier, or change
of permeability, or a fluid contact, can be calculated using Horner’s equation:
– Ei
Ø
= 2.303 ln
(
∆ )
∆
… … …(2-7)
r
a
= Distance to anomaly, ft
t
p =
Flow time, hours
∆t
a
= shut-in time at the point of slope change, hours
– E
i
= Exponential integral value- See figure – 60.
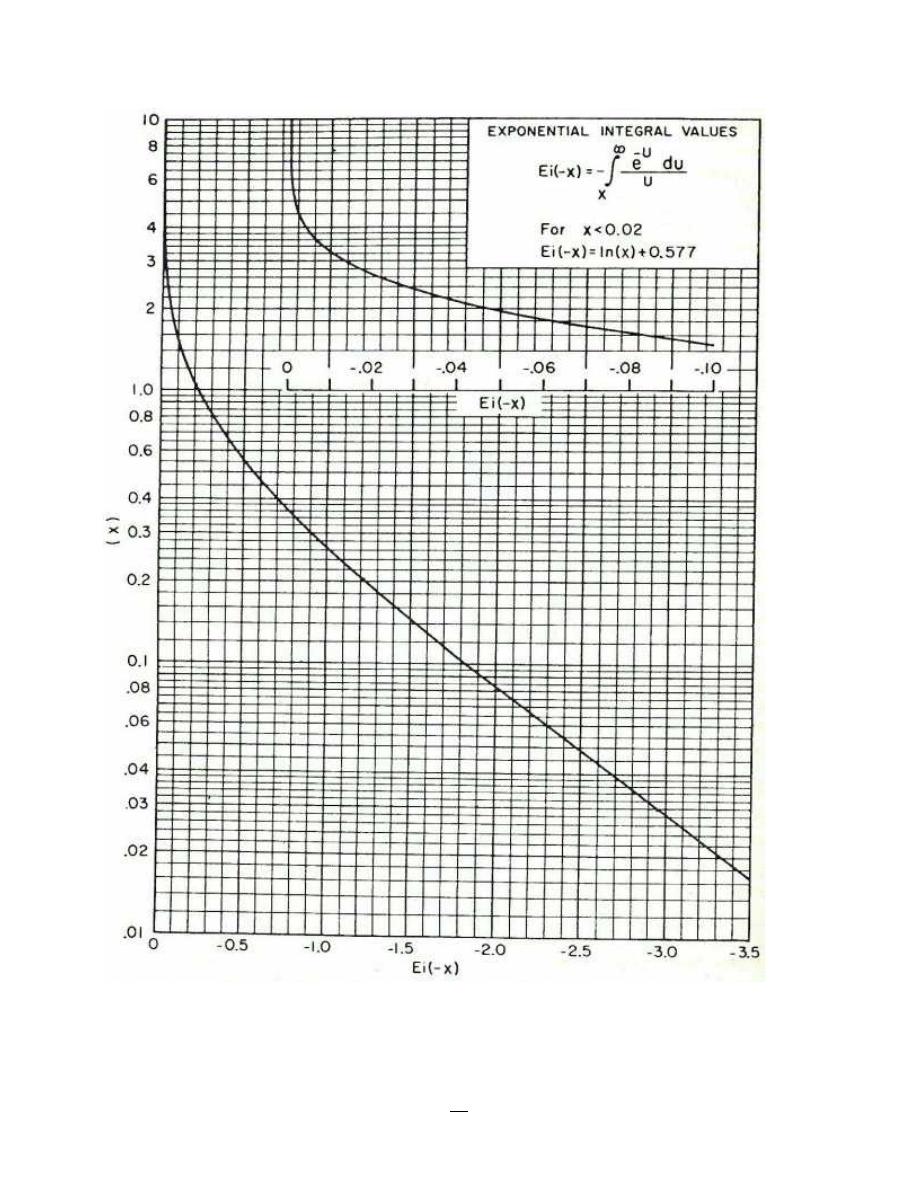
94
Production Engineering – I Herish N. Hamarash
Figure – 60: Exponential integral values

95
Production Engineering – I Herish N. Hamarash
Depletion
If the extrapolated or stabilized shut-in pressure from the second build-up is lower than the initial
shut-in pressure, a depleting reservoir may be the cause. Obviously a reservoir must be extremely
small for depletion to occur on a DST, but many field examples are available to prove that it can
occur.
Another possibility, however, is that the recorded initial shut-in pressure may be higher than true
shut-in reservoir pressure. This effect is called supercharge. Supercharge could be due to leak off
of drilling fluid filtrate over-pressuring the formation around the well-bore, or to compression of
well fluid below the DST packer as it was set.
In some formations a short initial flowing period (1 to 3 minutes) is not sufficient to relieve the
over-pressured condition. Where this condition is suspected to exist, longer initial flowing periods
(perhaps 20 minutes) should be used.
The important point is that the question of supercharge must be resolved before depletion can be
diagnosed. A second DST is sometimes required to define depletion.
Example; A new oil well produced 123 STB/Day for 97.6 hours; it then was shut-in for a pressure
buildup test, during which the data in table (1) were recorded.
Δt = 12 hours, p
wf
= 4506 psi.
Table (1) pressure buildup test data
p
ws
(psi)
4506
4675
4705
4733
4750
4757
4761
4763
4766
4770
4773
4775
Δt (hrs)
0
0.5
0.66
1
1.5
2
2.5
3
4
6
8
10
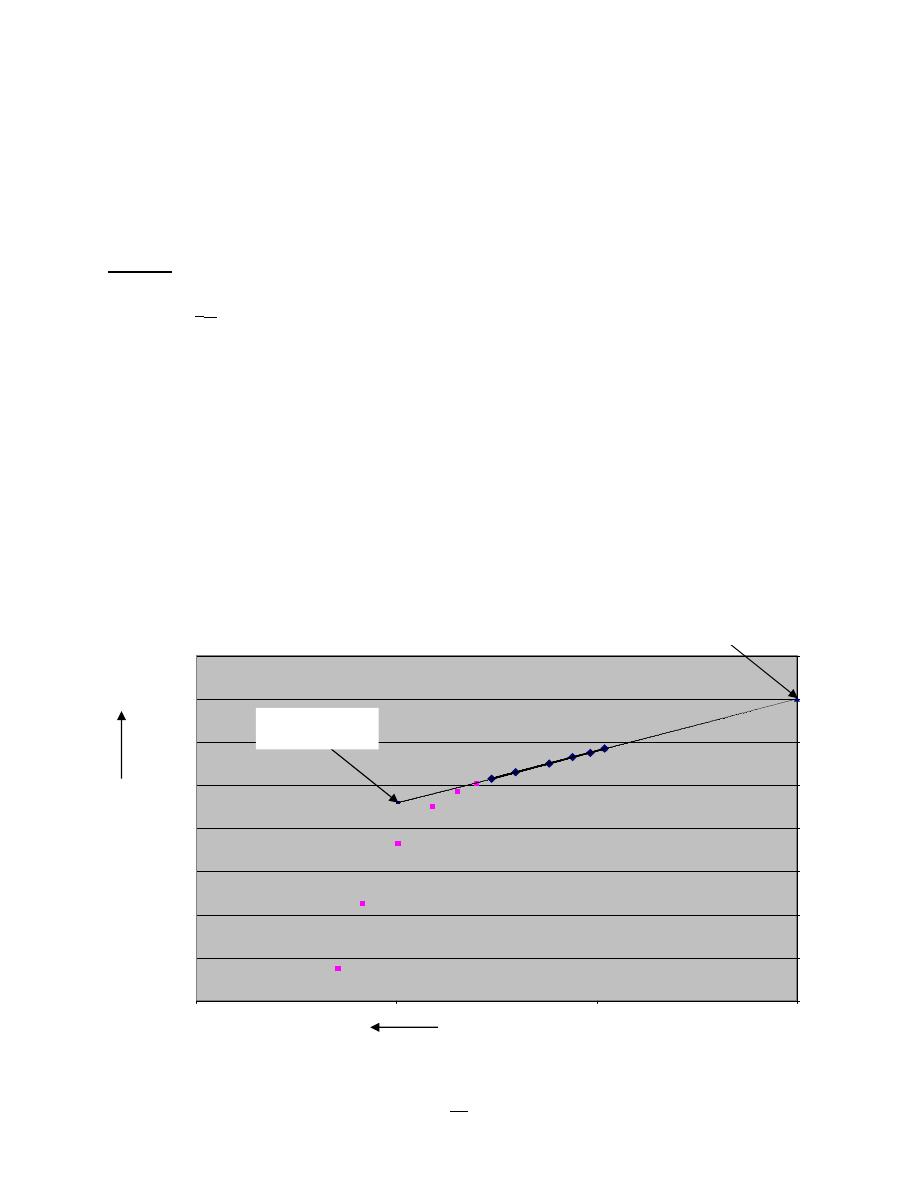
96
Production Engineering – I Herish N. Hamarash
Determine the following:
1-
p
i
2-
k
o
= ?, µ
o
= 1 cp, B
o
= 1.22 RB/STB, Net pay thickness = 20 ft
3-
FE
4- r
i
= ?, Ø = 20%, c
t
= 20*10
-6
psi
-1
,
r
w
= 0.3 ft.
Solution
1- Plot p
ws
vs. ((t
p
+Δt)/Δt) on semi-log paper, draw the straight line from the transient region
MTR, extent the line to intercept it with ((t
p
+Δt)/Δt) = 1, to determine p
i
= 4800 psi.
2- By slope of straight line, determine k
o
m = (4800 – 4775.5) / (log10 – log 1 ) = 24.5 psi / cycle.
k
o
= 162.6* 123*1*1.22 / 24.5*20 = 50 md
3- Determine FE,
s = 1.151 [((4752-4506)/24.5) - (log(50 / 0.2*1*20*10
-6
0.3²) + 3.23]
s = 6
ΔP
skin
= 141.2 *(123*1*1.22 / 50*20) * 6 = 128 psi
FE = (ΔP - ΔP
skin
) / ΔP = (4800 – 4506 – (128)) / (4800 – 4506) = 0.56
4- r
i
= [ 50*97.6/ 948 *0.2*1*20*10
-6
]
½
= 1134 ft
4660
4680
4700
4720
4740
4760
4780
4800
4820
1
10
100
1000
((t
p
+Δt)/Δt)
p
ws
P
1 hr
= 4752 psi
P
i
= 4800 psi

97
Production Engineering – I Herish N. Hamarash
Oil and Gas Separation
Produced well-head fluids are complex mixtures of different compounds of hydrogen and carbon,
all with different densities, vapor pressures, and other physical characteristics. As a well stream
flows from the hot, high-pressure petroleum reservoir, it experiences pressure and temperature
reductions. Gases evolve from the liquids and the well stream changes in character. The velocity
of the gas carries liquids droplets, and the liquid carries gas bubbles. The physical separation of
these phases is one of the basics operations in the production, processing, and treatment of oil and
gas.
In oil and gas separator design, we mechanically separate from a hydrocarbon stream the
liquid and gas components that exist at a specific temperature and pressure. Proper separator design
is important because a separation vessel is normally the initial processing vessel in any facility,
and improper design of this process component can “bottleneck” and reduce the capacity of the
entire facility.
Separators are classified as “two-phase” if they separate gas from the total liquid stream
and “three-phase” if they also separate the liquid stream into its crude oil and water components.
Separators are sometimes called “gas scrubbers” when the ratio of gas rate to liquid rate is
very high. Some operators use the term “traps” to designate separators that handle flow directly
from wells. In any case, they all have the same configuration and are sized in accordance with the
same procedure.
Factors effecting separation
Characteristics of the flow stream will greatly affect the design and operation of a separator.
The following factors must be determined before separator design;
1- Gas and liquid flow rates (minimum, average, and peak)
2- Operation and design pressures and temperatures.
3- Surging and slugging tendencies of the feed streams.
4- Physical properties of the fluids such as density and compressibility.
5- Designed degree of separation (e.g., removing 100% of particles greater than 10 microns).
6- Presence of impurities (paraffin, sand, scale, etc.).
7- Foaming tendencies of the crude oil.
8- Corrosive tendencies of the liquids or gas.
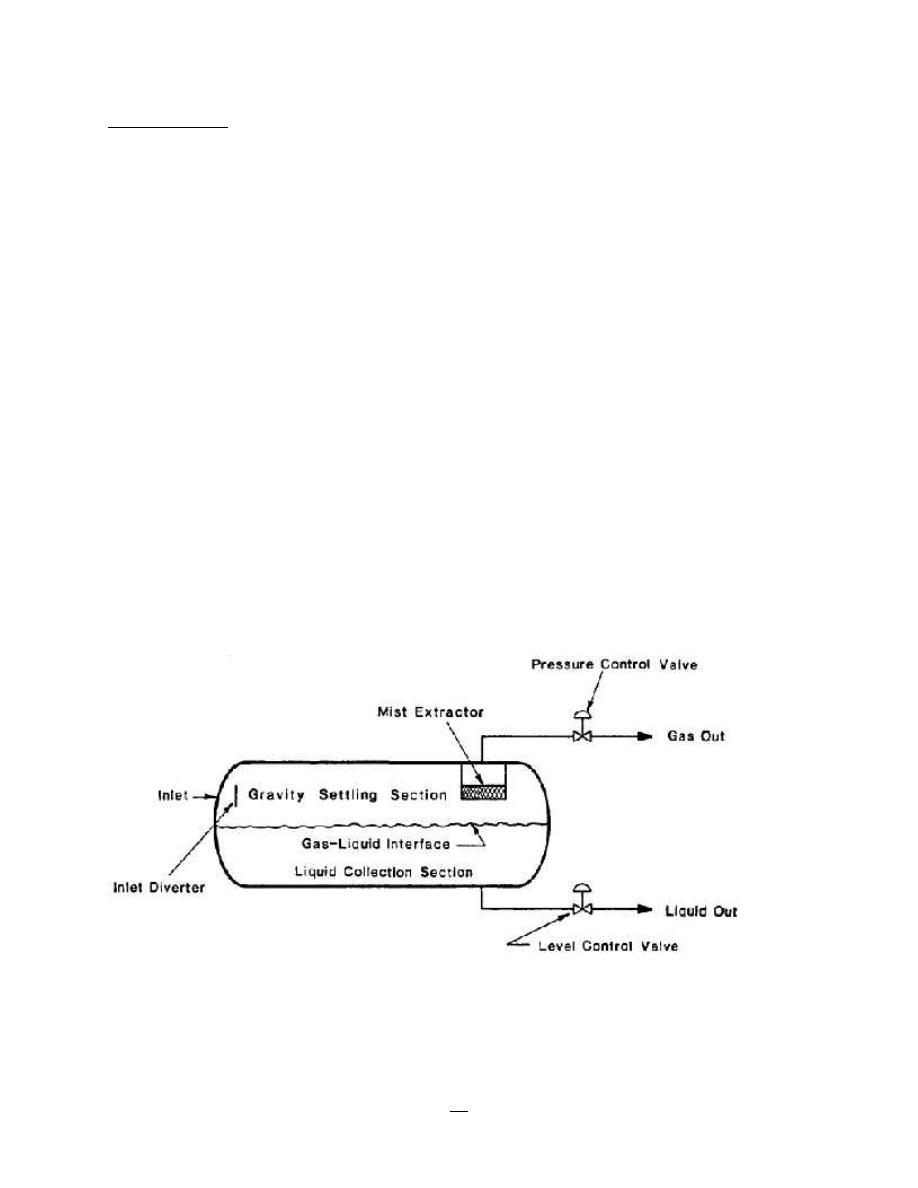
98
Production Engineering – I Herish N. Hamarash
Vessel internals
Figure -61 is a schematic of a separator.
1-
Inlet diverters (primary separation section); there are many types of inlet diverters. Two
main types are baffle plates and centrifuge diverters (shown in figure - 62). A baffle plate
can be a spherical dish, flat plate, angle iron, cone, or just about anything that will
accomplish a rapid change in direction and velocity of the fluids and thus disengage the
gas and liquid.
2-
Mist extractor (secondary separation section); some of the drops are of such a small
diameter that they are not easily separated in the gravity settling section, before the gas
leaves the vessel it passes through mist extractor. This section uses elements of vanes, wire
mesh, or plates (as shown in figure - 63) to coalesce and remove the very small droplets
of liquid in one final separation before the gas leaves the vessel.
3-
Gas out; by controlling the rate at which gas leaves the vapor space of the vessel the
pressure in the vessel is maintained, the pressure in the separator is maintained by a
pressure controller.
4-
Collection section; the liquid collection section provides the retention time required to let
entrained gas evolve out the oil and rise to the vapor space.
5-
Liquid out; the liquid leaves the vessel through the liquid dump valve, where it is regulated
by a level controller. The level controller senses changes in liquid level and controls the
dump valve accordingly.
Figure – 61: separator schematic.
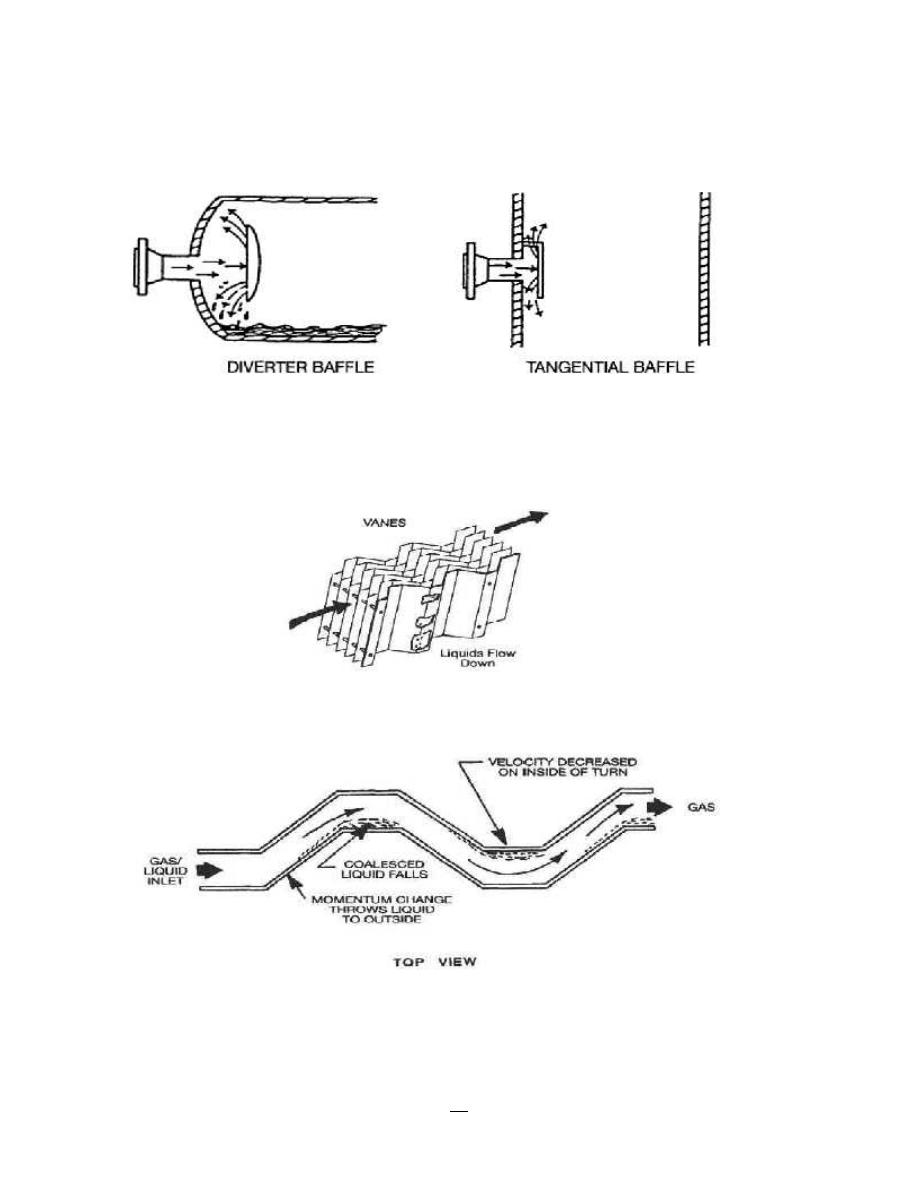
99
Production Engineering – I Herish N. Hamarash
Figure – 62:baffle plates.
Figure – 63: mist extractor.
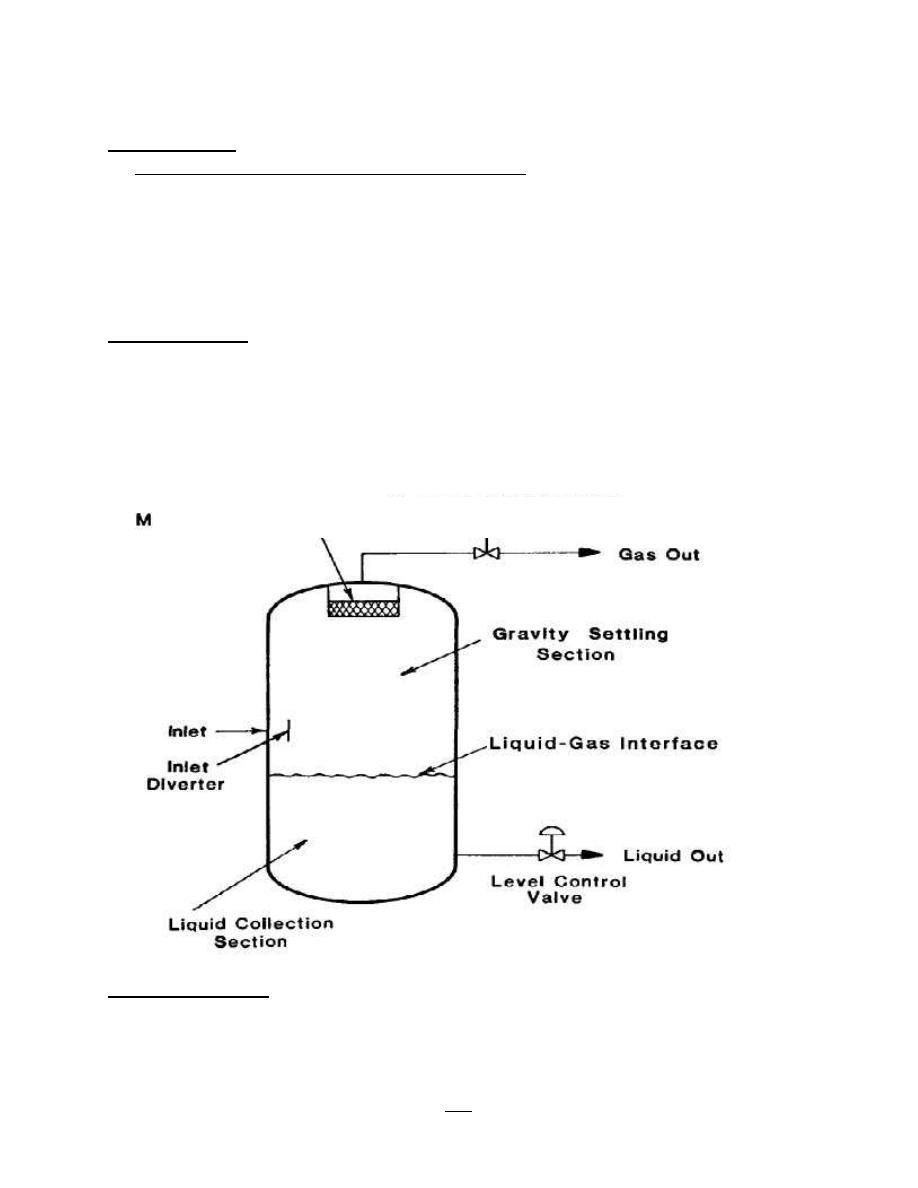
100
Production Engineering – I Herish N. Hamarash
Separators types
Classification of separators according to configuration:
a- Vertical separators
b- Horizontal separation
1- mono tube
2- dual tube
c- Spherical separators
Vertical separator
Figure - 64 is a schematic of a vertical separator. The advantages are;
1- Adequate for medium or low GOR fluids.
2- Easy to remove the impurities (paraffin, sand, scale, etc.) from inside the vessel.
3- Vertical vessel requires small plan area, it could be very important in offshore.
4- Relatively easy to deal with the effluent liquids waves.
Horizontal separator
Figure - 65 is a schematic of two types of horizontal separator. The advantages are;
1- Adequate for high GOR fluids and foaming oil.
2- Less expensive compare with the other types.
Figure -64: schematic of a vertical separator.
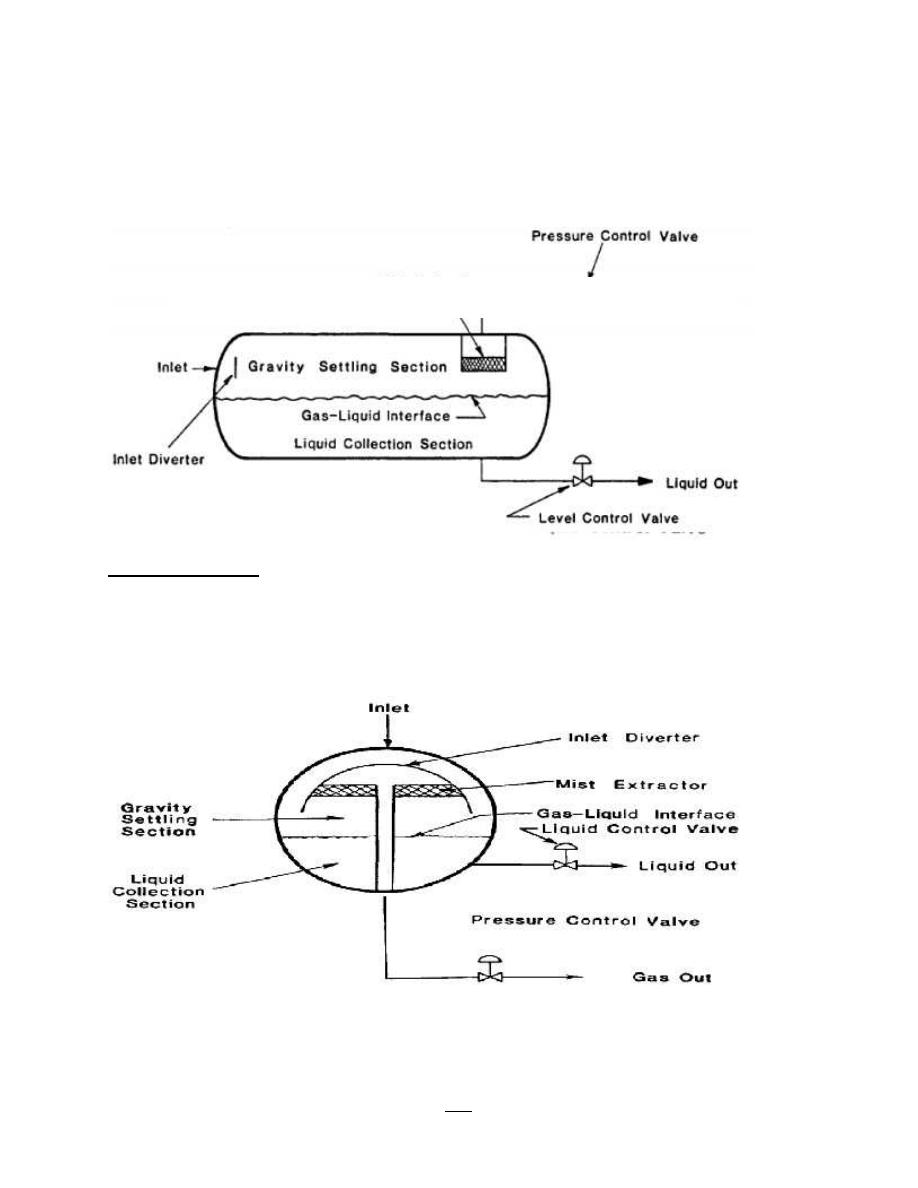
101
Production Engineering – I Herish N. Hamarash
3- The interface area is larger in a horizontal vessel than the other types; it is easier for the
gas bubbles, which come out of solution as the liquid approaches equilibrium, to reach the
vapor space.
4- Easy to shipping and structure.
Spherical separator
Figure – 66 is a schematic of a spherical separator. The advantages are;
1- Use for low and homogenous production rate.
2- More cheap than Vertical and horizontal separators.
3- Easy to clean and drain.
Figure – 65: schematic of a horizontal separator.
Figure – 66: schematic of a spherical separator.

102
Production Engineering – I Herish N. Hamarash
Classification of separators according to function:
1- Two phases separators.
2- Three phases separators.
Classification of separators according to operating pressure:
1- High pressure separators [1500 psi]
2- Medium pressure separators [650 psi]
3- Low pressure separators [60 psi]
Separators Design
The basic factors that effect on separators design are;
1- Working pressure.
2- Working temperature.
3- Fluid components.
Separator design consisting as follows;
1- Calculate gas section capacity.
2- Calculate oil section capacity.
Capacity of a vertical separator
1- Gas capacity
Suppose there is a liquid drop in the gravity settling section, the liquid drops will settle at
a velocity determined by equating the gravity force (F
d
), on the drop with the drag force (F
u
)
caused by its motion relative to the gas continuous phase.
- Upward force F
u
= (π/4) d
p
² k ρ
g
u² …(1)
- Downward force F
d
= (π/6) d
p
³ (ρ
o
- ρ
g
) g …(2)
d
p
= droplet diameter
k = empirical constant
ρ
g
= gas density lb/ft³
ρ
o
= oil density lb/ft³
u = gas velocity
g = acceleration due to gravity
If F
u
= F
d
Then the droplet will remain suspended and gas velocity call suspending velocity.
(π/4) d
p
² k ρ
g
u² = (π/6) d
p
³ (ρ
o
- ρ
g
) g ….(3)

103
Production Engineering – I Herish N. Hamarash
u = [ 2g d
p
(ρ
o
- ρ
g
) / (3k ρ
g
) ]
0.5
….(4)
If u = d
p
& k remain constant then
u = c [(ρ
o
- ρ
g
) / ρ
g
]
0.5
….(5)
u = suspending velocity
c = [ 2g/3k ]
0.5
= separate constant
q
g
= (π/4) d² u …. (6)
d = inside diameter of separator
q
g
= (π/4) d² c [(ρ
o
- ρ
g
) / ρ
g
]
0.5
….(7)
q
g
= gas flow rate at separator condition Scf/sec
Apply mass balance equation on gas under separator condition and standard condition:
q
g
ρ
g
= q
gsc
ρ
gsc
….(8)
q
gsc
= gas flow rate at standard condition Scf/sec
ρ
gsc
= gas density at standard condition lb/ft³
ρ
g
= p Mw / zRT …. (9)
γ
g
= Mw gas / Mw air = Mw gas / 29
ρ
gsc
= p
sc
Mw / RT
sc
…. (10)
Mw = Molecular weight
z = Gas deviation factor (compressibility factor)
R = Gas constant
T = Temperature
γ
g
= Gas specific gravity
Substitute eq. (7),(9) & (10) in eq. (8)
q
gsc
= (π/4) d² c [(ρ
o
- ρ
g
) / ρ
g
]
0.5
(p Mw / zRT) / (p
sc
Mw / RT
sc
)
In field units:
q
gsc
= 67824 * 10
-6
d² c [(ρ
o
- ρ
g
) / ρ
g
]
0.5
(p T
sc
/ zTp
sc
) …(11)
q
gsc
= gas flow rate at standard condition, MMScf/day
d = inside diameter of separator, ft
p = separator operating pressure, psia
p = standard pressure = 14.7 psia
T = separator operating temperature,
o
R
T
sc
= standard temperature = 520
o
R, (
o
R =
o
F + 460)
q
gsc
= 2.4 d² c [(ρ
o
- ρ
g
) / ρ
g
]
0.5
(p / zT) …(11)

104
Production Engineering – I Herish N. Hamarash
2- Oil capacity
Oil capacity design depended on retention time; therefore this time should be enough to
give solution gas in oil the chance to be freely.
For most application retention times of between 30 seconds and 3 minutes have been found
to be sufficient. Where foaming crude is present retention times up to four times this amount may
be needed.
V
o
= (π/4) d² h
o
….(12)
V
o
= volume of oil section, ft³
d = inside diameter of separator, ft
h
o
= height of oil section, ft
q
o actual
= V
o
/ t
q
o actual
= (π/4) d² h
o
/ t (1/5.615) (1440)
q
o actual
= 201.4 d² h
o
/ t ….(13)
q
or
= 1/2 q
o actual
q
or
= 100.7 d² h
o
/ t ….(14)
q
o actual
= actual oil capacity bbl/day
q
or
= rated oil capacity under separator condition bbl/day
t = retention time, minute
From oil capacity and gas capacity calculations can determine inside diameter of separator,
height of gas section (gas section volume), height of oil section (oil section volume), and then
separator volume (gas section volume + oil section volume).
The volume (size, d) of a vertical separator can be estimated approximately (ignore
temperature, gas density and some factors effects), if the following data are known:
1- Operating pressure
2- Oil gravity (API)
3- Gas capacity (daily gas production MMcf/day)
and by figure (4-7), determine (d).
Capacity of a vertical separator = 9.7 * 10
-4
d² , d in inch
Generally height of gas section, h
g
= 2 d
Estimating height of oil section, h
o
Volume of oil section, V
o
= oil production rate, q
o
* retention time, t
Height of oil section, h
o
(ft) = V
o
, bbl / separator capacity, bbl/ft
Height of a vertical separation, L = h
o
+ h
g

105
Production Engineering – I Herish N. Hamarash
Example (1):
Calculate the Gas & Oil capacity for vertical separator, use the following data:
L = 10 ft, h
o
= 3.25 ft, d = 24 in, γ
g
= 0.8, API = 45
o
, p = 400 psi,
T = 60
o
F, c = 0.167, z = 1, t = 1 minute.
Solution:
1- Apply eq.(11) to determine gas capacity:
q
gsc
= 67824 * 10
-6
d² c [(ρ
o
- ρ
g
) / ρ
g
]
0.5
(p T
sc
/ zTp
sc
) …(11)
API = (141.5/γ
o
) – 131.5
Oil specific gravity, γ
o
= 0.8017 → γ
o
= ρ
o
/ ρ
water
Oil density, ρ
o
= 62.4 * 0.8017 = 50.02 lb/ft³.
ρ
g
= p Mw
gas
/ zRT = p (Mw
air
γ
g
) / zRT = 400 (0.8*29) / 1*10.73*520
ρ
g
= 1.66 lb/ft³.
q
gsc
= 67824 * 10
-6
*(24/12)² *0.167*[(50.02 – 1.66) / 1.66 ]
0.5
(400*520 /520*14.7)
q
gsc
= 6.66 MM Scf/day
2- Apply eq.(14) to determine oil capacity:
q
or
= 100.7 *(2)² * 3.25 / 1 = 1309 bbl/day
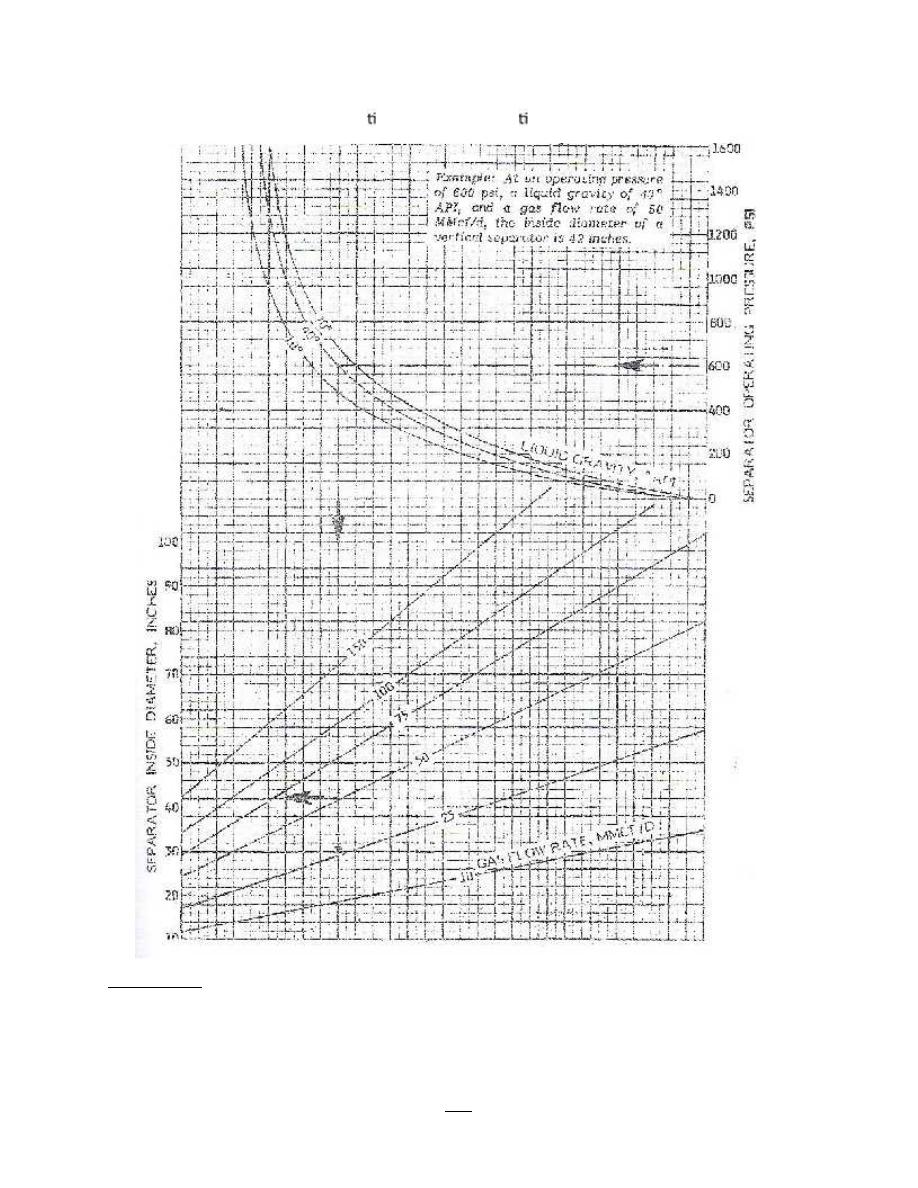
106
Production Engineering – I Herish N. Hamarash
Example (2):
Vertical separator has gas capacity = 100 MMcf/day, oil capacity = 7200 bbl/day, and
operation pressure = 400 psi, API = 70
o
, t = 0.5 minute. What is the separator design (i.e. L &
d)?
Figure (4-7) Es mate diameter of ver cal separator.

107
Production Engineering – I Herish N. Hamarash
Solution:
1- Use figure (4-7) to determine d, by p = 400 psi, API = 70
o
,
q
g
= 100 MMcf/day.
d = 72 in → h
g
= 2 d = 2* 72 / 12 = 12 ft
2- Use eq. (13) to calculate h
o
:
7200 = 201.4 * (72/12)² h
o
/ 0.5 → h
o
= 0.5 ft
L = h
g
+ h
o
= 12+0.5 = 12.5 ft.
Capacity of horizontal separators
1- Gas capacity
Total section area A
t
= (π/4) d² … (12)
Area of gas section = 1/2 total area
A
g
= (π/8) d² … (13) → A
g
= (π/4) d
e
² … (14)
d = separator diameter
d
e
= equivalent diameter
Substitute eq. (13) in eq. (14)
(π/8) d² = (π/4) d
e
²
→ de = 0.5 d
q
gsc
= 67824 * 10
-6
d
e
² c [(ρ
o
- ρ
g
) / ρ
g
]
0.5
(p T
sc
/ zTp
sc
) (L/10)
0.56
…(15)
L = height of separator, ft
2- Oil capacity
1- mono tube
q
o
= 1440V
o
/ 5.615t …(16)
V
o
= (π/4) (L/2) d² ….(17)
Substitute eq. (17) in (16)
q
o
= 100.7 (Ld²/t) …(18)
d = inside diameter of separator, ft
L = height of separator, ft
q
o
= oil capacity bbl/day
t = retention time, minute
And;
q
or
= 50.35 (Ld²/t) …(19)

108
Production Engineering – I Herish N. Hamarash
q
or
= rated oil capacity under separator condition bbl/day
2- dual tube
V
o
= (π/4) Ld² ….(20)
q
o
= 201.4 (Ld²/t) …(21)
q
or
= 100.7 (Ld²/t) …(22)
Graphically the volume (size, d) of a horizontal separator can be estimated approximately,
if the following data are known:
1- Operating pressure (psia)
2- Oil gravity (API)
3- Gas capacity (daily gas production, MMcf/day)
4- Liquid residence volume, bbl
and by figures (4-8) and (4-9), determine (d).
Example (3):
A mono tube horizontal separator has; d = 24 in, L = 10 ft, p = 400 psia,
T = 60
o
F, c = 0.382, API = 35
o
, γ
g
= 0.7, z = 0.909.t = 0.5 minute. Calculate:
1- q
or
when t = 1 minute.
2- d
e
for gas section if A
g
= 0.5 A
t.
3- q
gsc.
Solution:
1- Use eq. (19) to calculate q
or
:
q
or
= 50.35 (10*(24/12)²/1) = 2014 bbl/day
2- Use eq. (14) to calculate d
e
:
A
g
= (π/4) d
e
² … (14)
A
t
= (π/4) d² = (π/4) (24/12)² = 3.142 ft² → A
g
= 0.5 A
t
= 1.571 ft²
d
e
= √(4 A
g
)/ π =√(4 * 1.571)/ π = 1.414 ft
3- Use eq. (15) to calculate q
gsc
:
q
gsc
= 67824 * 10
-6
d
e
² c [(ρ
o
- ρ
g
) / ρ
g
]
0.5
(p T
sc
/ zTp
sc
) (L/10)
0.56
…(15)
API = (141.5/γ
o
) – 131.5
Oil specific gravity, γ
o
= 0.850 → γ
o
= ρ
o
/ ρ
water
Oil density, ρ
o
= 62.4 * 0.850= 53.03 lb/ft³.
ρ
g
= p Mw
gas
/ zRT = p (Mw
air
γ
g
) / zRT = 400 (0.7*29) / 0.909*10.73*520
ρ
g
= 1.60 lb/ft³.
q
gsc
= 67824 * 10
-6
*(1.414)² *0.0.382*[(53.03 – 1.60) / 1.60 ]
0.5
(400*520 /0.909*520*14.7) (10/10)
0.56

109
Production Engineering – I Herish N. Hamarash
q
gsc
= 8.49 MM Scf/day
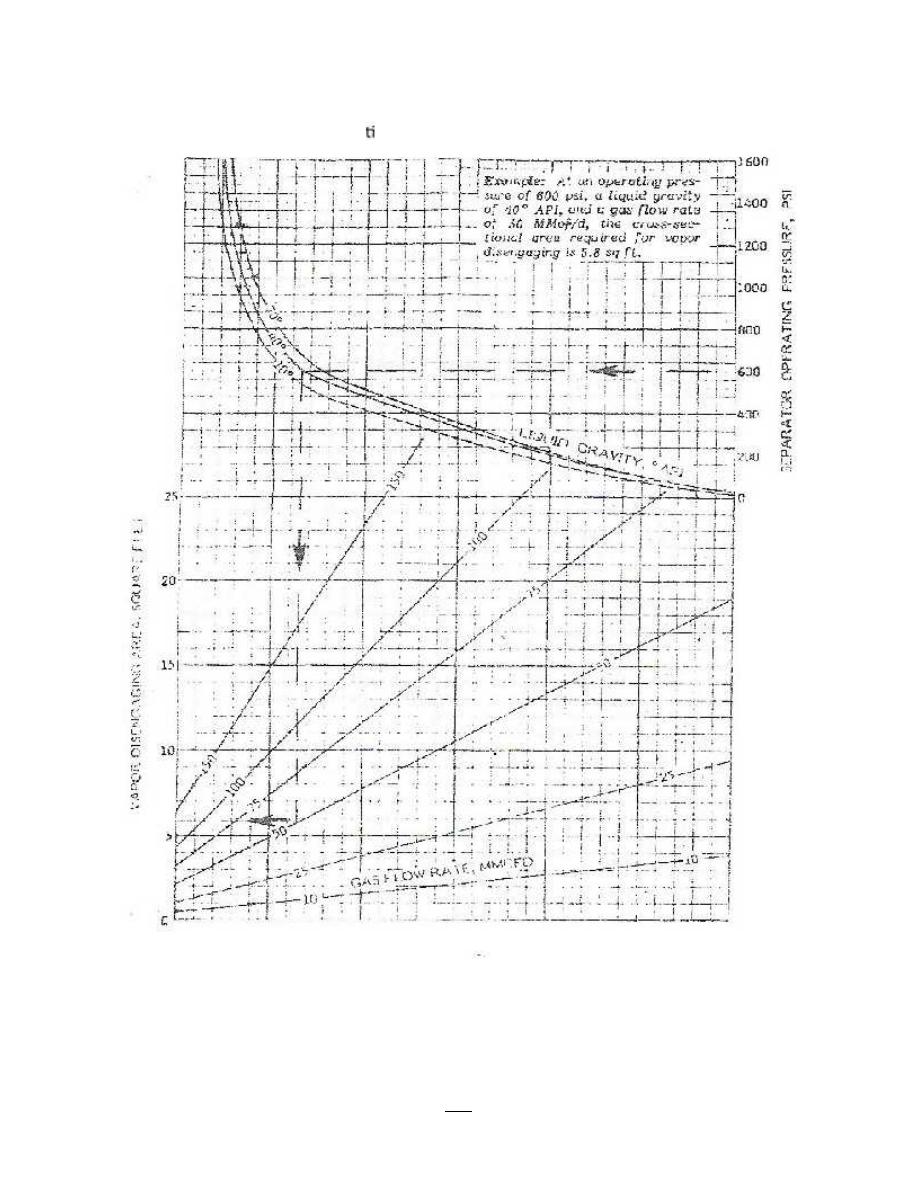
110
Production Engineering – I Herish N. Hamarash
Figure (4-8) Es mate gas capacity of horizontal separator.
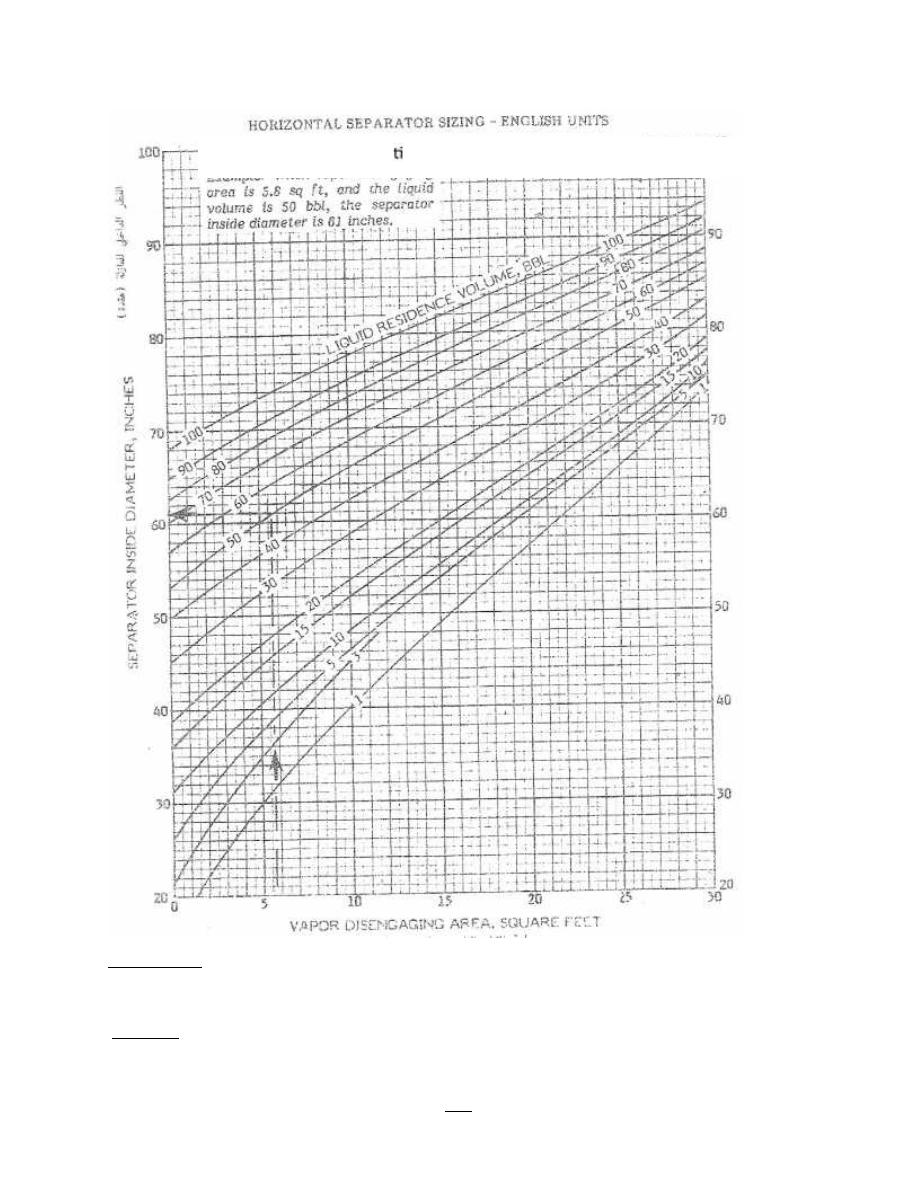
111
Production Engineering – I Herish N. Hamarash
Example (4):
Horizontal separator has q
g
= 50 MMcf/day, q
o
= 4320 bbl/day, p = 800 psi, API = 70
o
, and t =
1 minute. What is the separator design (i.e. L & d)?
Solution:
Use figure ( ) to determine A
g
, by p = 800 psi, API = 70
o
,
Figure (4-9) Es mate diameter of horizontal separator.

112
Production Engineering – I Herish N. Hamarash
q
g
= 50 MMcf/day.
A
g
= 5 ft²
Use figure ( ) to determine d, by A
g
= 5 ft², and V
o
= q
o
* t = (4320*1)/1440
V
o
= 3 bbl.
d = 35 in , and L = 4d = 4*35 = 140 ft.
Capacity of spherical separators
1- Gas capacity
Capacity of spherical separator depends on mist extractor capacity. Mist extractor
diameter calculates by the following empirical equation;
d
m
= 9.93 [Tz γ
g
/ p ρ
o
]
0.25
(q
gsc
/C)
0.5
…(23)
d
m
= mist extractor diameter, in
C = allow velocity constant (for screen slick mist extractor = 0.35)
q
gsc
= gas flow rate (gas capacity), MMscf/day
2- Oil capacity
In this case the volume (V
o
) of oil section equal to half total separator volume multiple to (√
d/2).
V
o
= (π/12) (√d/2) d³ ….(24)
Where the actual oil capacity equal;
q
o
= 1440V
o
/ 5.615t …(16)
substitute eq. (24) in (16)
q
o
= 67.14 (√d/2) [d³/t] …(25)
Also
q
or
= 33.57 (√d/2) [d³/t] …(26)

113
Production Engineering – I Herish N. Hamarash
Example (5):
Calculate the Gas & Oil capacity for spherical separator, use the following data: d = 30 in, γ
g
=
0.65, API = 45
o
, p = 100 psi,
T = 80
o
F, t = 1 minute. The gas behaves as ideal gas.
Solution:
1- Apply eq.(23) to determine gas capacity:
d
m
= 9.93 [Tz γ
g
/ p ρ
o
]
0.25
(q
gsc
/C)
0.5
…(23)
API = (141.5/γ
o
) – 131.5
Oil specific gravity, γ
o
= 0.8017
Oil specific gravity, γ
o
at T = 80
o
F equal:
γ
o(T)
= γ
o(60)
- γ
o(60)
* β
o
(T – 60), β0 = extension oil volume factor = 0.0005
γ
o(80)
= 0.8017 – 0.8017 * 0.0005 (80 – 60) = 0.7937
γ
o
= ρ
o
/ ρ
water
Oil density, ρ
o
= 62.4 * 0.0.7937 = 49.53 lb/ft³.
ρ
g
= p Mw
gas
/ zRT = p (Mw
air
γ
g
) / zRT = 100 (0.65*29) / 1*10.73*540
ρ
g
= 0.325 lb/ft³.
(30/2) = 9.93 [540*1*0.65/ 100*49.53]
0.25
(q
gsc
/0.35)
0.5
… (23)
q
gsc
= 3.00 MM Scf/day
2- Apply eq.(26) to determine oil capacity:
q
or
= 33.57 (√d/2) [d³/t] = 33.57 *(√30/12*2) * [(30/2)³/1]
q
or
= 586 bbl/day