ا ر
١
1
Descriptive Statistics
ﺑﺴﻢ ﺍﷲ ﺍﻟﺮﺣﻤﻦ ﺍﻟﺮﺣﻴﻢ
ﺑﺴﻢ ﺍﷲ ﺍﻟﺮﺣﻤﻦ ﺍﻟﺮﺣﻴﻢ
ﺑﺴﻢ ﺍﷲ ﺍﻟﺮﺣﻤﻦ ﺍﻟﺮﺣﻴﻢ
ﺑﺴﻢ ﺍﷲ ﺍﻟﺮﺣﻤﻦ ﺍﻟﺮﺣﻴﻢ
ا ر
٢
2
Objectives of the Lecture
At the end of the lecture student will be able to:
Classify the data according to sample size.
Identify the measures of central tendency for
raw data and its properties.
Identify the measures of variation for raw data
and its properties.
ا ر
٣
3
Descriptive Statistics :
Is divided in to
2
kinds of measurements:
1* Measures of Central Tendency:
Or- Measures of Location
Or- Measures of Averages
Or- Measures of Positions
Or- Measures of Magnitude
&
2* Measures of Variation
:
Or- Measures of Dispersion
Or- Measures of Scatter
Or- Measures of Variability
ا ر
٤
4
Data :
Where divided according to the size of sample
(n) into two kinds:
{{ Where:
n = sample size
or
no.of readings
or
no. of observations)
}}.
• Ungrouped Data
: when (
n < 30
)
Small Sample
or
Raw Data.
• Grouped Data
: when (
n
≥≥≥≥
30
)
large Sample
or
Frequency Distribution.
ا ر
٥
5
Raw Data: (n<30) small sample
(ungrouped data)
Measures of Central Tendency:
1.
End points
: Is the first & the last value of
the data after arranging the data in an
increasing order & noted by:
Ι
]
X
&
X
[
max
min
ا ر
٦
6
2.
Mean (arithmetic mean) or average :
It’s
symbol . Is the summation of X
i
divided by
the no. of observations where :
&
have a unit
Where:
n
x
x
x
n
x
n
n
i
i
x
+
+
+
=
∑
=
=
...
2
1
1
n
x
n
i
i
x
∑
=
=
1
x
ا ر
٧
7
3.
Median
: It’s symbol
. For ordered
observations in an increasing order, the
median is that measure (value)
which
divided the data into two parts 50% below it
& 50% above it.
a.
When n odd
&
have a unit
b.
when n even
&
have a unit
x
~
2
)
1
2
(
)
2
(
~
+
+
=
n
n
even
x
x
x
)
(
2
1
~
+
=
n
odd
x
x
ا ر
٨
8
4.
Mode
:
It’s symbol is
. Is the most
frequent value or measurement
or
the value
which appear more frequent than the other.
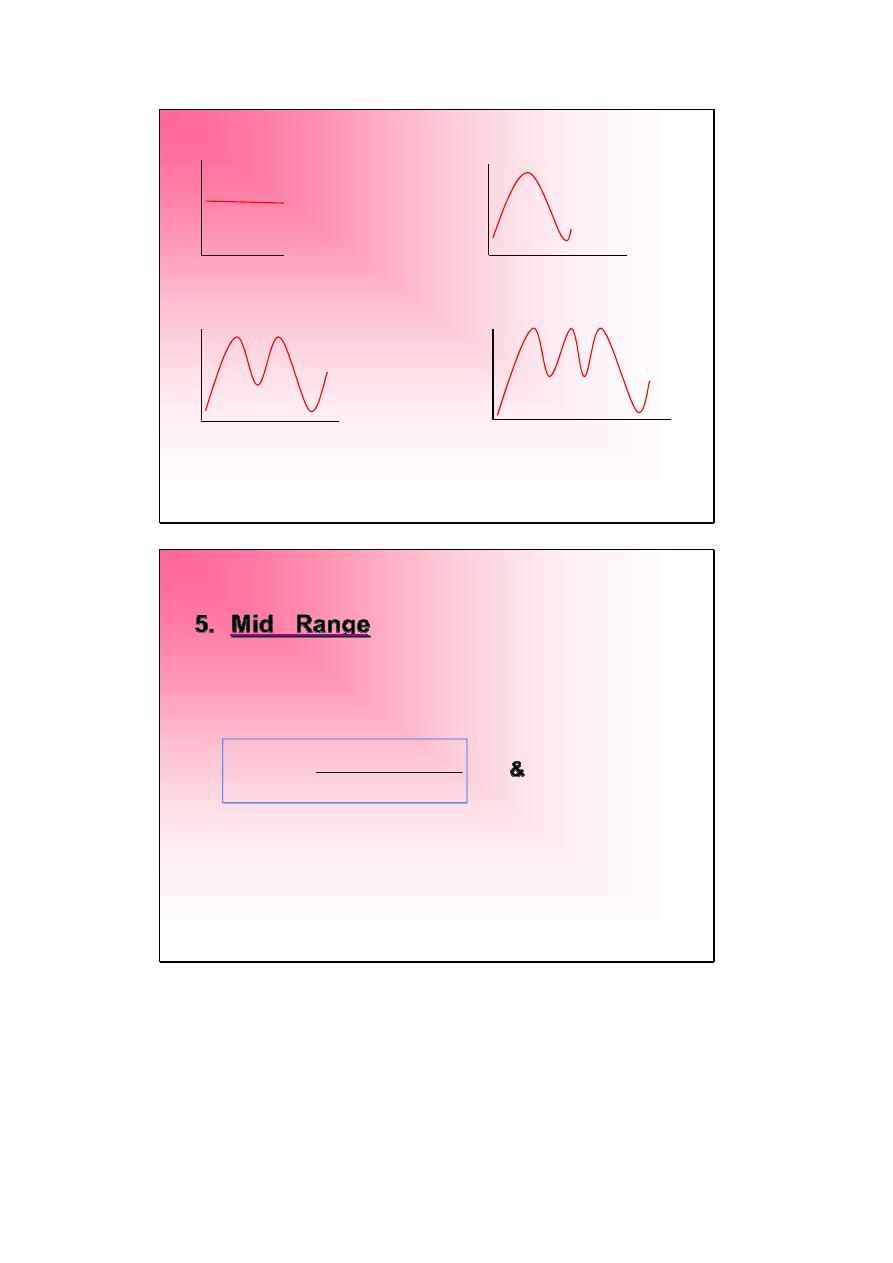
we have 4 conditions
a)
No-Mode
:When we don’t have
any
frequent
in the values.
b)
Uni-Mode
: When we have
1
value frequent
more than the other.
c)
Bi-Mode
: When we have
2
values frequent
more than the other.
d)
Multi-Mode
: When we have
3 or more
values
frequent more than the other.
m
x
ا ر
٩
9
No-Mode Uni-Mode
Bi-Mode Multi-Mode
ا ر
٠١
10
5.
Mid Range
:
It
is
the
average
of
the
minimum & the maximum values. It’s symbol
is
where :
&
have a unit
2
(max)
(min)
x
x
MR
+
=
MR
ا ر
١١
11
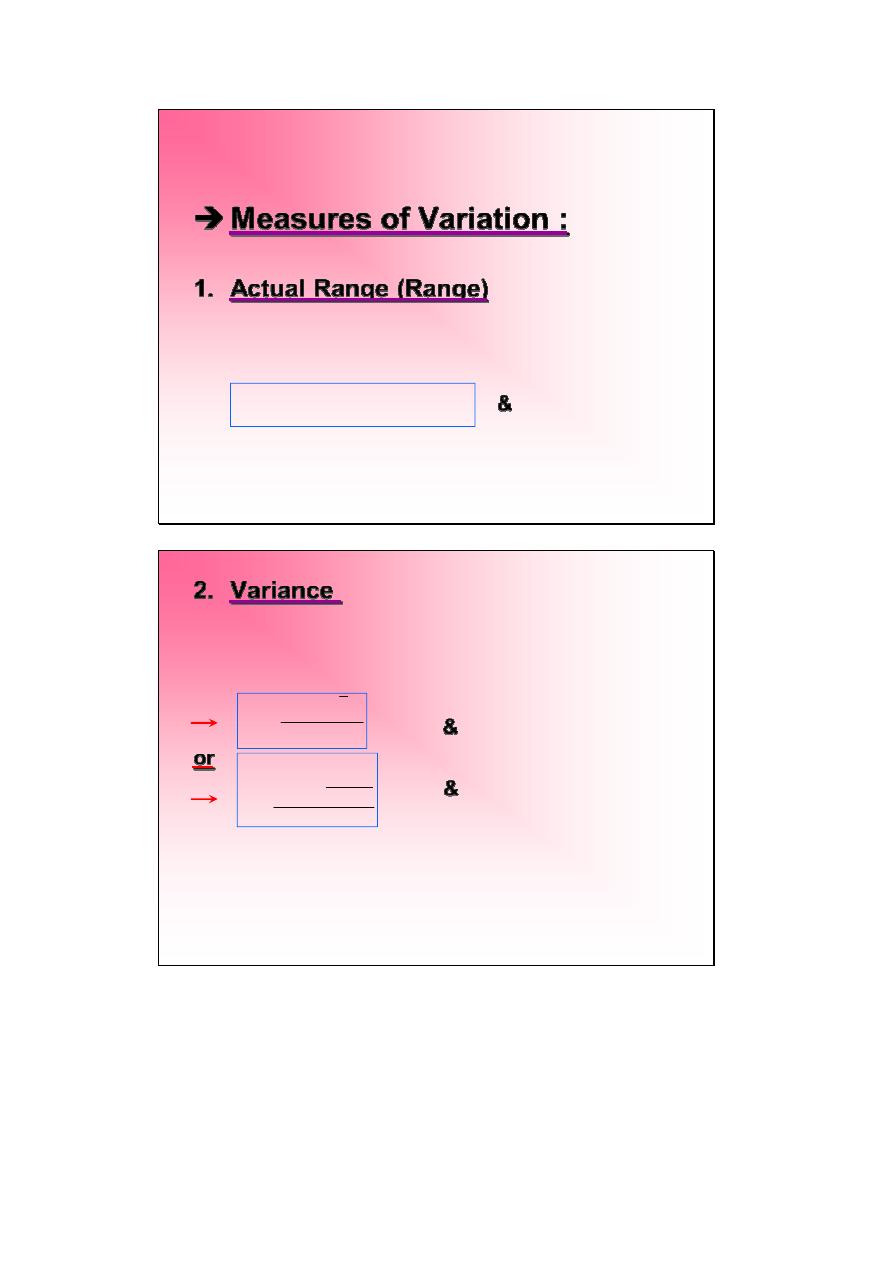
Measures of Variation :
1.
Actual Range (Range)
: It’s symbol is . Is
the difference between the maximum & the
minimum value where:
&
have a unit
(min)
(max)
X
X
R
−
=
R
ا ر
٢١
12
2.
Variance
: It’s symbol is S
2
is a measure
of variability which take into account the
difference
between
each
observation
& it’s sample mean where
:
&
have a square unit
or
&
have a square unit
The assist way a round this difficulty is to
use the square root of variance as a
measure
of
variability.
This
called
Standard Deviation
1
1
2
2
1
2
)
(
−
∑
−
=
∑
=
=
n
n
x
n
i
i
i
n
i
x
S
)
1
(
)
(
2
2
−
−
=
∑
n
x
x
i
S
ا ر
٣١
13
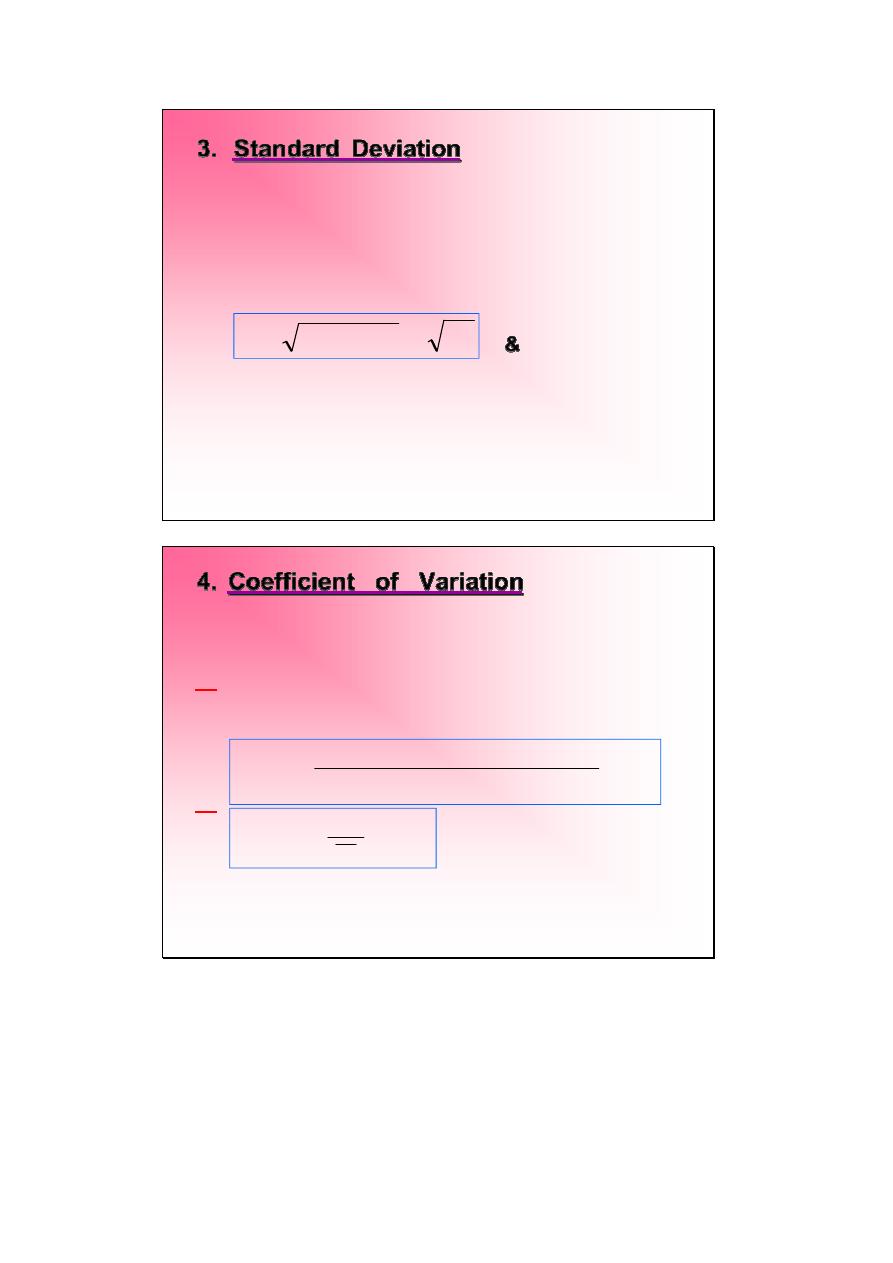
3.
Standard Deviation
: Denoted by S or
SD. Is a measure of variability which is
the square root of the variance . It give
the
real
difference
between
each
observation & it’s mean where:
&
have a unit
2
S
Variance
S
=
=
ا ر
٤١
14
4.
Coefficient of Variation
:
Denoted
by
C.V%. Is a single index which measure the
variation magnitude of standard deviation in
comparison to mean .
or
Is a measure of one of the measures of
variation divided by one of the measures of
the central tendency where:
or
%
unit less
C.V% used to compare data of different
measurements unit.
100
.
tendency
central
of
measure
variation
of
measure
%
V
C.
=
100
.
X
SD
%
V
C.
=