Medical Statistic
What is a statisticA statistic is a field of study concerned with methods of Collectionتجميع ,Organizationتنظيم, Summarizingتلخيص ,
It makes presentation عرض, Classificationوصف, and analyzing تحليل the data. This analysis may lead to conclusions نتائجand decision قرارات .
A statistician(الاحصائي) is someone who is versed متمكنin the successful ways application of statistical analysis.
Medical Statistics
deals with applications of statistics to medicine and the health sciences, includingepidemiology(علم الاوبئة),
public health(الصحة العامة),
forensic medicine(الطب العدلي),
clinical research(البحوث السريرية) .
Types of Statistics Science: statistic may be: (i) Descriptive ; (ii) Inferential
When we first collect data for some project, it will usually be in a ‘rawخام ’ form . That is, not organized غير منظمهin any way, making it difficult to see what’s going on. Descriptive statistics is a series of procedures designed to illuminateالقاء الضوء the data, This may mean sorting the data by size; perhaps putting it into a table, maybe presenting it in an appropriate chart, or summarizing it numerically; and so on.An important consideration in this process is the type of variable concerned. The data from some variables are best described with a table, some with a chart, some, perhaps, with both. Other variables, a numeric summary is more appropriate.
When we want to discoverاكتشاف things that interest us about a population, we take a sample. We then hope to generalize our sample findings, Statisticians call this process, of generalizing from a sample to a population, statistical inference .
It is include two main parts:
Estimation التقدير
Test of Hypothesis اختبار الفرضيات
Population & Sample
Population: This is a much larger group that containing all the values & observations about which we wish to make inference.Sample: This is a part of population generally selected so as to be representative of the population in the variable(s) under study.
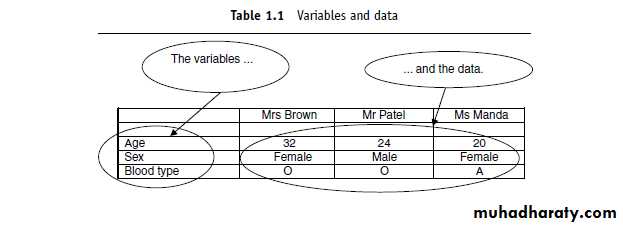
Variables and data
A variable is something whose value can vary. For example, age, sex and blood type are variables.Data are the values you get when you measure a variable. For example, 32 years(for the variable age), or female (for the variable sex).
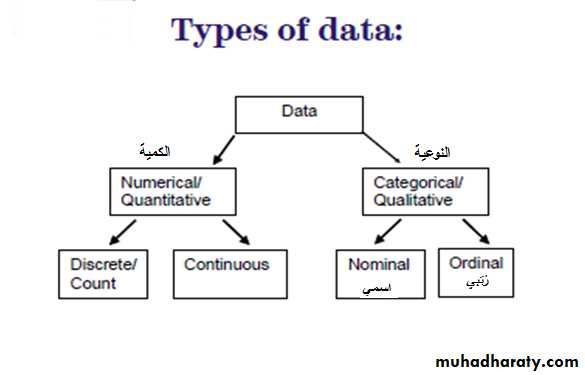
Types of Data
Categorical (Qualitative)Nominal (no natural ordering)
Blood groups: A,B,O,AB, Sex :m/f
Ordered categorical (ordinal)
Pain severity - mild, moderate, severe
Grade of breast cancer, Social Class: I to V
Numerical (Quantitative)
Discrete
Number of children in a family, Number of attacks of asthma نوبات الربوper week
Continuous
Age (in years, days, hours, seconds….)
Height in cm , Weight in kg
ء
Statistical Notations
The information in statistic may be a number of variables (say X, Y, Z…etc.) and each variable is a number observation (say Xi, Yi, Zi… etc.), then:Rules of the Summation:
∑c = n.c (c is a constant)
∑(c yi) = c ∑yi
∑(xi±yi) = ∑xi±∑yi
∑ (xi± c) = ∑xi±n.c
∑(xi)2 ≠(∑xi)2
∑(xi / yi) ≠∑xi / ∑yi
∑(xiyi) ≠∑xi ∑yi
Example:
Calculate 1to 7 above if:
C=6 , Xi: 3, 5, 1 , Yi: 4, 2, 10
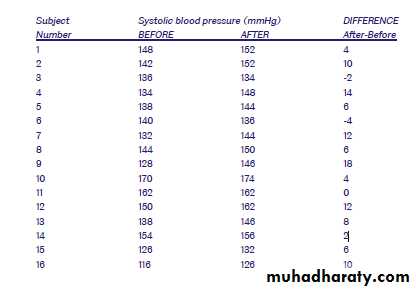
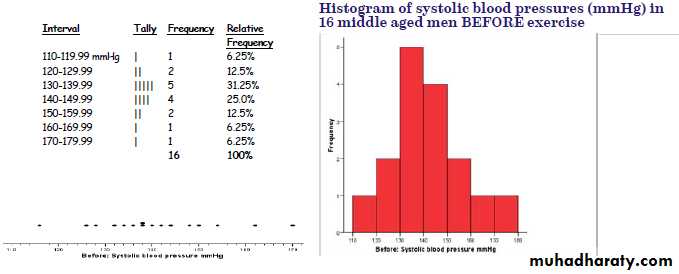
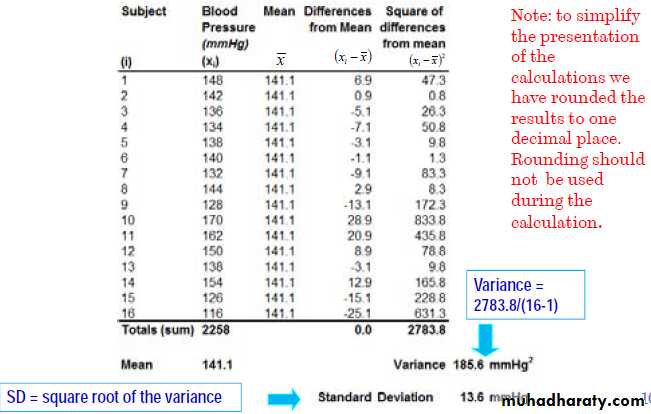
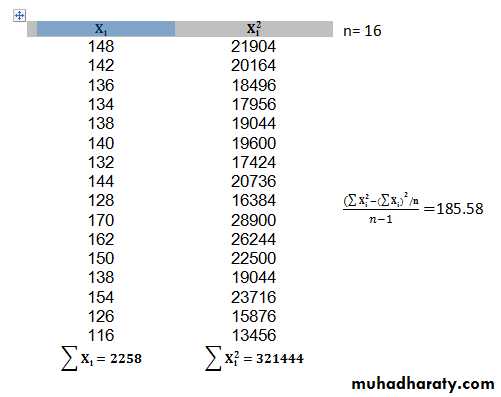
Table(1): Systolic blood pressure levels in 16 middleaged men before and after a standard exercise
Displaying and Summarizing DataDisplay Numerical Data Dot plot Stem & leaf plot Histogram Box & whisker plotFor our example Systolic blood pressure-Before-
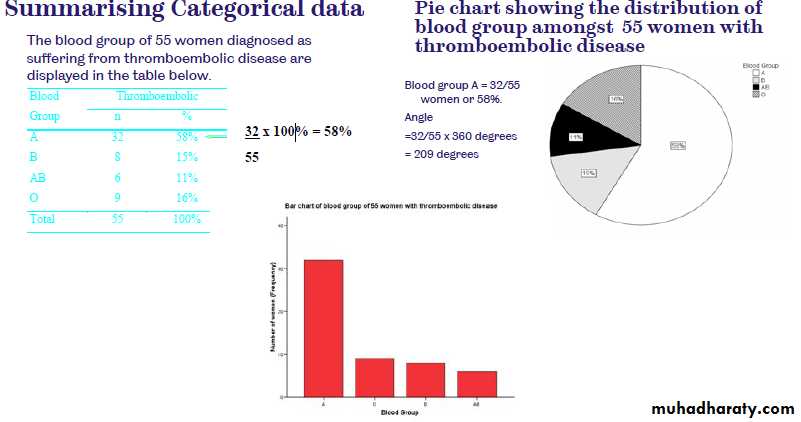
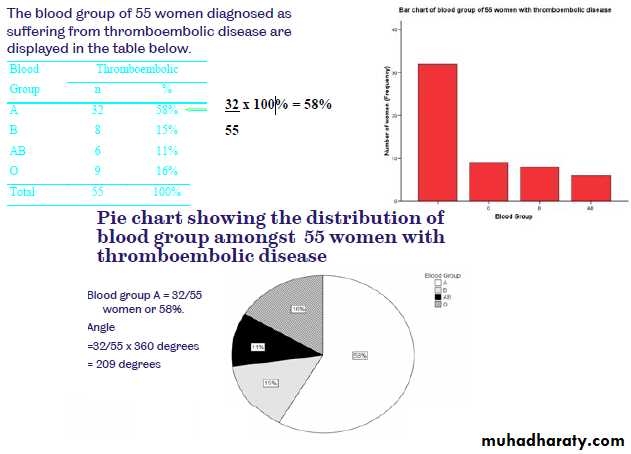
Displaying and Summarizing DataDisplay Categorical Data Bar Chart Pie
measures of location
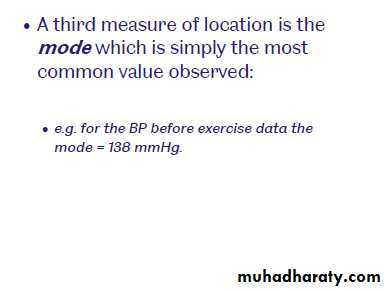
A summary measure of location is a value around which most of the data values tend to congregate or center. The most famous three measures of location we are discussed are : the mode; the median ; and the mean. The choice of appropriate measure to be used; depends on the type of dataThe mode
The mode is that value in the data that has the highest frequency (i.e. occurs the most often).The mode is not useful with metric continuous data where no two values may be the same. The other shortcoming of this measure is that there may be more than one mode in a set of data.The median
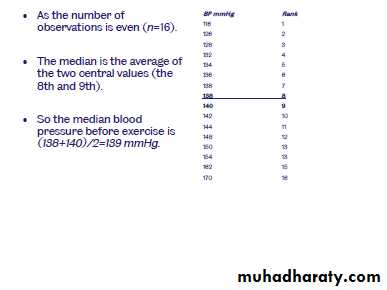
If we arrange the data in ascending order of size, the median is the middle value. Thus, half of the values will be equal to or less than the median value, and half equal to or above it.
The median is thus a measure of central-ness. As an example of the calculation of the median, suppose you had the following data on age (in ascending order of years), for five individuals:30 ,31, 32, 33, 35. The middle value is 32, so the median age for these five people is 32 years. If you have an even number of values, the median is the average of the two values either side of the ‘middle’. If you have n values arranged in ascending order, then : the median = 1/2(n + 1)th value.
An advantage of the median is that it is not much affected by skewness in the distribution, or by the presence of outliers. However, it discards a lot of information, because it ignores most of the values, apart from those in the center of the distribution.
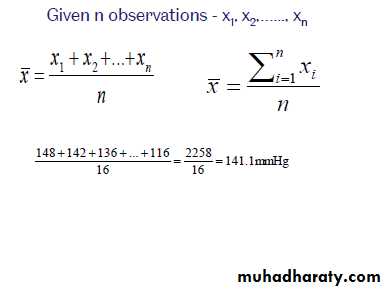
The mean
The mean, or the arithmetic mean (the average) . One advantage of the mean over the median is that it uses all of the information in the data set. However, it is affected by skewness in the distribution, In other hand, it cannot be used with ordinal data (recall that ordinal data are not real numbers, so they cannot be added or divided).
measures of location
Pros and cons of mean/median/mode
Median robust to outliers.Median/mode reflects what ‘most’ people experience.
Mean uses all the data (more ‘efficient’).
Mean is ‘expected’ value.
Mean more common with statistical tests.
Mode useful for grouped or categorical data
A guide to choosing an appropriate measure of location
mean
median
mode
Type of variable
No
No
yes
Qualitative - Nominal
No
yes
yes
Qualitative - Ordinal
yes
Yes
yes
Quantitative - Discrete
yes
• Yes
• with Reservedly
No
Quantitative - Continuous
measures of spread
The dispersion is the difference of each values in the observations from the arithmetic mean. If all values are the same then there is no dispersion, and the dispersion could be small (ex. Sample of male & female with weights between 69 – 79), or large (ex. weights between 90 – 120).
There are two types of dispersion measures
Absolute Variation Measures:
Range. Variance. Standard Deviation . Standard Error of the Mean.
Relative Variation Measure: Coefficient of Variation.
The Range :
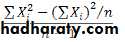
The Variance : ,The Standard Deviation:
The Standard Error of the Mean:
The SD measures the variability of each observation from the mean of the sample , The SE give idea from How much the sample mean is far away from the population mean
The Coefficient of Variation (CV):
The CV is used to compare the dispersion in two sets of data even when the units are different.
Choosing an appropriate measure of spread
measure
Type ofType of variable
Variance & Stander Deviation
Range
No
No
Qualitative - Nominal
No
Yes
Qualitative - Ordinal
Yes
yes
Quantitative - Discrete
New from table(1) Systolic blood pressure-Before-
Or by using a second formula
Since V= 185.58 , SD= 13.6 , SE= 3.4Systolic blood pressure-After- : Homework
Interpretation of results
If you have and Y= X + a , Z = aX-b , then estimate:Inference statistical
As you remember :Population :All individual s in which we are interested in.
Sample :Group of individuals drawn from our population of interest which we study in order to learn about the population
Sample statistics and population parameters
The main aim of statistical analysis is to use the information gained from a sample of individuals to make inferences about the population of interest.
There are two basic approaches to statistical analysis:
Hypothesis testing & Estimation.
Sample Statistic
Population Parameterµ
Mean
S
σ
SD
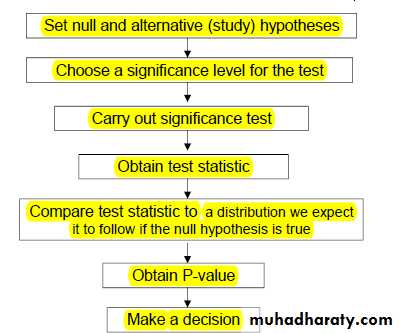
Main Steps Of Hypothesis Testing:
1. State your null hypothesis (H0) & (H1), (H0) : (Statement you are looking for evidence to disprove).2. Choose a significance level, α, for the test.
3. Chose a suitable test and calculate statistic.
4. Compare between tabulated and calculated statistic o make a decision about whether to reject, or not reject, your null hypothesis.
Hypothesis Testing Procedures
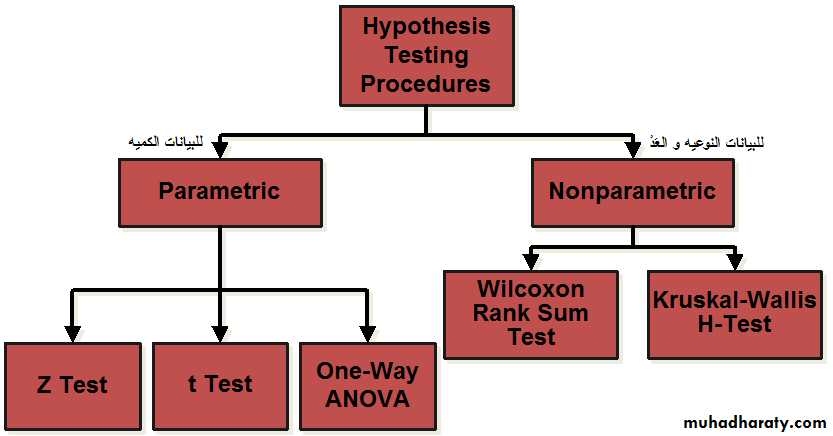
Parametric Test
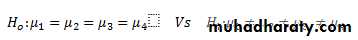
3- The ANOVA Model : Test of hypothesis about differences among three or more population means
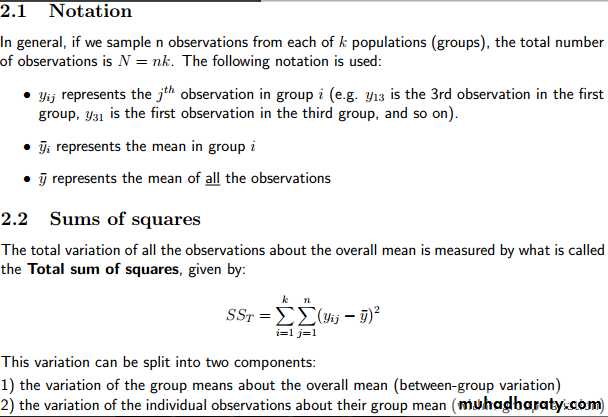
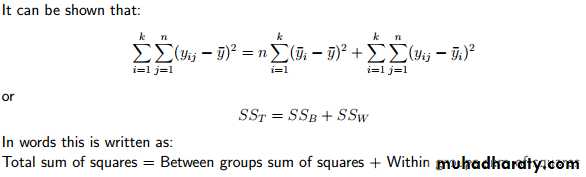
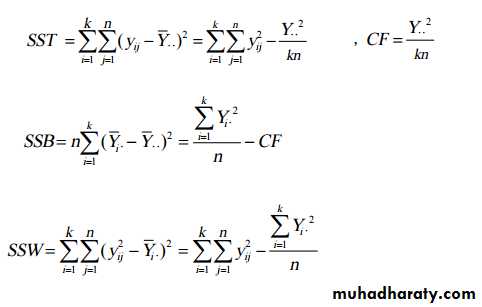
Source of variance in easily formula
ANOVA Table
Tabulated FCalculated F
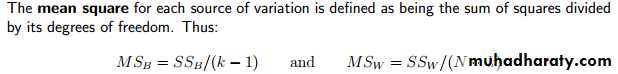
Mean Squares (M.S.)
Sum of Squares (S.S.)
Degree of Freedom (d.f.)
Source of Variation (S.O.V)
Fα((t-1),(N-t))
MST/MSE
MST
SSk
k-1
Between Treatments
MSE
SSe
N-k
Within Treatments
SST
N-1
Total

Examples
Q1- Return to Systolic blood pressure levels data, (use tab.t(0.05,15)=2.131) Test if the mean of Systolic blood pressure levels is 148(mmHg)in Before data.
2)Test if their is a significant different between Before exercise & After exercise
Solution
1) H0 :µ=148 Vs H1 :µ≠148
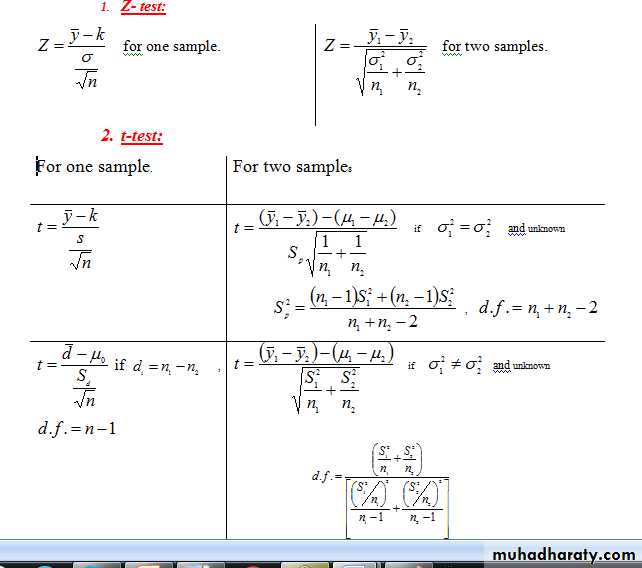
Since we have one sample with n< 30, we used t-test which
• there is a significant different in Before data
• 2) H0 :µA -µB=0 µd = 0 Vs H1 : µA -µB≠0 µd ≠ 0
• 2) Since we have paired observation Before exercise & After exercise ,we used t-test which
• there is a significant different

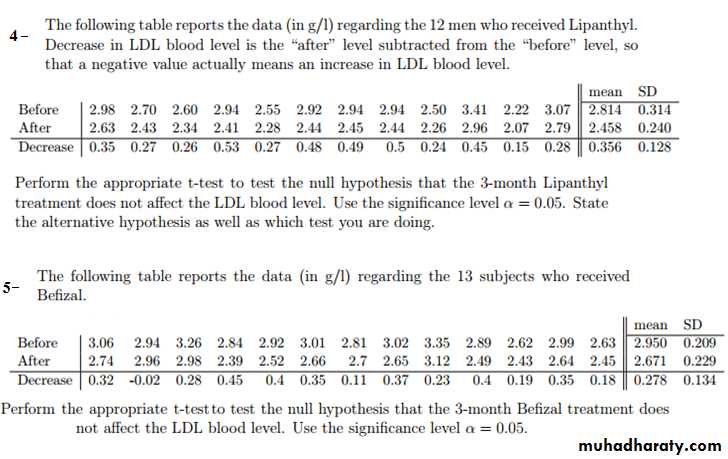
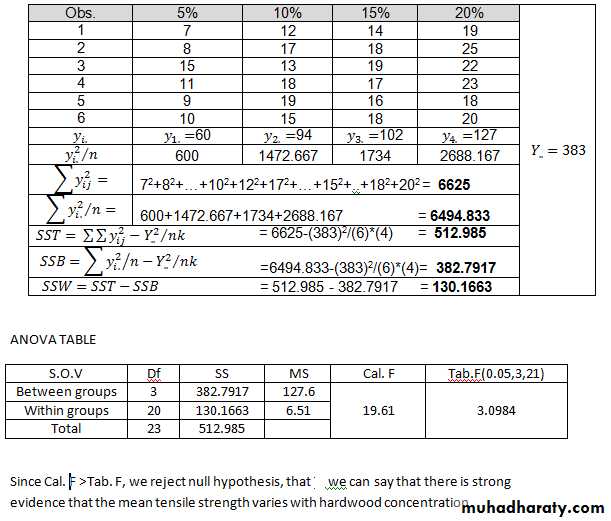
2- A paper manufacturer makes grocery bags. They are interested in increasing the tensile strength of their product. It is thought that strength is a function of the hardwood concentration in the pulp. An investigation is carried out to compare four levels of hardwood concentration: 5%, 10%, 15% and 20%. Six test specimens are made at each level and all 24 specimens are then tested in random order. The results are shown below
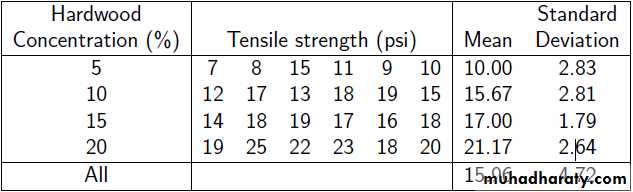
.
Exercises
1- A study reported the mean birth weight of 98 infants who were born prematurely as 1.31 kg with σ = 0.42 kg, test if the mean of birth weights population = 1.5 ,(use 1.96 as a tabulated value)2- An outbreak of Salmonella-related illness was attributed to ice cream produced at a certain factory. Scientists measured the level of Salmonella in 9 randomly sampled batches of ice cream. The levels (in MPN/g) were: 0.593, 0.142, 0.329, 0.691, 0.231, 0.793, 0.519, 0.392, 0.418 . Is there evidence that the mean level of Salmonella in the ice cream is greater than 0.3 MPN/g? ,(use 2.306 as a tabulated value)
3- 6 subjects were given a drug (treatment group) and an additional 6 subjects a placebo (control group). Their reaction time to a stimulus was measured (in ms). We want to perform a two-sample t-test for comparing the means of the treatment and control groups. Control Group:(91, 87, 99, 77, 88, 91) , Treat. Group:(101, 110, 103, 93, 99, 104), ,(use 2.228 as a tabulated value)
Exercises