
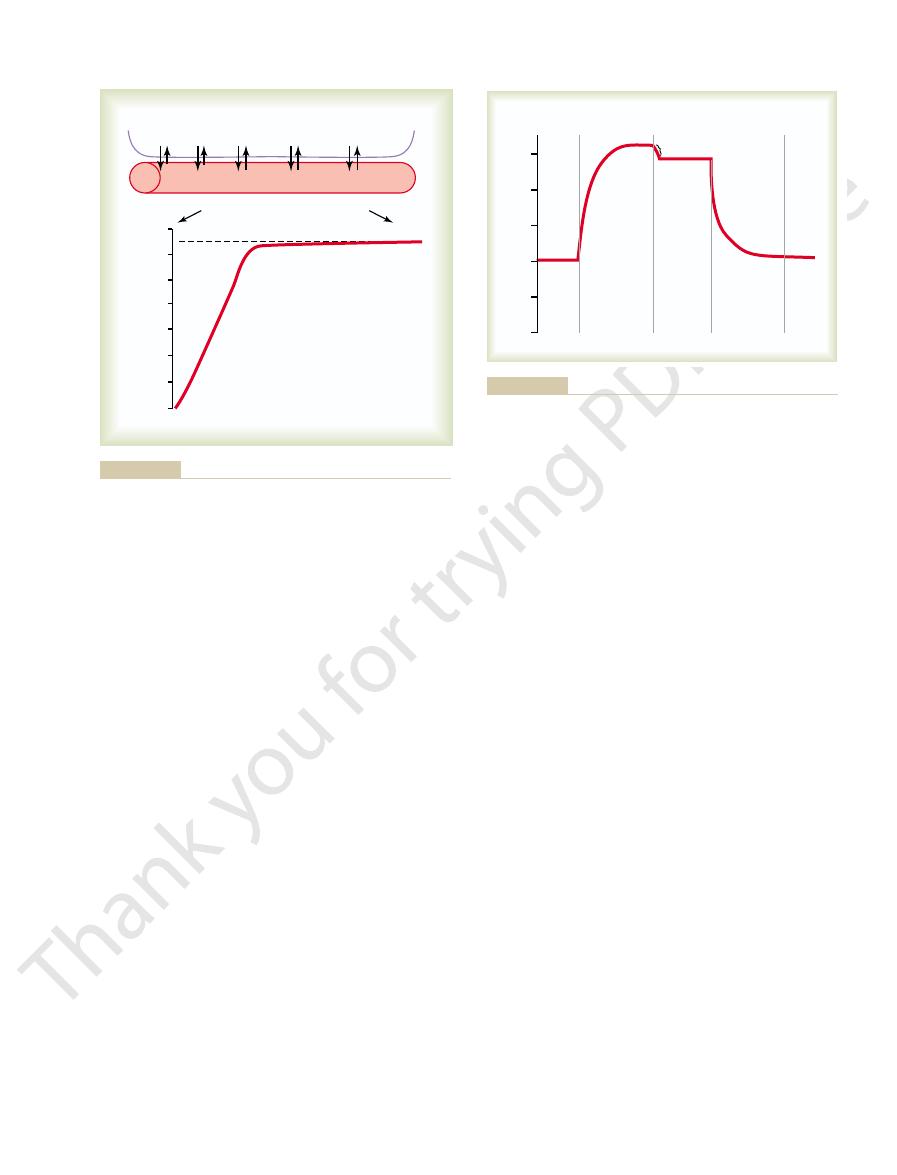
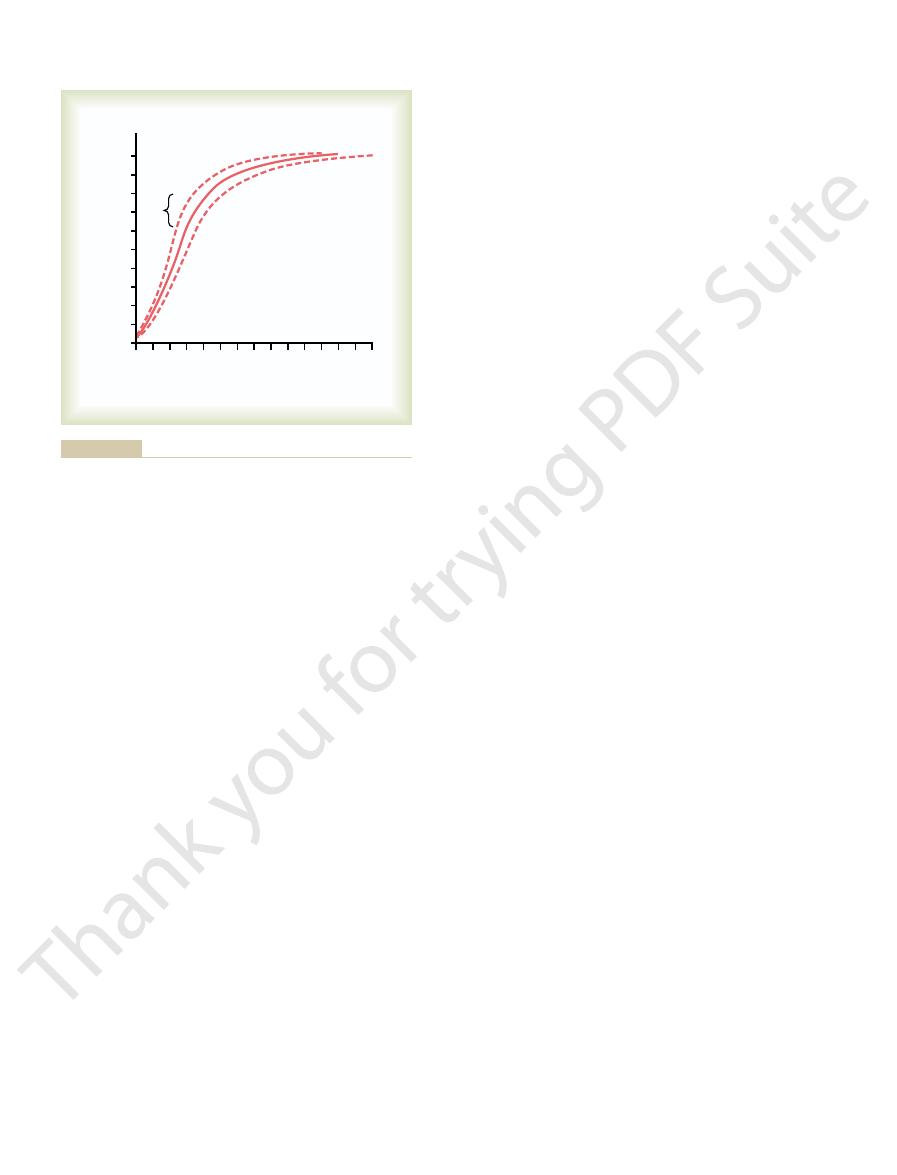
diffuse into the pulmonary capillary is 104 – 40, or 64 mm Hg. In the graph at
eral tissues. Therefore, the
pulmonary capillary at its arterial end averages only 40 mm Hg because a large
alveolus averages 104 mm Hg, whereas the P
alveolar air and the pulmonary blood. The P
monary capillary, demonstrating diffusion of oxygen molecules between the
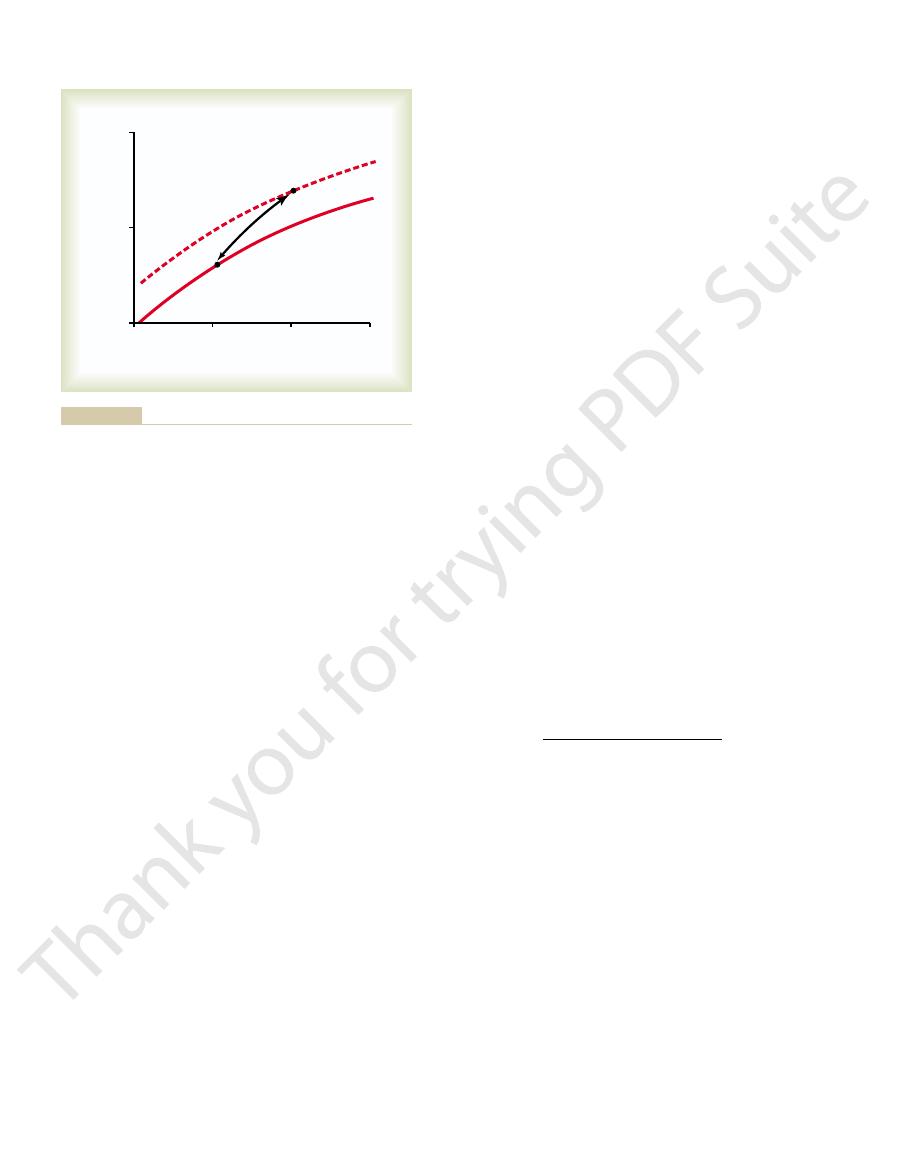
The top part of Figure 40–1 shows a pulmonary alveolus adjacent to a pul-
Diffusion of Oxygen from the Alveoli to the Pulmonary
responsible for these effects.
diffusion and the flow of blood. We now consider quantitatively the factors
Thus, the transport of oxygen and carbon dioxide by the blood depends on both
the lungs, the carbon dioxide diffuses out of the blood into the alveoli, because
causes carbon dioxide to diffuse into the tissue capillaries. After blood flows to
) rises to a high value, which
Conversely, when oxygen is metabolized in the cells to form carbon dioxide,
causes oxygen to diffuse into the surrounding cells.
other tissues of the body, a higher P
in the pulmonary capillary blood. In the
difference from the first point to the next. Thus, oxygen diffuses from the alveoli
In Chapter 39, we pointed out that gases can move from one point to another
Transport of Oxygen from the Lungs to the
the blood and tissue fluids.
The purpose of this chapter is to present both qualitatively and quantitatively
and is transported back to the lungs. Carbon dioxide, like oxygen, also combines
This carbon dioxide enters the tissue capillaries
carbon dioxide.
In the body’s tissue cells, oxygen reacts with various foodstuffs to form large
bination with hemoglobin. The presence of hemo-
the pulmonary blood, it is transported to the
oxygen
Dioxide in Blood and Tissue Fluids
Transport of Oxygen and Carbon
C
H
A
P
T
E
R
4
0
502
Once
has diffused from the alveoli into
peripheral tissue capillaries almost entirely in com-
globin in the red blood cells allows the blood to
transport 30 to 100 times as much oxygen as could
be transported in the form of dissolved oxygen in
the water of the blood.
quantities of
with chemical substances in the blood that increase carbon dioxide transport
15- to 20-fold.
the physical and chemical principles of oxygen and carbon dioxide transport in
Body Tissues
by diffusion and that the cause of this movement is always a partial pressure
into the pulmonary capillary blood because the oxygen partial pressure (Po
2
)
in the alveoli is greater than the Po
2
o
2
in the capillary blood than in the tissues
the intracellular carbon dioxide pressure (Pco
2
the Pco
2
in the pulmonary capillary blood is greater than that in the alveoli.
Capillary Blood
o
2
of the gaseous oxygen in the
o
2
of the venous blood entering the
amount of oxygen was removed from this blood as it passed through the periph-
initial pressure difference that causes oxygen to
rounds the tissue cells averages only 40 mm Hg. Thus,
in Figure 40–3, the P
in the capillaries is still 95 mm Hg. Yet, as shown
When the arterial blood reaches the peripheral tissues,
Tissue Fluid
Diffusion of Oxygen from the
Figure 40–2.
fall to about 95 mm Hg. These changes in blood P
blood from the alveolar capillaries, this so-called
venous blood, about 40 mm Hg. When this blood
the gas exchange areas. On leaving the lungs, the P
called “shunt flow,” meaning that blood is shunted past
lungs and is not exposed to lung air. This blood flow is
culation, which supplies mainly the deep tissues of the
of about 104 mm Hg. Another 2 per cent of the blood
Transport of Oxygen in the
become fully oxygenated, or nearly so.
of exposure in the capillaries, the blood can still
Therefore, during exercise, even with a shortened time
the latter two thirds of its transit. That is, the blood
through one third of the pulmonary capillary, and little
nonexercising conditions, the blood becomes almost
Second, note in the curve of Figure 40–1 that under
sion ratio in the upper part of the lungs.
during exercise; this results mainly from increased
First, it was pointed out in Chapter 39 that the dif-
This can be explained as follows.
oxygen by the time it leaves the pulmonary capillaries.
brane, the blood still becomes
half normal. Yet, because of the great
during exercise, the time that the blood remains in the
oxygen. Also, because of increased cardiac output
During strenuous exercise, a person’s body may
Uptake of Oxygen by the Pulmonary Blood During Exercise.
through the capillary, becoming almost 104 mm Hg.
the bottom of the figure, the curve shows the rapid rise
Transport of Oxygen and Carbon Dioxide in Blood and Tissue Fluids
Chapter 40
503
in blood Po
2
as the blood passes through the capillary;
the blood Po
2
rises almost to that of the alveolar air by
the time the blood has moved a third of the distance
require as much as 20 times the normal amount of
pulmonary capillary may be reduced to less than one
safety factor for
diffusion of oxygen through the pulmonary mem-
almost saturated with
fusing capacity for oxygen increases almost threefold
surface area of capillaries participating in the diffusion
and also from a more nearly ideal ventilation-perfu-
saturated with oxygen by the time it has passed
additional oxygen normally enters the blood during
normally stays in the lung capillaries about three
times as long as necessary to cause full oxygenation.
Arterial Blood
About 98 per cent of the blood that enters the left
atrium from the lungs has just passed through the alve-
olar capillaries and has become oxygenated up to a Po
2
has passed from the aorta through the bronchial cir-
o
2
of the shunt blood is about that of normal systemic
combines in the pulmonary veins with the oxygenated
venous admixture of blood causes the Po
2
of the blood
entering the left heart and pumped into the aorta to
o
2
at
different points in the circulatory system are shown in
Peripheral Capillaries into the
its Po
2
o
2
in the interstitial fluid that sur-
there is a tremendous initial pressure difference that
causes oxygen to diffuse rapidly from the capillary
Arterial End
Venous End
Alveolus P
O2
= 104 mm Hg
P
O2
= 40 mm Hg
Blood P
O
2
(mm Hg)
Blood P
O
2
P
O2
= 104 mm Hg
Pulmonary Capillary
Alveolar oxygen partial pressure
110
100
90
80
70
60
50
40
venous admixture. Biophys J 8:337, 1968.)
Jr: A theoretical study of pulmonary capillary gas exchange and
this figure was constructed from data in Milhorn HT Jr, Pulley PE
Uptake of oxygen by the pulmonary capillary blood. (The curve in
Figure 40–1
100
80
60
40
20
0
Systemic
venous
blood
Systemic
arterial
blood
Systemic
capillaries
Systemic
venous
blood
Mixed with
pulmonary
shunt blood
P
O
2
Pulmonary
capillaries
of “venous admixture.”
rial blood, and systemic capillary blood, demonstrating the effect
in the pulmonary capillary blood, systemic arte-
Figure 40–2
Changes in P
O
2
the alveolar air, 40 mm Hg. Thus, only a 5 mm Hg
capillaries at the arterial end, 45 mm Hg; P
3. P
45 mm Hg.
tissues, 45 mm Hg. Thus, as shown in Figure 40–5,
40 mm Hg; P
of the arterial blood entering the tissues,
2. P
differential, as shown in Figure 40–5.
45 mm Hg. Thus, there is only a 1 mm Hg pressure
, 46 mm Hg; interstitial P
1. Intracellular P
oxygen diffusion. The CO
cause carbon dioxide diffusion are, in each instance, far
Therefore, the pressure differences required to
oxygen.
carbon dioxide can diffuse about 20 times as rapidly as
diffusion of oxygen. Yet there is one major difference
Thus, at each point in the gas transport chain, carbon
In the lungs, it diffuses from the pulmonary capillaries
capillaries and is then carried by the blood to the lungs.
; because of this high tissue cell P
becomes carbon dioxide, and this increases the intra-
When oxygen is used by the cells, virtually all of it
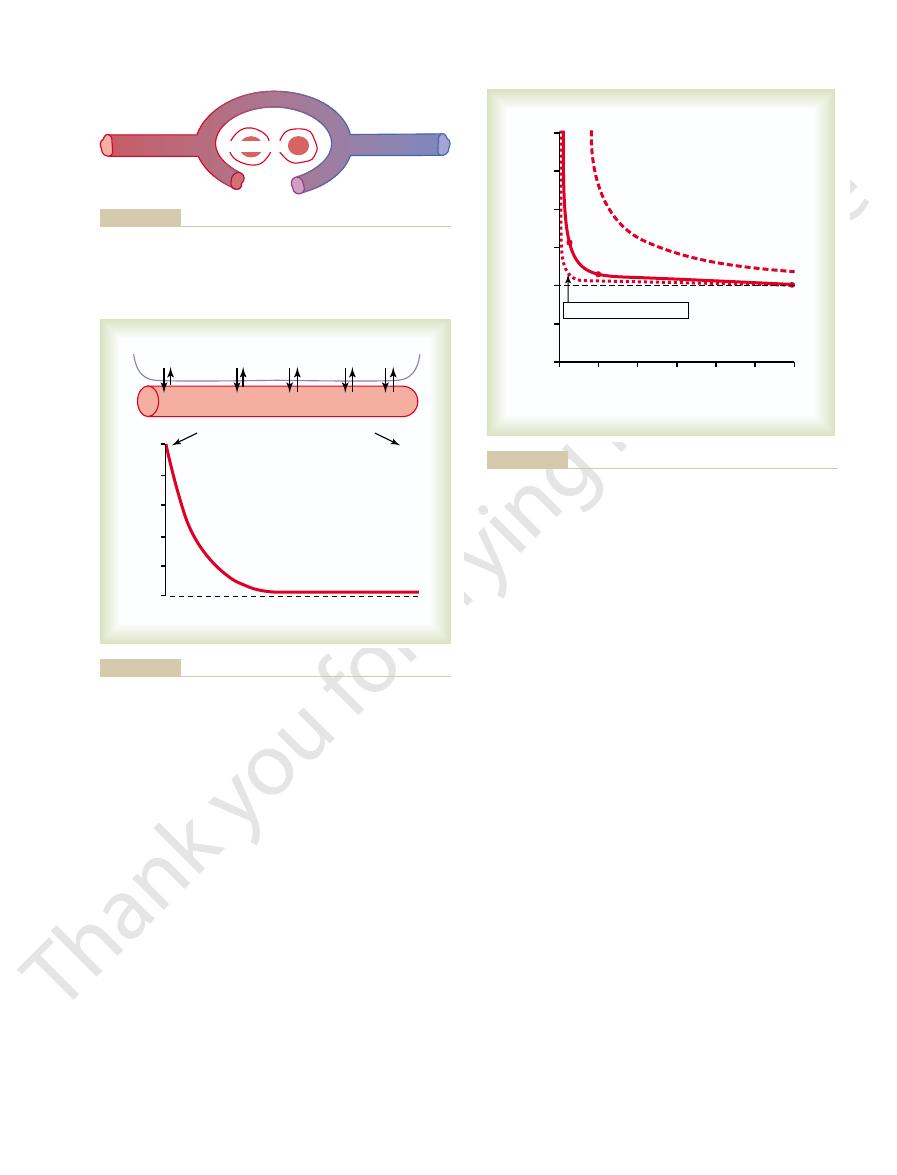
Capillaries into the Alveoli
Capillaries and from the Pulmonary
the Peripheral Tissue Cells into the
Diffusion of Carbon Dioxide from
than adequate and provides a large safety factor.
of 23 mm Hg is more
processes that use oxygen in the cell, one can see that
Because only 1 to 3 mm Hg of oxygen pressure is
(by direct measurement in lower animals) 23 mm Hg.
as low as 5 mm Hg to as high as 40 mm Hg, averaging
Therefore, the normal intracellular P
ical distance between the capillaries and the cells.
ies. Also, in many instances, there is considerable phys-
Oxygen is always being used by the cells. Therefore,
Tissue Cells
Peripheral Capillaries to the
Diffusion of Oxygen from the
by the tissues.
In summary, tissue P
increased, and increased P
also demonstrates this effect, showing reduced intersti-
. Figure 40–4
mally, this reduces the interstitial fluid P
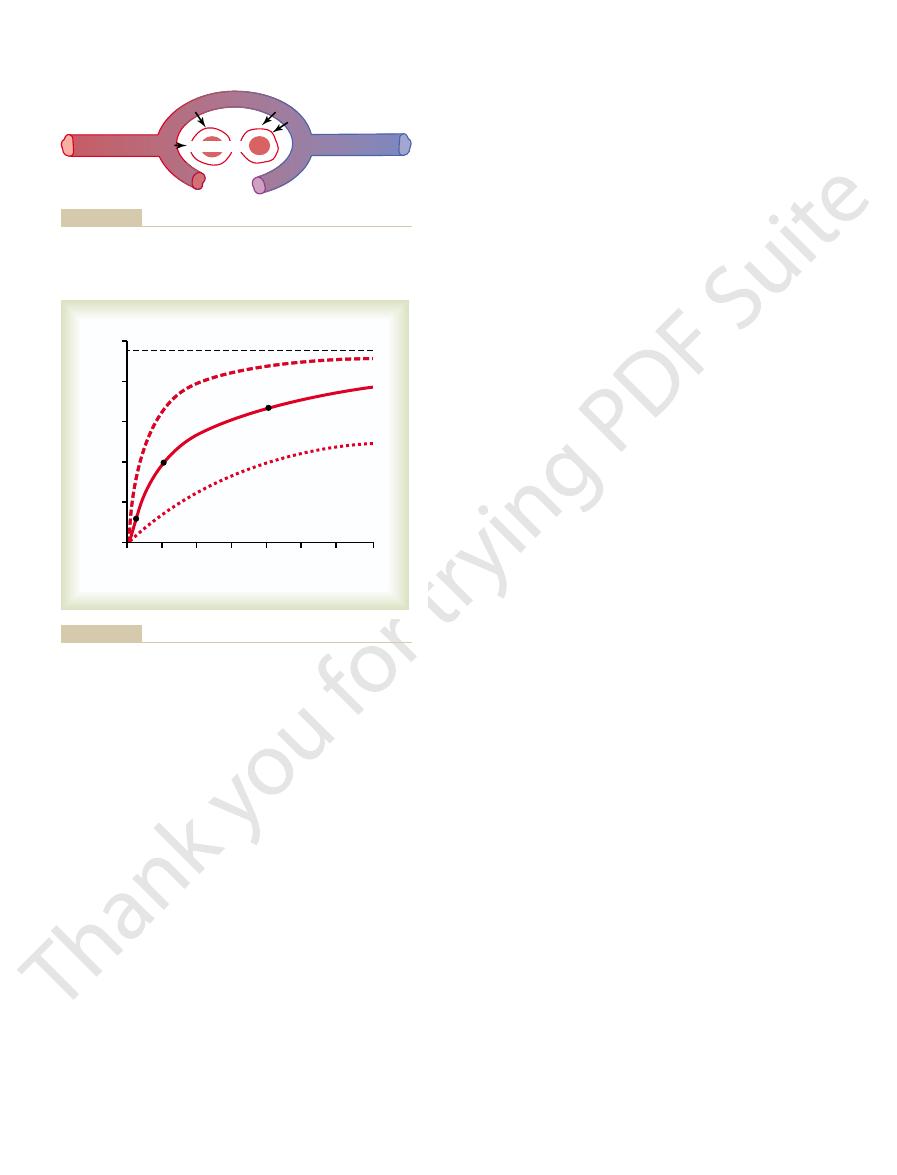
Effect of Rate of Tissue Metabolism on Interstitial Fluid P
at point C.
also decreases, as shown
tissue decreases, the tissue P
arterial blood. Conversely, if blood flow through the
95 mm Hg, because this is the oxygen pressure in the
can rise, even with maximal blood flow, is
66 mm Hg (at point B). However, the upper limit to
from 40 mm Hg (at point A in the figure) to
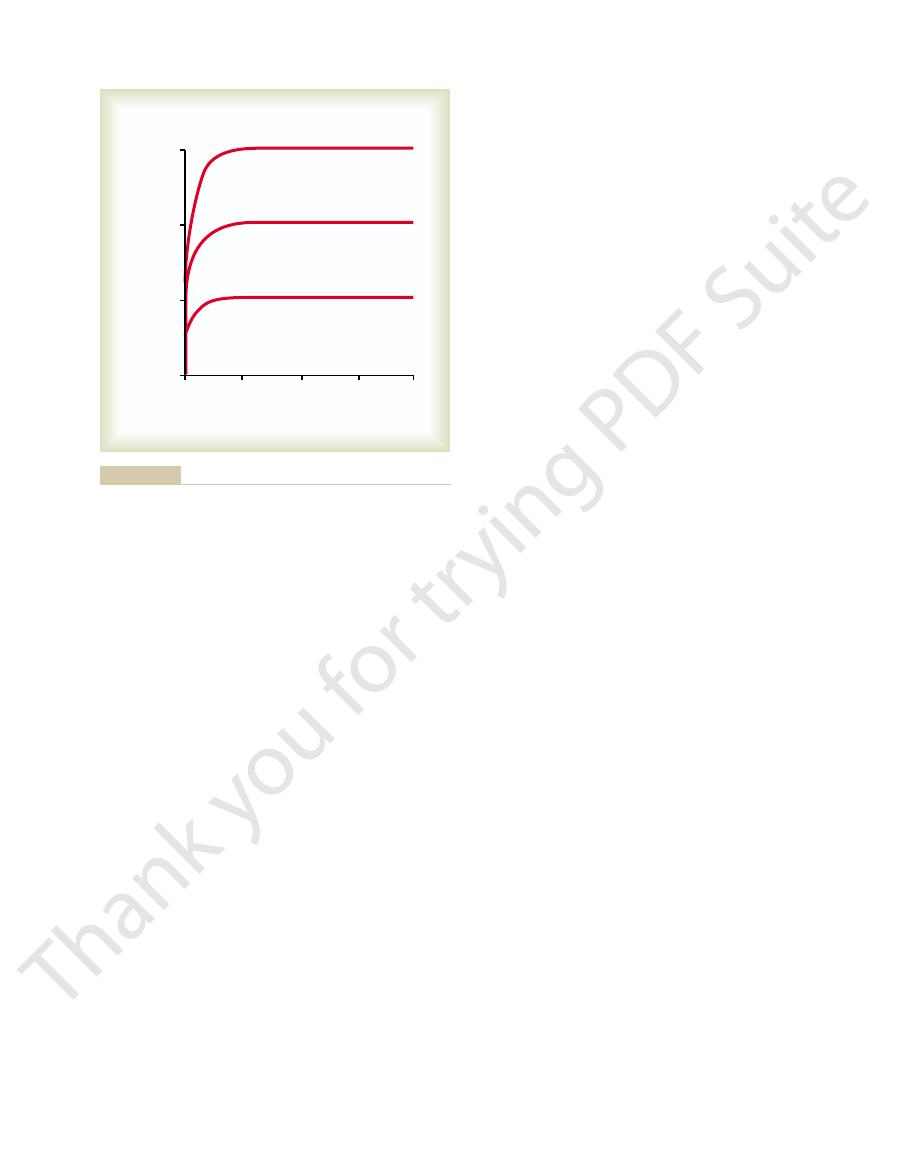
higher. This is shown in Figure 40–4. Note that an
tissue, and the tissue P
also about 40 mm Hg.
interstitium. Therefore, the P
falls almost to equal the 40 mm Hg pressure in the
504
Unit VII
Respiration
blood into the tissues—so rapidly that the capillary Po
2
o
2
of the blood leaving
the tissue capillaries and entering the systemic veins is
Effect of Rate of Blood Flow on Interstitial Fluid P
O2
.
If the
blood flow through a particular tissue is increased,
greater quantities of oxygen are transported into the
o
2
becomes correspondingly
increase in flow to 400 per cent of normal increases
the Po
2
which the Po
2
o
2
O2
.
If
the cells use more oxygen for metabolism than nor-
o
2
tial fluid Po
2
when the cellular oxygen consumption is
o
2
when consumption is
decreased.
o
2
is determined by a balance
between (1) the rate of oxygen transport to the tissues
in the blood and (2) the rate at which the oxygen is used
the intracellular Po
2
in the peripheral tissue cells
remains lower than the Po
2
in the peripheral capillar-
o
2
ranges from
normally required for full support of the chemical
even this low intracellular Po
2
cellular Pco
2
co
2
,
carbon dioxide diffuses from the cells into the tissue
into the alveoli and is expired.
dioxide diffuses in the direction exactly opposite to the
between diffusion of carbon dioxide and of oxygen:
less than the pressure differences required to cause
2
pressures are approxi-
mately the following:
co
2
co
2
,
co
2
co
2
of the venous blood leaving the
the tissue capillary blood comes almost exactly
to equilibrium with the interstitial Pco
2
of
co
2
of the blood entering the pulmonary
co
2
of
pressure difference causes all the required carbon
dioxide diffusion out of the pulmonary capillaries
Arterial end
of capillary
Venous end
of capillary
40 mm Hg
23 mm Hg
P
O
2
= 40 mm Hg
P
O
2
= 95 mm Hg
23 mm Hg.)
40 mm Hg, and in tissue cells
Diffusion of oxygen from a tissue capillary to the cells. (P
Figure 40–3
O
2
in
interstitial fluid
=
=
100
400
700
200
300
Upper limit of infinite blood flow
0
100
80
60
40
20
0
Blood flow (per cent of normal)
500
600
A
B
C
Interstitial fluid P
O
2
(mm Hg)
1
/
4
n
o
rm
al
O
2
co
nsu
mpti
on
N
or
m
al
O
2
c
o
nsu
mp
t
ion
4
¥
n
o
rm
al O
2
con
sum
ption
Effect of blood flow and rate of oxygen consumption on tissue P
Figure 40–4
O
2
.
released from the hemoglobin. This is the basis for
is low, as in the tissue capillaries, oxygen is
capillaries, oxygen binds with the hemoglobin, but
is high, as in the pulmonary
of hemoglobin. When P
32, where it was pointed out that the oxygen molecule
The chemistry of hemoglobin is presented in Chapter
with Hemoglobin
under normal conditions,
Thus,
solved state in the water of the plasma and blood cells.
The remaining 3 per cent is transported in the dis-
combination with hemoglobin in the red blood cells.
Normally, about 97 per cent of the oxygen transported
Transport
Role of Hemoglobin in Oxygen
40 mm Hg.
to fall to about 41 mm Hg,
at all rates of blood flow, whereas decreasing
2. Note also that a 10-fold increase in tissue
the tissue capillaries.
in the arterial blood (40 mm Hg) entering
41 mm Hg, down to a level almost equal to the
from the normal value of 45 mm Hg to
Conversely, increasing the blood flow to six
45 mm Hg to an elevated level of 60 mm Hg.
1. A decrease in blood flow from normal (point A)
effects, as follows:
. Figure 40–7 shows these
Tissue capillary blood flow and tissue
Effect of Rate of Tissue Metabolism and Tissue Blood Flow on
oxygen diffusion, except that it is in the opposite
one third the distance through the capillaries. This
40 mm Hg before it has passed more than about
40–6, the P
into the alveoli. Furthermore, as shown in Figure
Transport of Oxygen and Carbon Dioxide in Blood and Tissue Fluids
Chapter 40
505
co
2
of the pulmonary capillary blood
falls to almost exactly equal the alveolar Pco
2
of
is the same effect that was observed earlier for
direction.
Interstitial P
CO
2
.
metabolism affect the Pco
2
in ways exactly opposite to
their effect on tissue Po
2
to one quarter normal (point B) increases
peripheral tissue Pco
2
from the normal value of
times normal (point C) decreases the interstitial
Pco
2
Pco
2
metabolic rate greatly elevates the interstitial fluid
Pco
2
the metabolism to one quarter normal causes the
interstitial fluid Pco
2
closely approaching that of the arterial blood,
from the lungs to the tissues is carried in chemical
oxygen is carried to the
tissues almost entirely by hemoglobin.
Reversible Combination of Oxygen
combines loosely and reversibly with the heme portion
o
2
when Po
2
Arterial end
of capillary
Venous end
of capillary
P
CO
2
= 40 mm Hg
45 mm Hg
46 mm Hg
P
CO
2
= 45 mm Hg
45 mm Hg.)
46 mm Hg, and in interstitial fluid
Figure 40–5
Uptake of carbon dioxide by the blood in the tissue capillaries.
(P
CO
2
in tissue cells
=
=
Arterial End
Venous End
Alveolus P
CO2
= 40 mm Hg
P
CO2
= 45 mm Hg
Blood P
CO
2
(mm Hg)
P
CO2
= 40 mm Hg
Pulmonary Capillary
Alveolar carbon dioxide partial pressure
45
44
43
42
41
40
Pulmonary capillary blood
exchange and venous admixture. Biophys J 8:337, 1968.)
Pulley PE Jr: A theoretical study of pulmonary capillary gas
olus. (This curve was constructed from data in Milhorn HT Jr,
Diffusion of carbon dioxide from the pulmonary blood into the alve-
Figure 40–6
100
400
600
200
300
Normal metabolism
Lower limit of infinite blood flow
0
120
100
80
60
40
20
0
Blood flow (per cent of normal)
500
A
B
Interstitial fluid P
CO
2
(mm Hg)
C
1
/
4
normal metabolism
10
⫻
normal metabolism
Effect of blood flow and metabolic rate on peripheral tissue P
Figure 40–7
CO
2
.
to fall from the normal 40 mm Hg
rate, which, in extreme cases, can cause the muscle
heavy exercise, the muscle cells use oxygen at a rapid
Transport of Oxygen During Strenuous Exercise.
the tissues by each 100 milliliters of blood flow.
milliliters of oxygen are transported from the lungs to
under normal conditions, about 5
hemoglobin). Thus,
of 40 mm Hg, 75 per cent saturated
capillaries, this amount is reduced, on average, to
is shown in Figure 40–9. On passing through the tissue
is about 19.4 milliliters per 100 milliliters of blood. This
systemic arterial blood, which is 97 per cent saturated,
The total
temic Arterial Blood Flows Through the Tissues.
Amount of Oxygen Released from the Hemoglobin When Sys-
scale in Figure 40–8, instead of per cent saturation of
volume per cent of oxygen, as shown by the far right
The oxygen-hemoglobin dissociation curve for
saturated. This is usually expressed as
average, the 15 grams of hemoglobin in 100 milliliters
fore, 15 times 1.34 equals 20.1, which means that, on
impurities such as methemoglobin reduce this). There-
milliliters when the hemoglobin is chemically pure, but
milliliters of blood, and each gram of hemoglobin can
The blood of a normal person
is about 40 mm Hg, and
venous blood returning from the peripheral tissues, the
Conversely, in normal
usual oxygen saturation of systemic arte-
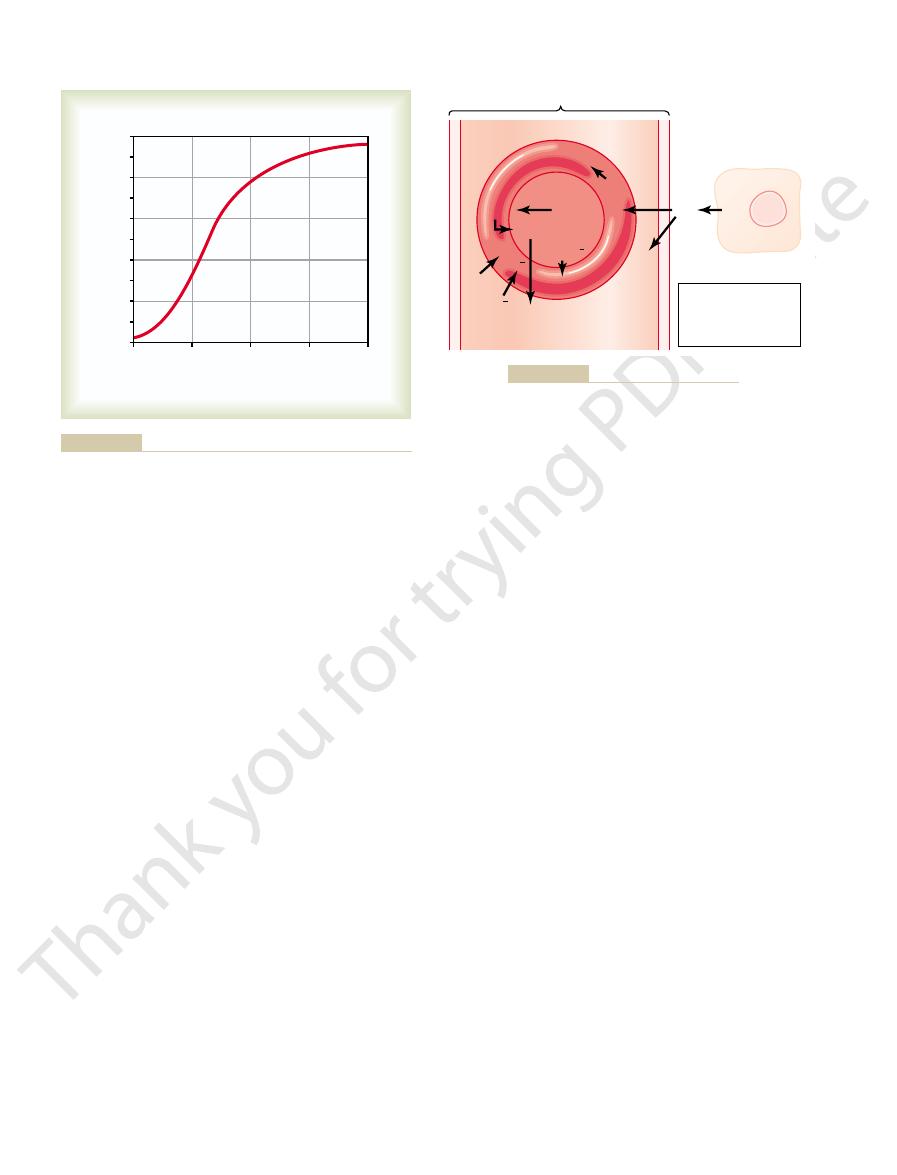
about 95 mm Hg, one can see from the dissociation
increases, which is called the
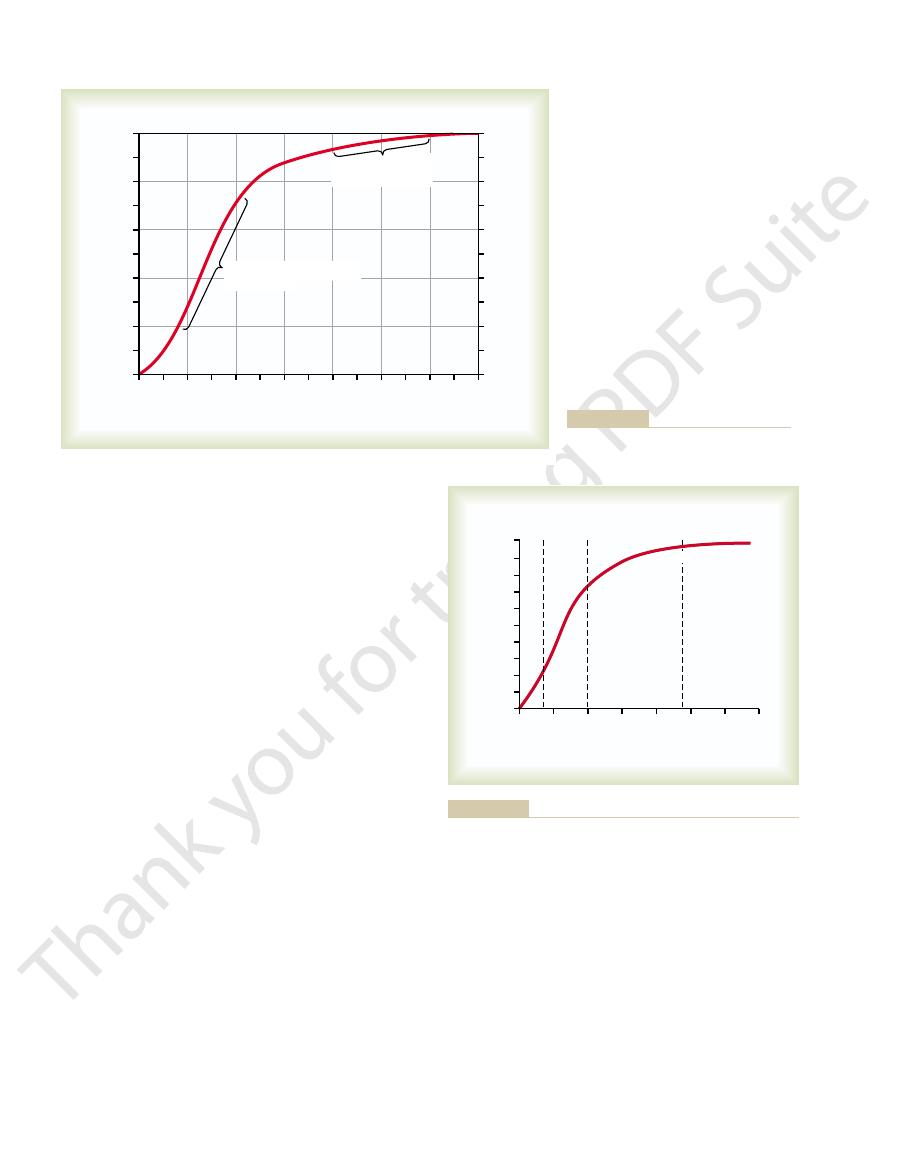
the oxygen-hemoglobin dissociation curve, which
Figure 40–8 shows
Oxygen-Hemoglobin Dissociation Curve.
tissues.
506
Unit VII
Respiration
almost all oxygen transport from the lungs to the
demonstrates a progressive increase in the percentage
of hemoglobin bound with oxygen as blood Po
2
per cent saturation of
hemoglobin. Because the blood leaving the lungs and
entering the systemic arteries usually has a Po
2
of
curve that the
rial blood averages 97 per cent.
Po
2
the saturation of hemo-
globin averages 75 per cent.
Maximum Amount of Oxygen That Can Combine with the
Hemoglobin of the Blood.
contains about 15 grams of hemoglobin in each 100
bind with a maximum of 1.34 milliliters of oxygen (1.39
of blood can combine with a total of almost exactly 20
milliliters of oxygen if the hemoglobin is 100 per cent
20 volumes per
cent.
the normal person can also be expressed in terms of
hemoglobin.
quantity of oxygen bound with hemoglobin in normal
14.4 milliliters (Po
2
During
interstitial fluid Po
2
130 140
80 90
110
10
40
60 70
20 30
50
100
120
0
100
90
80
70
60
50
40
30
20
10
0
Pressure of oxygen in blood (P
O
2
) (mm
Hg)
Volumes (%)
Oxygenated blood
leaving the lungs
20
18
16
14
12
10
8
6
4
2
0
Reduced blood returning
from tissues
Hemoglobin saturation (%)
Figure 40–8
Oxygen-hemoglobin dissociation curve.
20
100
140
60
80
0
Oxygen in blood (volumes %)
Venous blood in exercise
Normal venous blood
Normal arterial blood
20
18
16
14
12
10
8
6
4
2
0
Pressure of oxygen in blood (P
O
2
) (mm Hg)
120
40
O
2
bo
un
d
with
hemogl
o
bin
Effect of blood P
Figure 40–9
O
2
on the quantity of oxygen bound with hemo-
globin in each 100 milliliters of blood.

oxygen-hemoglobin dissociation curve shifts, on
pH decreasing from the normal value of 7.4 to 7.2, the
that when the blood becomes slightly acidic, with the
manner shown in Figure 40–10. This figure shows
However, a number of factors can displace the disso-
40–8 and 40–9 are for normal, average blood.
The oxygen-hemoglobin dissociation curves of Figures
Transport
Factors That Shift the Oxygen-
buffer” function of the blood hemoglobin system.
demonstrating beautifully the tissue “oxygen
500 mm Hg P
the normal 40 mm Hg. Consequently, the level of alve-
to the tissues, this reduces the P
quently. Then, when the blood passes through the
the fluid of the blood, as will be discussed subse-
hemoglobin can never rise above 100 per cent, which
500 mm Hg, the maximum oxygen saturation of
Conversely, when the alveolar P
from 104 to 60 mm Hg.
hardly changes, despite the marked fall in alveolar
below the normal value of 40 mm Hg. Thus, the tissue
of the venous blood falls to 35 mm Hg—only 5 mm Hg
through the tissues; to remove this oxygen, the P
Further, the tissues still remove about 5 milliliters of
is decreased to as low as 60 mm Hg, the arterial hemo-
ation curve in Figure 40–8 that when the alveolar P
changes little.
Even so, the tissue P
ized chambers, the P
compressed air, such as deep in the sea or in pressur-
this amount. Alternatively, when one enters areas of
in an airplane, the P
104 mm Hg, but as one ascends a mountain or ascends
The normal P
Tissue P
When Atmospheric Oxygen Concentration Changes Markedly,
about 15 and 40 mm Hg.
hemoglobin. It can be seen, then, that the hemoglobin
; that is, a very small fall in P
ered from the hemoglobin to the tissues. But this can
Conversely, during heavy exercise, extra amounts of
tissues at about 40 mm Hg.
from the hemoglobin. In this way, the hemoglobin nor-
this 40 mm Hg level, because if it did, the amount of
Therefore, the tissue P
must fall to about 40 mm Hg.
blood flow, the P
in Figure 40–9, one can see that for the normal 5 mil-
of blood passing through the tissue capillaries. Refer-
Under basal conditions, the tissues require
Tissues.
in the tissues. This can be explained as follows.
buffer” system. That is, the hemoglobin in the blood is
essential to life. This is its function as a “tissue oxygen
oxygen to the tissues, it performs another function
Tissue P
Effect of Hemoglobin to “Buffer” the
the tissues.
recorded—that is, essentially all the oxygen is given to
slow or the metabolic rate is very high, utilization
the entire body can increase to 75 to 85 per cent. And
During strenuous exercise, the utilization coefficient in
oxygenated hemoglobin gives its oxygen to the tissues.
the preceding discussion—that is, 25 per cent of the
value for this is about 25 per cent, as is evident from
The normal
The percentage of the blood that
strenuous exercise.
into muscles during exercise, so that muscle tissue P
transport to the tissues. We see later in the chapter
normal in well-trained marathon runners. Thus, multi-
that passes through the tissues. And keep in mind that
milliliters of blood flow. Thus, three times as much
40–9. Thus, 19.4 – 4.4, or 15 milliliters, is the quantity
bin in each 100 milliliters of blood, as shown in Figure
to as low as 15 mm Hg. At this low pressure, only 4.4
Transport of Oxygen and Carbon Dioxide in Blood and Tissue Fluids
Chapter 40
507
milliliters of oxygen remain bound with the hemoglo-
of oxygen actually delivered to the tissues by each 100
oxygen as normal is delivered in each volume of blood
the cardiac output can increase to six to seven times
plying the increase in cardiac output (six- to sevenfold)
by the increase in oxygen transport in each volume of
blood (threefold) gives a 20-fold increase in oxygen
that several other factors facilitate delivery of oxygen
o
2
often falls very little below normal even during very
Utilization Coefficient.
gives up its oxygen as it passes through the tissue cap-
illaries is called the utilization coefficient.
in local tissue areas where blood flow is extremely
coefficients approaching 100 per cent have been
O
2
Although hemoglobin is necessary for the transport of
mainly responsible for stabilizing the oxygen pressure
Role of Hemoglobin in Maintaining Nearly Constant P
O
2
in the
about 5 milliliters of oxygen from each 100 milliliters
ring back to the oxygen-hemoglobin dissociation curve
liliters of oxygen to be released per 100 milliliters of
o
2
o
2
normally cannot rise above
oxygen needed by the tissues would not be released
mally sets an upper limit on the oxygen pressure in the
oxygen (as much as 20 times normal) must be deliv-
be achieved with little further decrease in tissue Po
2
because of (1) the steep slope of the dissociation curve
and (2) the increase in tissue blood flow caused by the
decreased Po
2
o
2
causes
large amounts of extra oxygen to be released from the
in the blood automatically delivers oxygen to the
tissues at a pressure that is held rather tightly between
the Buffer Effect of Hemoglobin Still Maintains Almost Constant
O
2
.
o
2
in the alveoli is about
o
2
can easily fall to less than half
o
2
may rise to 10 times this level.
o
2
It can be seen from the oxygen-hemoglobin dissoci-
o
2
globin is still 89 per cent saturated with oxygen—only
8 per cent below the normal saturation of 97 per cent.
oxygen from each 100 milliliters of blood passing
o
2
Po
2
Po
2
o
2
rises as high as
is only 3 per cent above the normal level of 97 per cent.
Only a small amount of additional oxygen dissolves in
tissue capillaries and loses several milliliters of oxygen
o
2
of the capillary
blood to a value only a few millimeters greater than
olar oxygen may vary greatly—from 60 to more than
o
2
—and still the Po
2
in the peripheral
tissues does not vary more than a few millimeters from
normal,
Hemoglobin Dissociation Curve—
Their Importance for Oxygen
ciation curve in one direction or the other in the
when the ADP concentration is altered, the rate of
given concentration of ADP in the cell. Conversely,
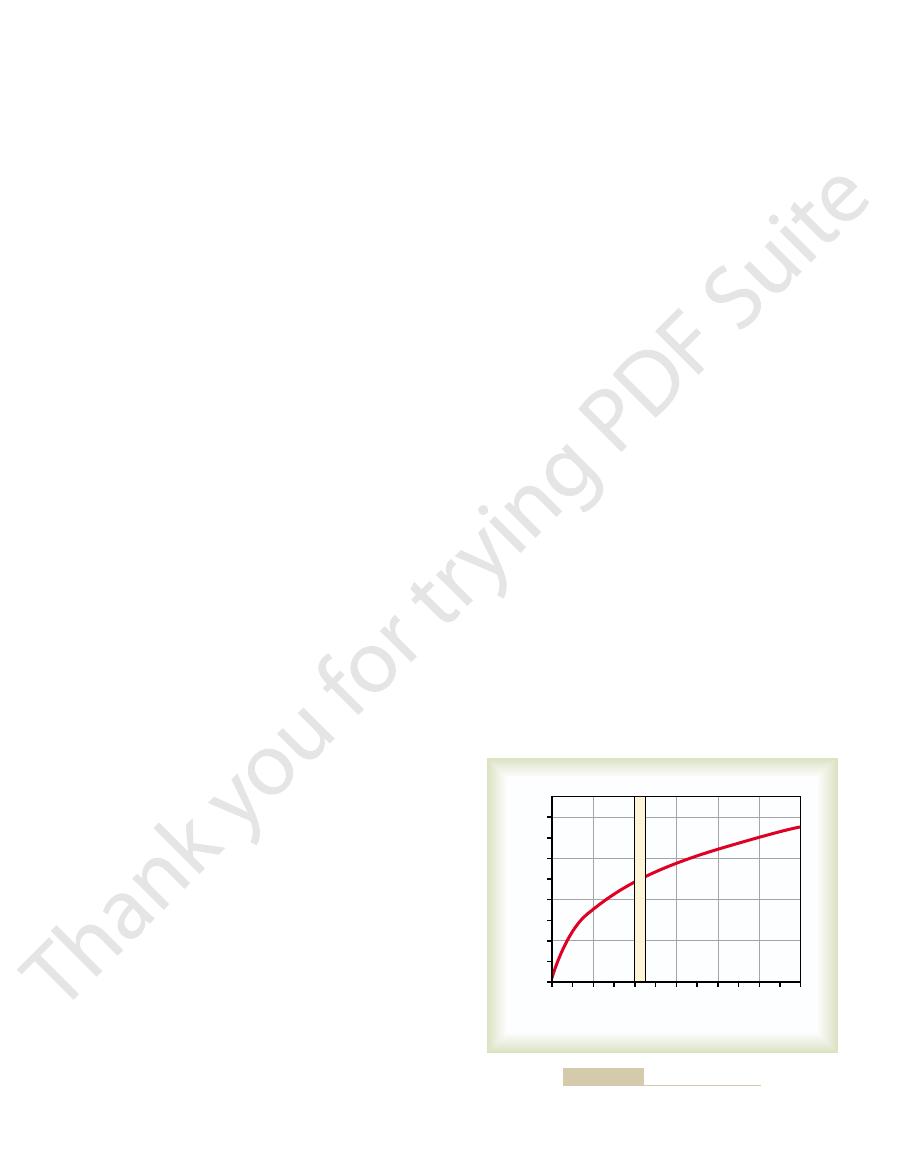
is above 1 mm Hg,
oxygen usage at different concentrations of ADP. Note
effect is demonstrated in Figure 40–11, which shows
(ADP) in the cells. This
Instead, the main limiting factor is the
limiting factor in the rates of the chemical reactions.
more than 1 mm Hg, oxygen availability is no longer a
Chapter 67, are geared so that when the cellular P
enzyme systems of the cell, which are discussed in
take place. The reason for this is that the respiratory
Metabolic Use of Oxygen by the Cells
the lungs, the shift occurs in the opposite direction,
already been removed from the hemoglobin. Then, in
as 40 mm Hg, even when 70 per cent of the oxygen has
considerably to the right. This right-hand shift
more. All these factors act together to shift the oxygen-
perature of the muscle often rises 2° to 3°C, which can
tion in the muscle capillary blood. In addition, the tem-
carbon dioxide; this and several other acids released
exercising muscles, in turn, release large quantities of
of oxygen to the active, exercising muscle fibers. The
siderably to the right, thus delivering extra amounts
cise, several factors shift the dissociation curve con-
Shift of the Dissociation Curve During Exercise.
blood flow.
hypoxia, especially to hypoxia caused by poor tissue
BPG. Therefore, under some conditions, the BPG
tissues at as much as 10 mm Hg higher tissue oxygen
the right. This causes oxygen to be released to the
the blood increases considerably, thus shifting the
last longer than a few hours, the quantity of BPG in
to the right all the time. In hypoxic conditions that
The normal BPG in the blood keeps the
Curve.
oxygen transport to the tissues.
becomes considerably increased, thus allowing greater
upward. Therefore, the quantity of oxygen that binds
the hydrogen ion concentration,
shifting the
the alveoli. This reduces the blood P
Exactly the opposite effects occur in the lungs,
oxygen to the tissues.
Figure 40–10, forcing oxygen away from the hemoglo-
tion curve to the right and downward, as shown in
These effects shift the oxygen-hemoglobin dissocia-
fuses from the tissue cells into the blood.This increases
blood passes through the tissues, carbon dioxide dif-
Bohr effect, which can be explained as follows: As the
oxygenation of the blood in the lungs. This is called the
ciation Curve—The Bohr Effect.
Increased Delivery of Oxygen to the Tissues When Carbon
different metabolic conditions.
ture, and (3) increased 2,3-biphosphoglycerate (BPG),
dioxide concentration, (2) increased blood tempera-
known to shift the curve. Three of these, all of which
In addition to pH changes, several other factors are
average, about 15 per cent to the right. Conversely, an
508
Unit VII
Respiration
increase in pH from the normal 7.4 to 7.6 shifts the
curve a similar amount to the left.
shift the curve to the right, are (1) increased carbon
a metabolically important phosphate compound
present in the blood in different concentrations under
Dioxide and Hydrogen Ions Shift the Oxygen-Hemoglobin Disso-
A shift of the oxygen-
hemoglobin dissociation curve to the right in response
to increases in blood carbon dioxide and hydrogen
ions has a significant effect by enhancing the release
of oxygen from the blood in the tissues and enhancing
the blood Po
2,
which in turn raises the blood H
2
CO
3
(carbonic acid) and the hydrogen ion concentration.
bin and therefore delivering increased amounts of
where carbon dioxide diffuses from the blood into
co
2
and decreases
oxygen-hemoglobin dissociation curve to the left and
with the hemoglobin at any given alveolar Po
2
Effect of BPG to Shift the Oxygen-Hemoglobin Dissociation
oxygen-hemoglobin dissociation curve shifted slightly
oxygen-hemoglobin dissociation curve even farther to
pressure than would be the case without this increased
mechanism can be important for adaptation to
During exer-
by the muscles increase the hydrogen ion concentra-
increase oxygen delivery to the muscle fibers even
hemoglobin dissociation curve of the muscle capillary
blood
of the curve forces oxygen to be released from the
blood hemoglobin to the muscle at Po
2
levels as great
allowing the pickup of extra amounts of oxygen from
the alveoli.
Effect of Intracellular P
O
2
on Rate of Oxygen Usage.
Only
a minute level of oxygen pressure is required in the
cells for normal intracellular chemical reactions to
o
2
is
concentration
of adenosine diphosphate
the relation between intracellular Po
2
and the rate of
that whenever the intracellular Po
2
the rate of oxygen usage becomes constant for any
90
140
10
100110
70
120130
50
80
0
100
90
80
70
60
50
40
30
20
10
0
7.6
pH
7.4
7.2
60
40
30
20
Hemoglobin saturation (%)
Shift to right:
(1) Increased hydrogen ions
(2) Increased CO
2
(3) Increased temperature
(4) Increased BPG
Pressure of oxygen in blood (P
O
2
) (mm Hg)
caused by an increase in hydrogen ion concentration (decrease
Figure 40–10
Shift of the oxygen-hemoglobin dissociation curve to the right
in pH). BPG, 2,3-biphosphoglycerate.
Therefore, a carbon monoxide pressure of only
), allows the carbon monoxide to compete equally
that of normal alveolar oxygen (100 mm Hg
monoxide partial pressure of only 0.4 mm Hg in the
sociation curve of Figure 40–8. Therefore, a carbon
monoxide partial pressures, shown on the abscissa, are
hemoglobin dissociation curve, except that the carbon
40–12. This curve is almost identical to the oxygen-
monoxide–hemoglobin dissociation curve in Figure
tenacity as oxygen, which is demonstrated by the carbon
blood. Further, it binds with about 250 times as much
of Oxygen
Combination of Hemoglobin with
among deep-sea divers.
and even death, as discussed in detail in Chapter 44
soning” ensues. This often leads to brain convulsions
excess of oxygen occurs in the tissues, and “oxygen poi-
much greater, sometimes so much so that a serious
levels, the
state falls to as little as 1.5 per cent. But if a person
of oxygen to the tissues increases another threefold, the
During strenuous exercise, when hemoglobin release
about 3 per cent of the total, as compared with 97 per
the tissues in the dissolved state is normally slight, only
globin. Therefore, the amount of oxygen transported to
liters of arterial blood flow. This compares with almost
words, 0.17 milliliter of oxygen is normally transported
0.12 milliliter of oxygen remains dissolved. In other
to the normal 40 mm Hg in the tissue capillaries, only
water in the blood, and when the P
of 95 mm Hg, about 0.29 mil-
Transport of Oxygen in the
required to continue the life of the cells.
long, because the cells receive less oxygen than is
blood flow limited.
these conditions, the rate of tissue usage of oxygen
1 mm Hg required for intracellular metabolism. Under
available oxygen also falls to zero. Thus, there are
If the rate of blood flow falls to zero, the amount of
100 milliliters of blood and (2) the rate of blood flow.
The total
states.
But this almost never occurs, except in pathological
mined by the amount of ADP formed in the cells.
under these conditions, oxygen usage by the cells is
to maintain maximal intracellular metabolism. Thus,
located farther from the capillaries, and the rate of
for metabolism. However, occasionally, cells are
micrometers away from a capillary, and oxygen nor-
Tissue cells are seldom more than 50
Effect of Diffusion Distance from the Capillary to the Cell on
ADP is formed from ATP.
expenditure within the cells—that is, by the rate at which
by the cells is controlled ultimately by the rate of energy
normal operating conditions, the rate of oxygen usage
energy that reconverts the ADP back to ATP.
it combines with the various cell nutrients, releasing
of ADP increases the metabolic usage of oxygen as
converted into ADP. The increasing concentration
phate (ATP) is used in the cells to provide energy, it is
As explained in Chapter 3, when adenosine triphos-
Transport of Oxygen and Carbon Dioxide in Blood and Tissue Fluids
Chapter 40
509
oxygen usage changes in proportion to the change in
ADP concentration.
Under
Oxygen Usage.
mally can diffuse readily enough from the capillary to
the cell to supply all the required amounts of oxygen
oxygen diffusion to these cells can become so low that
intracellular Po
2
falls below the critical level required
said to be diffusion limited and is no longer deter-
Effect of Blood Flow on Metabolic Use of Oxygen.
amount of oxygen available each minute for use in
any given tissue is determined by (1) the quantity of
oxygen that can be transported to the tissue in each
times when the rate of blood flow through a tissue
can be so low that tissue Po
2
falls below the critical
is
Neither diffusion-limited nor
blood flow–limited oxygen states can continue for
Dissolved State
At the normal arterial Po
2
liliter of oxygen is dissolved in every 100 milliliters of
o
2
of the blood falls
in the dissolved state to the tissues by each 100 milli-
5 milliliters of oxygen transported by the red cell hemo-
cent transported by the hemoglobin.
relative quantity of oxygen transported in the dissolved
breathes oxygen at very high alveolar Po
2
amount transported in the dissolved state can become
in relation to the high-pressure breathing of oxygen
Carbon Monoxide—Displacement
Carbon monoxide combines with hemoglobin at the
same point on the hemoglobin molecule as does oxygen;
it can therefore displace oxygen from the hemoglobin,
thereby decreasing the oxygen carrying capacity of
at a level
1
/
250
of those for the oxygen-hemoglobin dis-
alveoli,
1
/
250
Po
2
with the oxygen for combination with the hemoglobin
and causes half the hemoglobin in the blood to become
bound with carbon monoxide instead of with oxygen.
0
1.5
1.0
0.5
0
ADP = 1
1
/
2
normal
ADP = Normal resting level
ADP =
3
2
Intracellular P
O
2
(mm Hg)
1
4
1
/
2
normal
Rate of oxygen usage
(times normal resting level)
rate of oxygen usage is the intracellular concentration of ADP.
remains above 1 mm Hg, the controlling factor for the
Effect of intracellular adenosine diphosphate (ADP) and P
Figure 40–11
O
2
on
rate of oxygen usage by the cells. Note that as long as the intra-
cellular P
O
2
carbonic anhydrase,
This reaction would occur
The dis-
Effect of Carbonic Anhydrase.
Reaction of Carbon Dioxide with Water in the Red
Transport of Carbon Dioxide in the Form of Bicarbonate Ion
100 milliliters of blood flow. This is about 7 per cent of
milliliter. Therefore, only about 0.3 milliliter of carbon
40 mm Hg is about 2.4 milliliters, or a difference of 0.3
(2.7 volumes per cent). The amount dissolved at
the fluid of the blood at 45 mm Hg is about 2.7 ml/dl
40 mm Hg. The amount of carbon dioxide dissolved in
blood is 45 mm Hg and that of arterial blood is
solved state to the lungs. Recall that the P
. A small
Transport of Carbon Dioxide in the Dissolved State
tions, shown in Figure 40–13, which are essential for
the tissue capillaries, the carbon dioxide initiates a host
dissolved molecular carbon dioxide form. On entering
To begin the process of carbon dioxide transport,
Dioxide Is Transported
from the tissues to the lungs in each 100 milliliters of
average of 4 milliliters of carbon dioxide is transported
Chapter 30. Under normal resting conditions,
balance of the body fluids, which is discussed in
than oxygen can be. However, the amount of carbon
even in the most abnormal conditions, carbon dioxide
as problematical as transport of oxygen is, because
Transport of carbon dioxide by the blood is not nearly
Transport of Carbon Dioxide
therapy.
dioxide therapy, carbon monoxide can be removed from
carbon monoxide. With intensive oxygen and carbon
this strongly stimulates the respiratory center, which
administration of 5 per cent carbon dioxide, because
bin. The patient can also benefit from simultaneous
can be treated by administering pure oxygen, because
aware of the danger.
organs affected by lack of oxygen, the person may
) is absent. Because the brain is one of the first
is not reduced, and the feedback mechanism
Also, P
such as a bluish color of the fingertips or lips (cyanosis).
monoxide especially dangerous, because the blood is
blood may be normal. This makes exposure to carbon
reduced in carbon monoxide poisoning, the P
0.6 mm Hg (a volume concentration of less than one
510
Unit VII
Respiration
part per thousand in air) can be lethal.
Even though the oxygen content of blood is greatly
o
2
of the
bright red and there are no obvious signs of hypoxemia,
o
2
that usually stimulates increased respiration rate in
response to lack of oxygen (usually reflected by a low
Po
2
become disoriented and unconscious before becoming
A patient severely poisoned with carbon monoxide
oxygen at high alveolar pressure can displace carbon
monoxide rapidly from its combination with hemoglo-
increases alveolar ventilation and reduces the alveolar
the blood as much as 10 times as rapidly as without
in the Blood
can usually be transported in far greater quantities
dioxide in the blood has a lot to do with the acid-base
an
blood.
Chemical Forms in Which Carbon
carbon dioxide diffuses out of the tissue cells in the
of almost instantaneous physical and chemical reac-
carbon dioxide transport.
portion of the carbon dioxide is transported in the dis-
co
2
of venous
dioxide is transported in the dissolved form by each
all the carbon dioxide normally transported.
Blood Cells—
solved carbon dioxide in the blood reacts with water
to form carbonic acid.
much too slowly to be of importance were it not for
the fact that inside the red blood cells is a protein
enzyme called
which catalyzes the
0.1
0.4
0.2
Gas pressure of carbon monoxide (mm Hg)
0
100
90
80
70
60
50
40
30
20
10
0
0.3
Hemoglobin saturation (%)
extremely low carbon monoxide pressures at which carbon
Figure 40–12
Carbon monoxide–hemoglobin dissociation curve. Note the
monoxide combines with hemoglobin.
Interstitial
fluid
Capillary
Red blood cell
Plasma
Carbonic
anhydrase
1. CO
2
CO
2
transported as:
= 7%
= 23%
= 70%
2. Hgb • CO
2
3.
Hgb
Hgb
Cl
HHgb
Hgb • CO
2
H
2
CO
3
H
2
O
H
2
O
CO
2
CO
2
CO
2
Cell
CO
2
H
2
O +
+
H
+
+
+
HCO
3
–
Cl
HCO
3
–
HCO
3
ⴚ
Transport of carbon dioxide in the blood.
Figure 40–13
from the blood. Indeed, this effect, called the
transport. The reverse is also true: binding of oxygen
Earlier in the chapter, it was pointed out that an
Transport
passes through the lungs.
tissues to the lungs. That is, the concentration rises to
cent, but only 4 volumes per cent of this is exchanged
venous blood, which is a very narrow range. Note also
limits of 40 mm Hg in arterial blood and 45 mm Hg in
dioxide dissociation curve
The curve shown in Figure 40–14—called the
total carbon dioxide.
dioxide with water inside the red blood cells, it is
in each 100 milliliters of blood. However, because this
that is, normally about 1.5 milliliters of carbon dioxide
The quantity of carbon dioxide that can be carried
laries. This is much less significant for the transport of
capillaries.
alveoli, where the P
reversible reaction that occurs with a loose bond, so
Hgb). This
reacting with water, carbon dioxide reacts directly with
Transport of Carbon Dioxide in Combination with Hemoglobin
45 mm Hg.
made to rise to 80 mm Hg instead of the normal
in the red blood cells, carbon dioxide transport from
is by far the most important. Indeed, when a carbonic
lungs. Thus, this means of transporting carbon dioxide
The reversible combination of carbon dioxide with
chloride shift.
cells is greater than that of arterial red cells, a phe-
ties. Thus, the chloride content of venous red blood
bicarbonate-chloride
the red cells to take their place. This is made possible
cells into the plasma, while chloride ions diffuse into
turn, many of the bicarbonate ions diffuse from the red
hemoglobin protein is a powerful acid-base buffer. In
the hemoglobin in the red blood cells, because the
). Most of the hydrogen ions then combine with
In another fraction of a second, the
Dissociation of Carbonic Acid into Bicarbonate and
blood leaves the tissue capillaries.
This allows tremendous amounts of carbon dioxide to
as is true in the plasma, the reaction occurs so rapidly
instead of requiring many seconds or minutes to occur,
erates its reaction rate about 5000-fold. Therefore,
Transport of Oxygen and Carbon Dioxide in Blood and Tissue Fluids
Chapter 40
511
reaction between carbon dioxide and water and accel-
in the red blood cells that it reaches almost complete
equilibrium within a very small fraction of a second.
react with the red blood cell water even before the
Hydrogen Ions.
carbonic acid formed in the red cells (H
2
CO
3
) disso-
ciates into hydrogen and bicarbonate ions (H
+
and
HCO
3
–
by the presence of a special
carrier protein in the red cell membrane that shuttles
these two ions in opposite directions at rapid veloci-
nomenon called the
water in the red blood cells under the influence of car-
bonic anhydrase accounts for about 70 per cent of the
carbon dioxide transported from the tissues to the
anhydrase inhibitor (acetazolamide) is administered
to an animal to block the action of carbonic anhydrase
the tissues becomes so poor that the tissue Pco
2
can be
and Plasma Proteins—Carbaminohemoglobin.
In addition to
amine radicals of the hemoglobin molecule to form
the compound carbaminohemoglobin (CO
2
combination of carbon dioxide and hemoglobin is a
that the carbon dioxide is easily released into the
co
2
is lower than in the pulmonary
A small amount of carbon dioxide also reacts in the
same way with the plasma proteins in the tissue capil-
carbon dioxide because the quantity of these proteins
in the blood is only one fourth as great as the quantity
of hemoglobin.
from the peripheral tissues to the lungs by carbamino
combination with hemoglobin and plasma proteins is
about 30 per cent of the total quantity transported—
reaction is much slower than the reaction of carbon
doubtful that under normal conditions this carbamino
mechanism transports more than 20 per cent of the
Carbon Dioxide Dissociation Curve
carbon
—depicts the dependence
of total blood carbon dioxide in all its forms on Pco
2
.
Note that the normal blood Pco
2
ranges between the
that the normal concentration of carbon dioxide in the
blood in all its different forms is about 50 volumes per
during normal transport of carbon dioxide from the
about 52 volumes per cent as the blood passes through
the tissues and falls to about 48 volumes per cent as it
When Oxygen Binds with
Hemoglobin, Carbon Dioxide Is
Released (the Haldane Effect)
to Increase CO
2
increase in carbon dioxide in the blood causes oxygen
to be displaced from the hemoglobin (the Bohr effect),
which is an important factor in increasing oxygen
with hemoglobin tends to displace carbon dioxide
Haldane
effect, is quantitatively far more important in
60
80
100
120
10
30
50
70
90
110
40
0
80
70
60
50
40
30
20
10
0
20
CO
2
in blood (volumes per cent)
Gas pressure of carbon dioxide (mm Hg)
Normal operating range
Figure 40–14
Carbon dioxide dissociation curve.
cine. Philadelphia: Mosby, 2002.
Albert R, Spiro S, Jett J: Comprehensive Respiratory Medi-
the average value for R is considered to be 0.825.
average amounts of carbohydrates, fats, and proteins,
Chapter 71.) For a person on a normal diet consuming
1.00. (The tissue respiratory quotient is discussed in
chemical reactions
fats are metabolized, the
water instead of carbon dioxide. In other words, when
oxygen reacts with fats, a large share of the oxygen
formed for each molecule of oxygen consumed; when
with carbohydrates, one molecule of carbon dioxide is
energy, the R level falls to as low as 0.7. The reason
drates for body metabolism, R rises to 1.00. Conversely,
conditions. When a person is using exclusively carbohy-
The value for R changes under different metabolic
(R). That is,
exchange ratio
taken up by the lungs. The ratio of carbon dioxide
resting conditions, only about 82 per cent as much
to the lungs is about 4 milliliters. Thus, under normal
100 milliliters of blood is about 5 milliliters, whereas
The discerning student will have noted that normal
Respiratory Exchange Ratio
normal, thus causing significant tissue acidosis.
themselves) can be as much as 0.50, about 12 times
when blood flow through the tissues is sluggish, the
cise or other conditions of high metabolic activity, or
to the arterial value of 7.41 once again. In heavy exer-
released from the blood in the lungs, with the pH rising
place. The reverse occurs when carbon dioxide is
7.37. In other words, a pH change of 0.04 unit takes
tissue capillaries, the pH falls to a venous value of about
7.41, and as the blood acquires carbon dioxide in the
greatly). Ordinarily, arterial blood has a pH of about
pH. However, reaction of this acid with the acid-base
The carbonic acid formed when carbon dioxide enters
Carbon Dioxide Transport
Change in Blood Acidity During
pickup of carbon dioxide in the tissues.
dioxide. Thus, the Haldane effect approximately
falls to 48 volumes per cent (point B). This represents
curve of the figure, so that the carbon dioxide content
volumes per cent of carbon dioxide. However, the
50 volumes per cent, which would be a loss of only 2
curve did not shift because of the Haldane effect, the
rises to 100 mm Hg. If the carbon dioxide dissociation
falls to 40 mm Hg and the P
ing the lungs, the P
carbon dioxide to combine with the blood. On enter-
45 mm Hg in the tissues causes 52 volumes per cent of
illaries. Point A shows that the normal P
is 40 mm Hg, which is the case in the tissue cap-
case in the blood capillaries of the lungs, and (2) when
is 100 mm Hg, which is the
curves: (1) when the P
dioxide from the tissues to the lungs. This figure shows
Figure 40–15 demonstrates quantitatively the signif-
into the air.
released from the blood into the alveoli and, finally,
water and carbon dioxide, and the carbon dioxide is
ions to form carbonic acid; this then dissociates into
of hydrogen ions, and these bind with bicarbonate
bamino form from the blood. (2) The increased acidity
dioxide to form carbaminohemoglobin, thus displacing
hemoglobin has less tendency to combine with carbon
into the alveoli in two ways: (1) The more highly acidic
acid. This displaces carbon dioxide from the blood and
The Haldane effect results from the simple fact that
512
Unit VII
Respiration
promoting carbon dioxide transport than is the Bohr
effect in promoting oxygen transport.
the combination of oxygen with hemoglobin in the
lungs causes the hemoglobin to become a stronger
much of the carbon dioxide that is present in the car-
of the hemoglobin also causes it to release an excess
icance of the Haldane effect on the transport of carbon
small portions of two carbon dioxide dissociation
o
2
the Po
2
co
2
of
co
2
o
2
carbon dioxide content of the blood would fall only to
increase in Po
2
in the lungs lowers the carbon dioxide
dissociation curve from the top curve to the lower
an additional 2 volumes per cent loss of carbon
doubles the amount of carbon dioxide released from
the blood in the lungs and approximately doubles the
the blood in the peripheral tissues decreases the blood
buffers of the blood prevents the hydrogen ion concen-
tration from rising greatly (and the pH from falling
decrease in pH in the tissue blood (and in the tissues
transport of oxygen from the lungs to the tissues by each
normal transport of carbon dioxide from the tissues
carbon dioxide is expired from the lungs as oxygen is
output to oxygen uptake is called the respiratory
when a person is using exclusively fats for metabolic
for this difference is that when oxygen is metabolized
combines with hydrogen atoms from the fats to form
respiratory quotient of the
in the tissues is about 0.70 instead of
References
R
Rate of carbon dioxide output
Rate of oxygen uptake
=
45
50
35
55
50
45
40
A
B
P
O2
= 40 mm Hg
P
O2
= 100 mm Hg
CO
2
in blood (volumes per cent)
P
CO
2
effect on the transport of carbon dioxide, as discussed in the text.
100 mm Hg or 40 mm Hg. The arrow represents the Haldane
Portions of the carbon dioxide dissociation curve when the P
Figure 40–15
O
2
is

Lippincott Williams & Wilkins, 2003.
The Essentials. Baltimore:
West JB: Pulmonary Physiology
cott Williams & Wilkins, 2001.
Integrated, Case-Based Approach. Philadelphia: Lippin-
West JB: Pulmonary Physiology and Pathophysiology: An
Acta Physiol Scand 168:609, 2000.
transport in muscle.
Wagner PD: Diffusive resistance to O
microcirculation. Physiol Rev 83:933, 2003.
Tsai AG, Johnson PC, Intaglietta M: Oxygen gradients in the
stitutes. News Physiol Sci 16:38, 2001.
Spahn DR, Pasch T: Physiological properties of blood sub-
max. Am J Physiol 271:H721, 1996.
Roy TK, Popel AS: Theoretical predictions of end-capillary
gration of the muscle systems. Adv Physiol Educ 27:183,
Richardson RS: Oxygen transport and utilization: an inte-
168:603, 2000.
transfer in muscle. Acta Physiol Scand
Piiper J: Perfusion, diffusion and their heterogeneities limit-
Physiol Rev 72:301, 1992.
nity in nucleated erythrocytes.
Nikinmaa M:
Membrane transport and control of
Med 33:949, 2003.
metabolic and gas exchange responses to exercise. Sports
Jones AM, Koppo K, Burnley M: Effects of prior exercise on
exchange organs. Respir Physiol 121:1, 2000.
Henry RP, Swenson ER: The distribution and physiological
anhydrase in blood and muscle. Physiol Rev 80:681,
Geers C, Gros G: Carbon dioxide transport and carbonic
emia. J Appl Physiol 87:1997, 1999.
Dempsey JA, Wagner PD: Exercise-induced arterial hypox-
Transport of Oxygen and Carbon Dioxide in Blood and Tissue Fluids
Chapter 40
513
2000.
significance of carbonic anhydrase in vertebrate gas
hemoglobin-oxygen affi
ing blood-tissue O
2
2003.
Po
2
in muscles of athletic and nonathletic animals at
Vo
2
2
—