, as well as double the output of salt, which is called
few millimeters of mercury can double renal output of water, which is called
if not more so. Indeed, an increase in arterial pressure in the human of only a
vived almost exactly as it functions in the hagfish; in the human being, kidney
Throughout the ages, this primitive mechanism of pressure control has sur-
levels.
cellular fluid volume, blood volume, and pressure all build up again to the higher
fluid than is ingested. Therefore, because the hagfish continues to drink, extra-
the urine and relieves the pressure. At low pressure, the kidney excretes far less
the pressure rises too high, the kidney simply excretes the excess volume into
its blood, increasing the blood volume as well as the pressure. However, when
blood volume. The hagfish continually drinks sea water, which is absorbed into
8 to 14 mm Hg, and this pressure increases almost directly in proportion to its
lowest of vertebrates, the hagfish. This animal has a low arterial pressure, only
system for pressure control is a primitive one. It is fully operative in one of the
In the phylogenetic history of animal development, this renal–body fluid
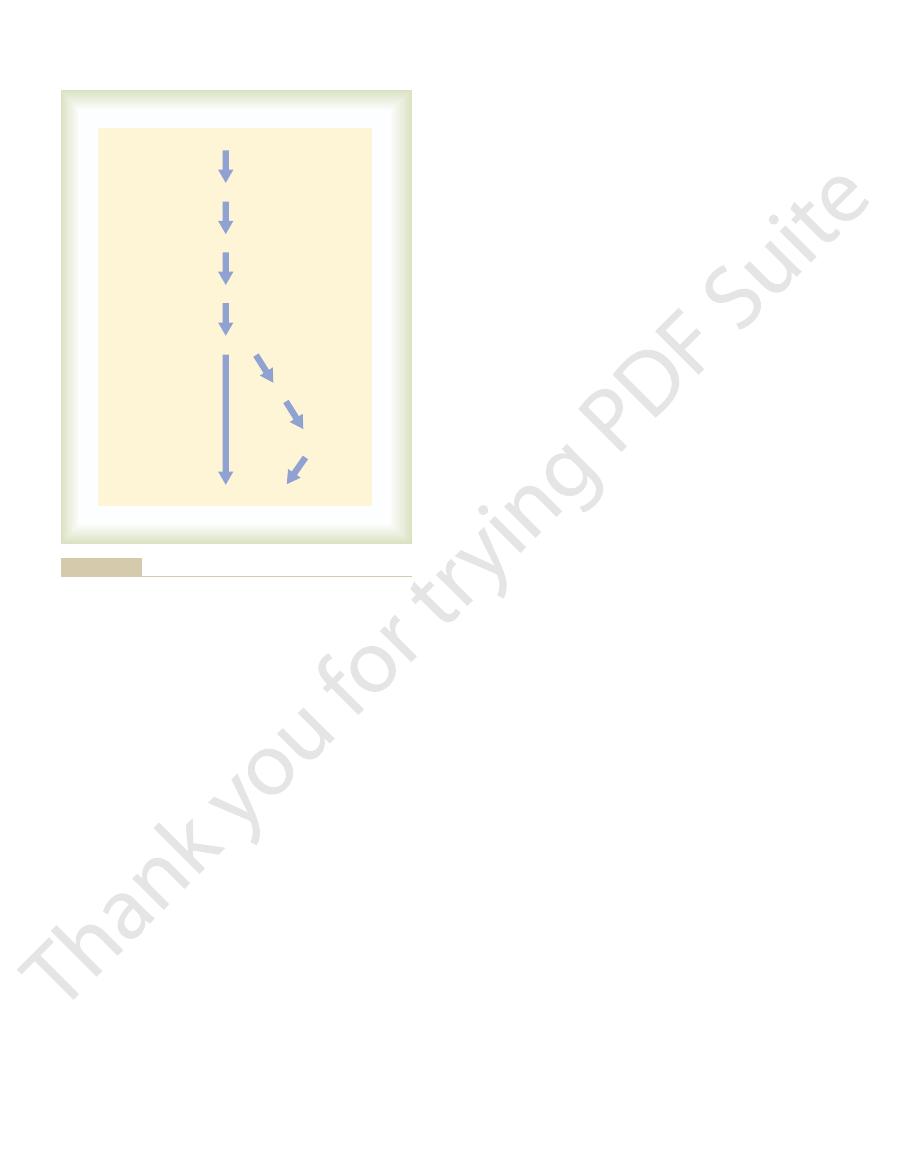
to excrete the excess extracellular fluid, thus returning the pressure back toward
pressure rise. The rising pressure in turn has a direct effect to cause the kidneys
the body contains too much extracellular fluid, the blood volume and arterial
The renal–body fluid system for arterial pressure control is a simple one: When
Pressure Control
Renal–Body Fluid System for Arterial
and water. In this chapter we discuss these renal–body fluid systems that play
anced, a task that is performed by multiple nervous and hormonal controls, and
output. For long-term survival, fluid intake and output must be precisely bal-
volume, which is determined by the balance between the fluid intake and
after week and month after month. This long-term
The body, however, also has powerful mecha-
capacitance, and on cardiac pumping ability.
pathetic nervous system, as discussed in Chapter 18,
Hypertension: The Integrated
in Long-Term Regulation of
C
H
A
P
T
E
R
1
9
216
Dominant Role of the Kidney
Arterial Pressure and in
System for Pressure Control
Short-term control of arterial pressure by the sym-
occurs primarily through the effects of the nervous
system on total peripheral vascular resistance and
nisms for regulating arterial pressure week
control of arterial pressure is closely intertwined with homeostasis of body fluid
by local control systems within the kidneys that regulate their excretion of salt
a dominant role in long-term blood pressure regulation.
normal.
output of water and salt is just as sensitive to pressure changes as in the hagfish,
pressure diuresis
pressure
natriuresis.
graph in Figure 19–3 at which output equals intake is
equal the intake. Furthermore, the only place on the
Over a long period, the water and salt output must
(or line) that represents the net water and salt intake.
curve as that shown in Figure 19–1, and (2) the curve
rising arterial pressure, which is the same renal output
two separate curves that intersect each other: (1) the
the renal–body fluid system. This analysis is based on
Figure 19–3 shows a graphical method that
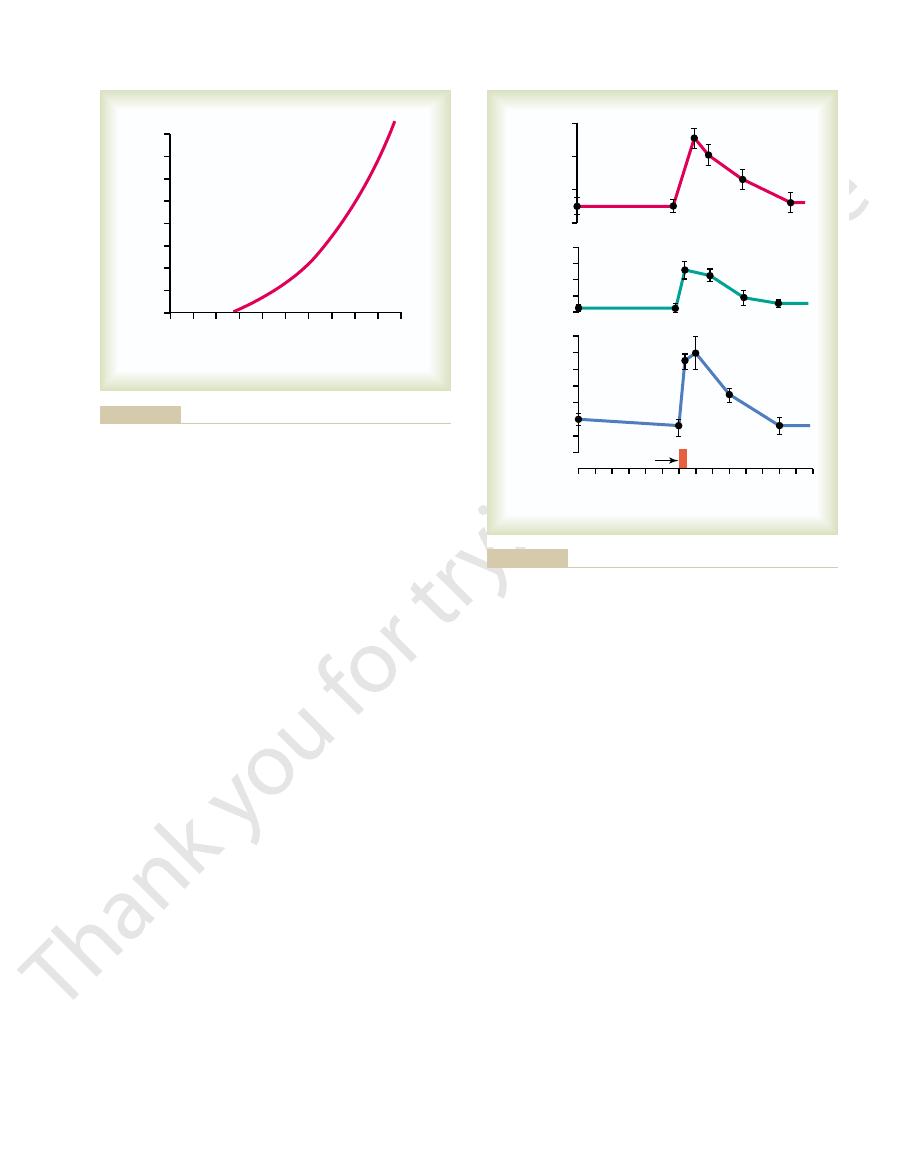
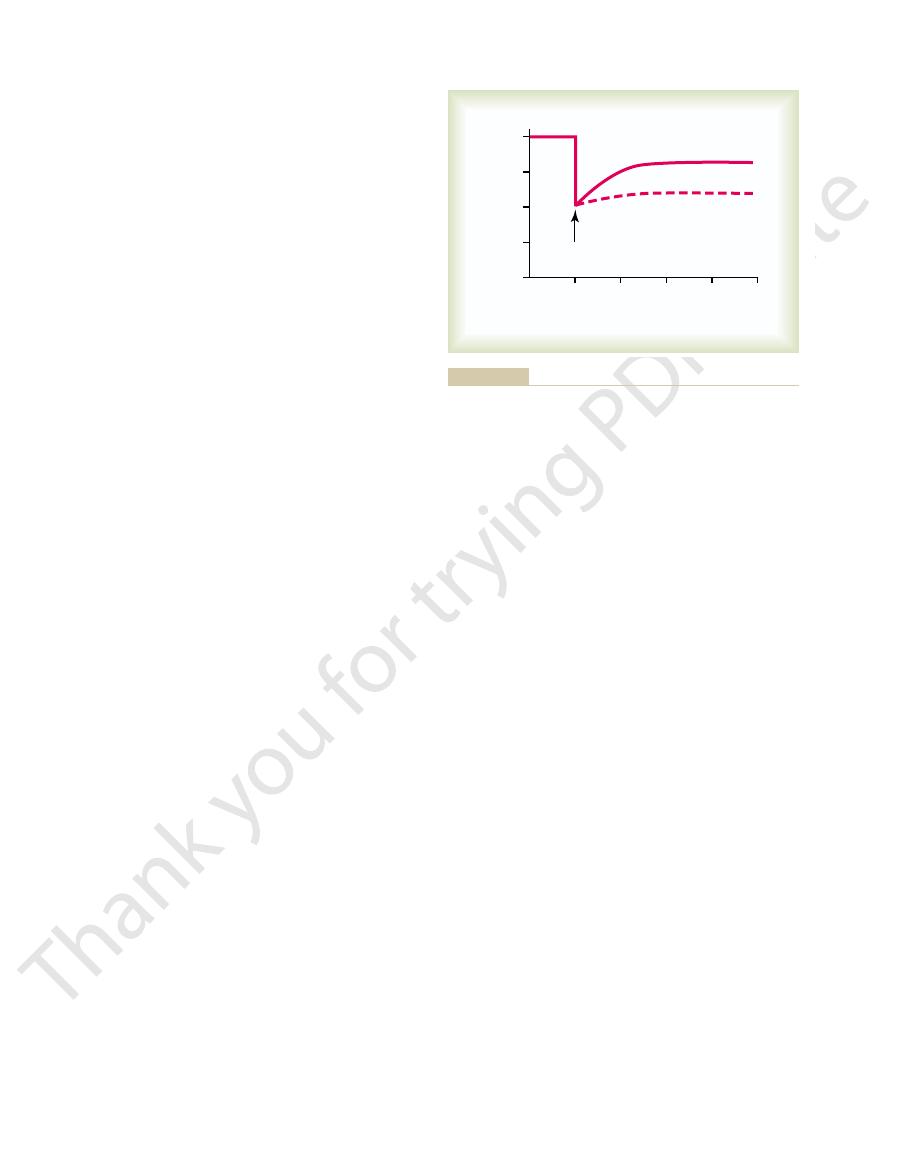
during the subsequent hour. Thus, one sees an extreme
tremendous loss of fluid in the urine, both the cardiac
output, which increased 12-fold. Along with this
above its resting level. Shown by the middle curve is
in mean arterial pressure to 205 mm Hg, 115 mm Hg
blood intravenously. Note the instantaneous increase
were first blocked. Then the arterial pressure was sud-
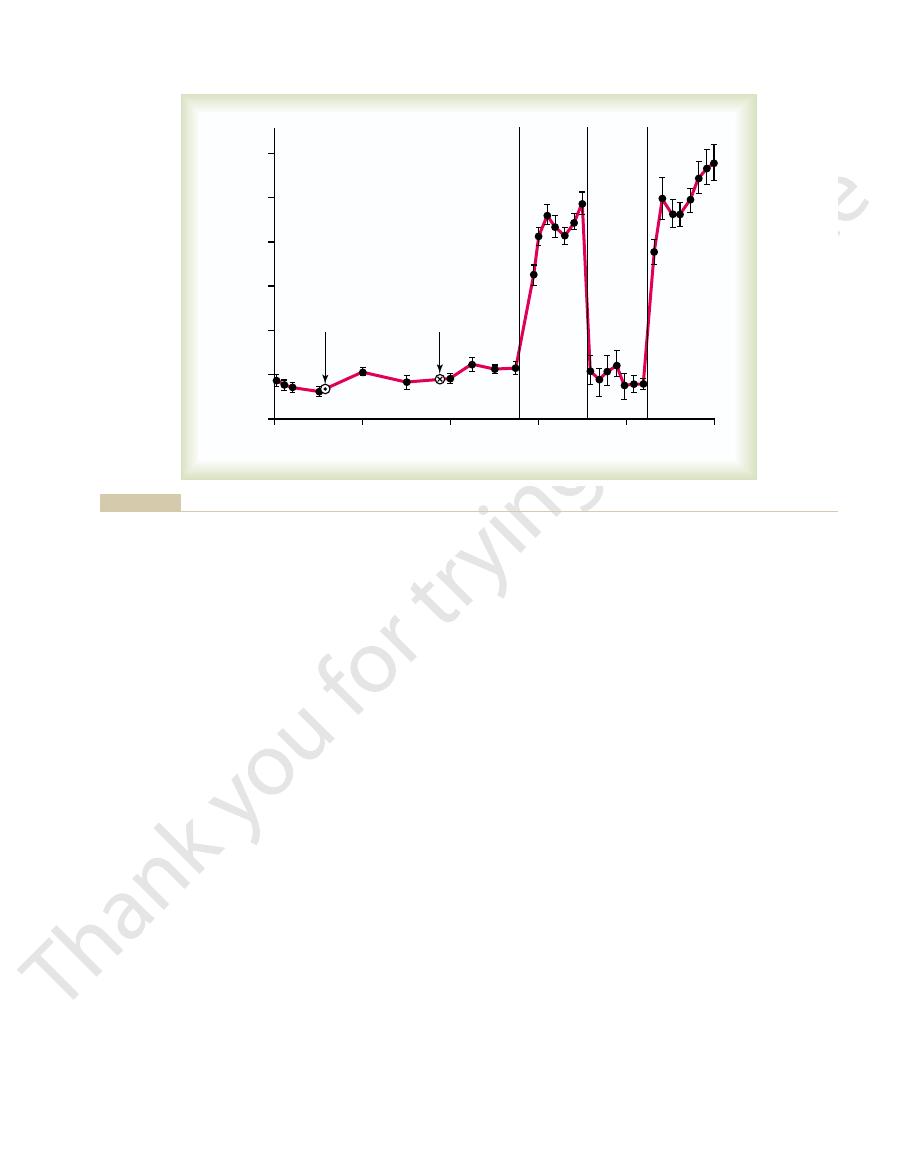
Figure 19–2 shows the results
arterial pressure increase urine volume output, but it
normal. Furthermore, not only does increasing the
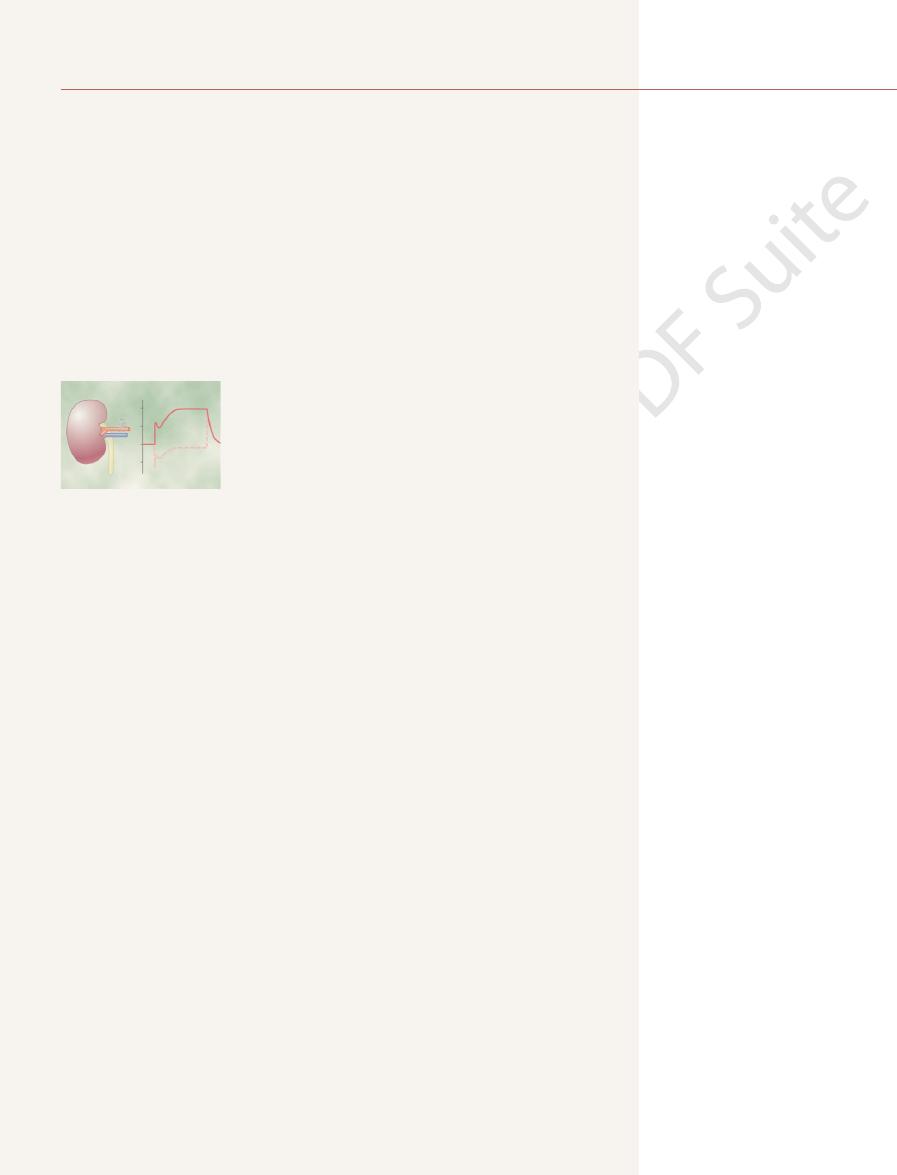
normal, and at 200 mm Hg it is about six to eight times
urine output is essentially zero. At 100 mm Hg it is
human being, at an arterial pressure of 50 mm Hg, the
renal function curve.
urinary output curve
The curve in this figure is called a
sure diuresis.
increased output of volume as the pressure rises. This
output by an isolated kidney, demonstrating markedly
Figure 19–1 shows the approximate average effect of
a Basis for Arterial Pressure Control
Quantitation of Pressure Diuresis as
see, has been addition of the renin-angiotensin
being. An especially important refinement, as we shall
control. However, through the stages of evolution,
arterial pressure control, just as in the hagfish, is the
In the human being, the renal–body fluid system for
Chapter 19
The Integrated System for Pressure Control
217
fundamental basis for long-term arterial pressure
multiple refinements have been added to make this
system much more exact in its control in the human
mechanism.
different arterial pressure levels on urinary volume
increased urinary output is the phenomenon of pres-
renal
or a
In the
causes approximately equal increase in sodium output,
which is the phenomenon of pressure natriuresis.
An Experiment Demonstrating the Renal–Body Fluid System for
Arterial Pressure Control.
of a research experiment in dogs in which all the
nervous reflex mechanisms for blood pressure control
denly elevated by infusing about 400 milliliters of
in cardiac output to about double normal and increase
the effect of this increased arterial pressure on urine
output and the arterial pressure returned to normal
capability of the kidneys to eliminate fluid volume
from the body in response to high arterial pressure and
in so doing to return the arterial pressure back to
normal.
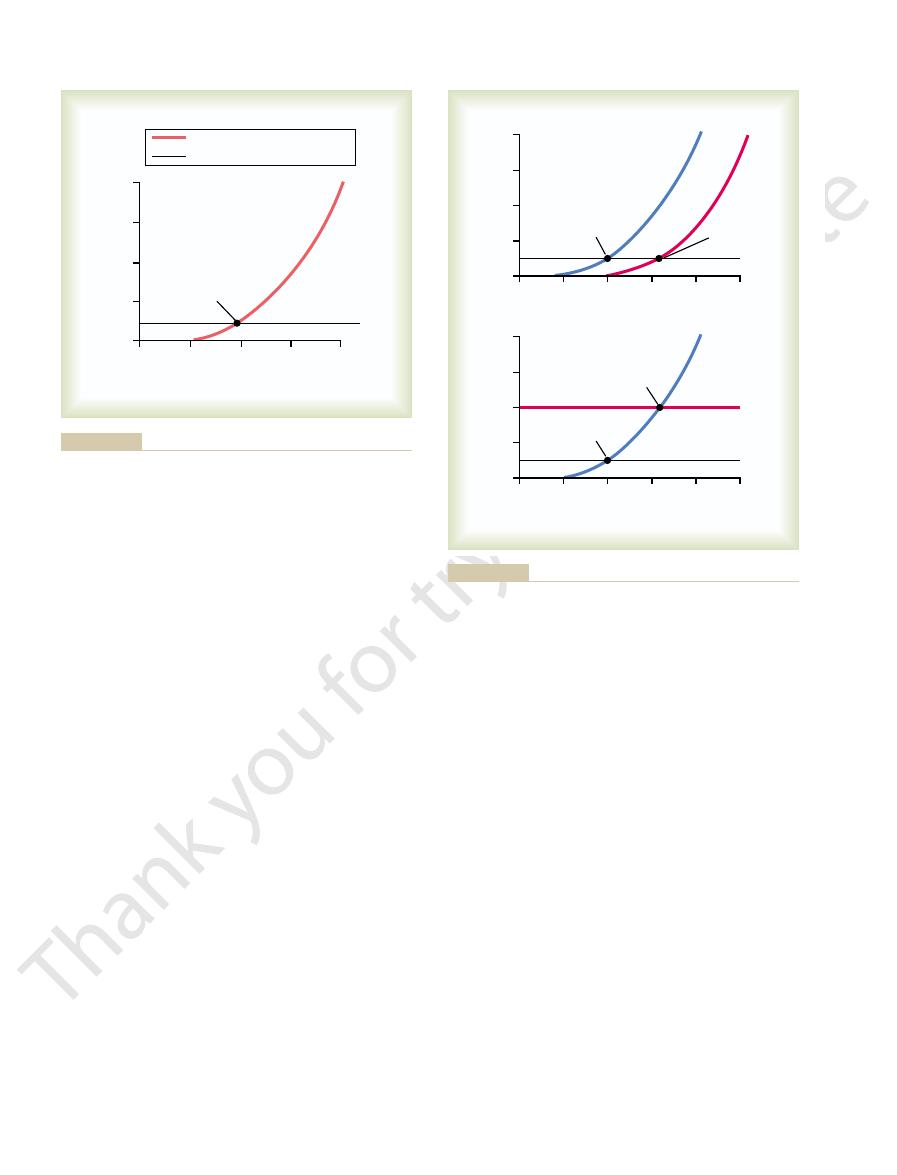
Graphical Analysis of Pressure Control by the Renal–Body Fluid
Mechanism, Demonstrating an “Infinite Feedback Gain”
Feature.
can be used for analyzing arterial pressure control by
renal output curve for water and salt in response to
0
20 40 60 80 100 120 140 160 180 200
Urinary volume output (x normal) 0
8
7
6
5
4
3
2
1
Arterial pressure (mm Hg)
above normal.
kidney, showing pressure diuresis when the arterial pressure rises
Typical renal urinary output curve measured in a perfused isolated
Figure 19–1
0 10 20 30 40 50 60
120
Time (minutes)
Infusion period
50
75
100
125
150
175
200
225
0
1
2
3
4
1000
2000
3000
4000
Cardiac output
(ml/min)
Urinary output
(ml/min)
Arterial pressure
(mm Hg)
loss into the urine. (Courtesy Dr. William Dobbs.)
return of arterial pressure to normal after about an hour of fluid
sure control mechanisms had been blocked. This figure shows
caused by increased blood volume in dogs whose nervous pres-
Increases in cardiac output, urinary output, and arterial pressure
Figure 19–2
output curve shifts to a new pressure level, so will the
than normal. Therefore, one can state that if the renal
equilibrium point has also shifted to 50 mm Hg higher
high-pressure direction (to the right). Note that the
caused the renal output curve to shift 50 mm Hg in the
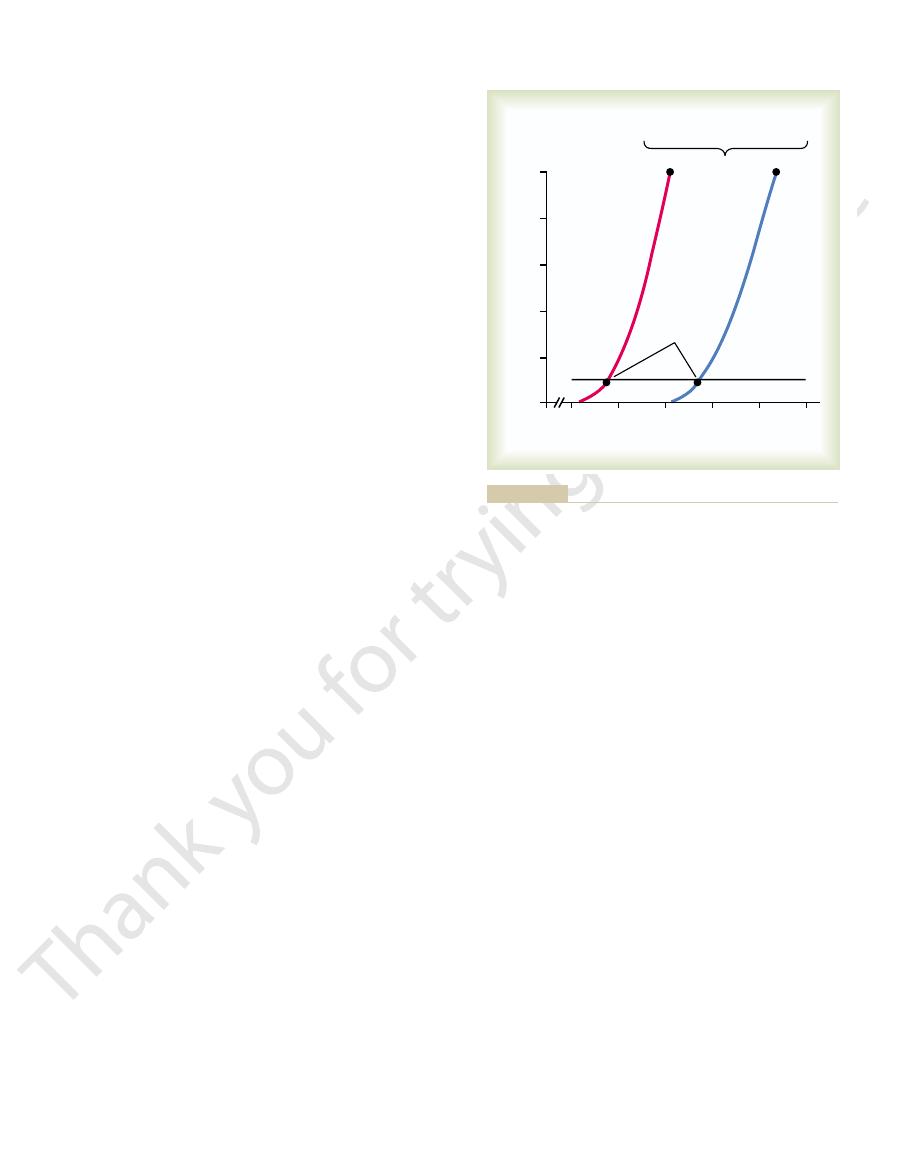
Figure 19–4
of arterial pressure is demonstrated in Figure 19–4. In
2. The level of the water and salt intake line
1. The degree of pressure shift of the renal output
water and salt intake line. Therefore, expressed simply,
water; and the other is by changing the level of the
the 100 mm Hg level. One of these is by shifting the
Furthermore, there are only two ways in which the
level depicted by the equilibrium point of this figure.
readjust exactly to 100 mm Hg, which is the pressure
water remain exactly as they are shown in Figure 19–3,
This can be explained as follows.
Figure 19–3, one can also see that two basic long-term
Two Determinants of the Long-Term Arterial Pressure Level.
infinite feedback
back to the equilibrium point
always exactly
This return of the arterial pressure
volume increases, and the arterial pressure rises until
output. Therefore, body fluid volume increases, blood
point, the intake of water and salt is greater than the
fall that last 1 mm Hg
and salt than intake, so that the pressure continues to
librium level, there still is slightly more loss of water
rial pressure is only 1 mm Hg greater than the equi-
to the equilibrium level. Indeed, even when the arte-
all the way
Furthermore, this “negative balance” of fluid will not
volume decreases, and the arterial pressure decreases.
as the intake. Therefore, the body loses fluid, the blood
150 mm Hg. At this level, the graph shows that renal
First, assume that the arterial pressure rises to
. Now, let us see what happens if the
equilibrium point
where the two curves intersect, which is called the
218
Unit IV
The Circulation
arterial pressure becomes some value that is different
from that at the equilibrium point.
output of water and salt is about three times as great
cease until the pressure falls
back exactly
until the pressure eventually
returns exactly to the equilibrium point.
If the arterial pressure falls below the equilibrium
once again it returns exactly to the equilibrium point.
is the
gain principle for control of arterial pressure by the
renal–body fluid mechanism.
In
factors determine the long-term arterial pressure level.
As long as the two curves representing (1) renal
output of salt and water and (2) intake of salt and
the long-term mean arterial pressure level will always
pressure of this equilibrium point can be changed from
pressure level of the renal output curve for salt and
the two primary determinants of the long-term arte-
rial pressure level are as follows:
curve for water and salt
Operation of these two determinants in the control
A, some abnormality of the kidneys has
0
50
Intake or output (x normal)
Arterial pressure (mm Hg)
100
150
250
0
2
4
6
8
Equilibrium point
Renal output of water and salt
Water and salt intake
similar figures in this chapter.)
is lost from the body through nonrenal routes is ignored in this and
be regulated. (That small portion of the salt and water intake that
rium point describes the level to which the arterial pressure will
output curve” with the “salt and water intake curve.” The equilib-
Analysis of arterial pressure regulation by equating the “renal
Figure 19–3
0
50
100
150
200
250
0
50
100
150
200
250
Intake or output (x normal)
0
2
4
6
8
Arterial pressure (mm Hg)
Normal
Elevated
pressure
0
2
4
6
8
Normal
Elevated
pressure
A
B
and water.
by increasing the intake level of salt
a higher pressure level or
shifting the renal output curve in the right-hand direction toward
Two ways in which the arterial pressure can be increased:
Figure 19–4
A, by
B,
Referring back to Chapter 17, let us recall that
second effect can be explained as follows.
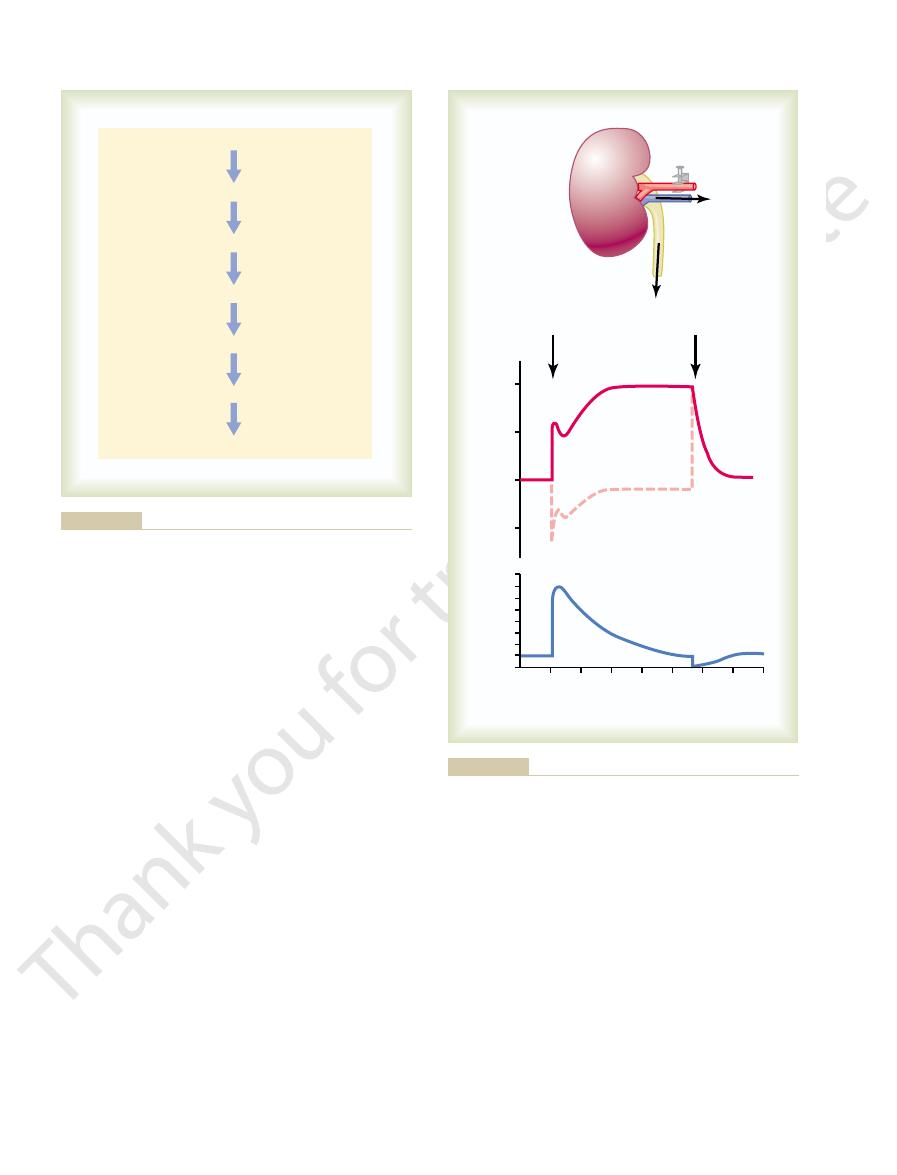
of blood flow. The
cardiac output to increase the pressure, and the other
pressure. One of these is the direct effect of increased
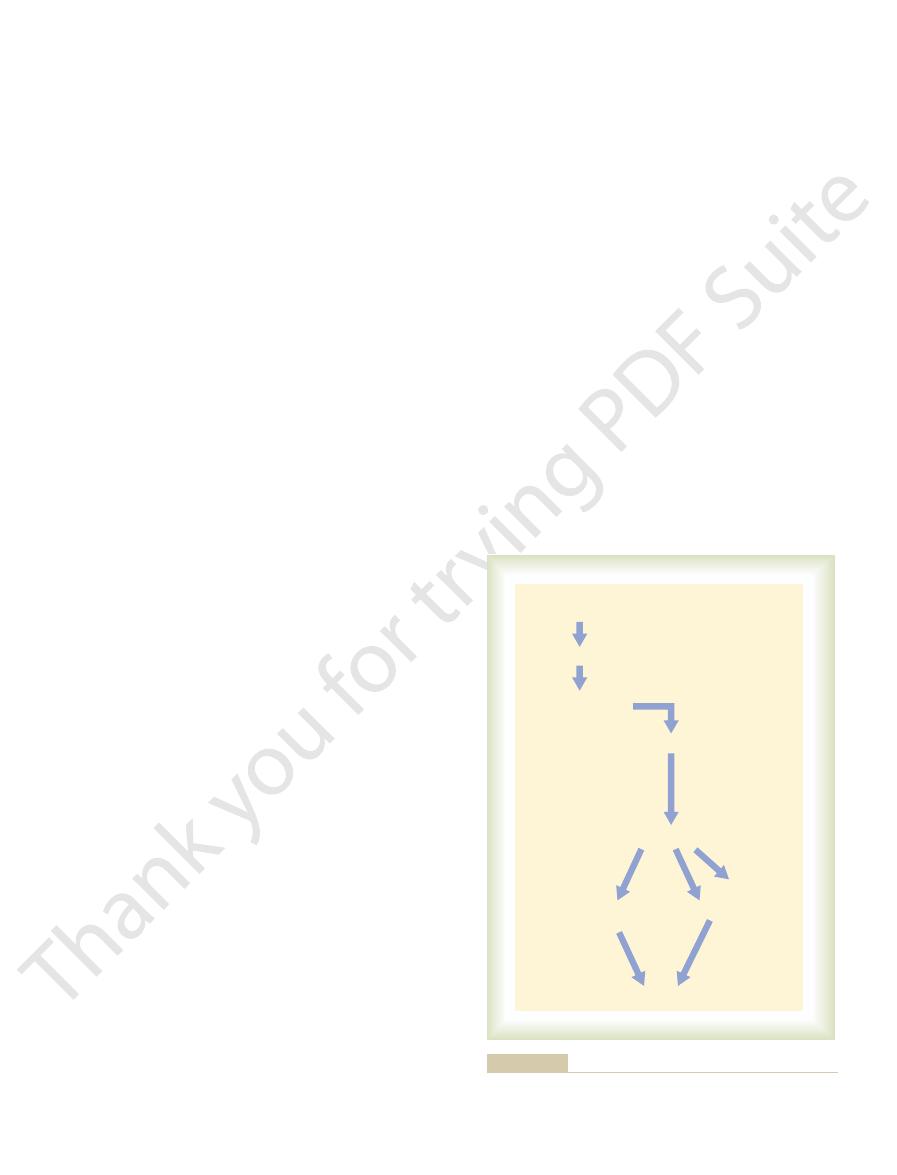
cardiac output, which (6) increases arterial pressure.
return of blood to the heart, which (5) increases
culatory filling pressure, which (4) increases venous
the blood volume, which (3) increases the mean cir-
the schema of Figure 19–6. The sequential events are
The overall mechanism by which increased extracellu-
Total Peripheral Resistance
Pressure by Increasing Cardiac Output or
Increased Fluid Volume Can Elevate Arterial
tor mechanisms. But
We see an example of this later in this chapter
higher pressure level, in the manner shown in Figure
, which
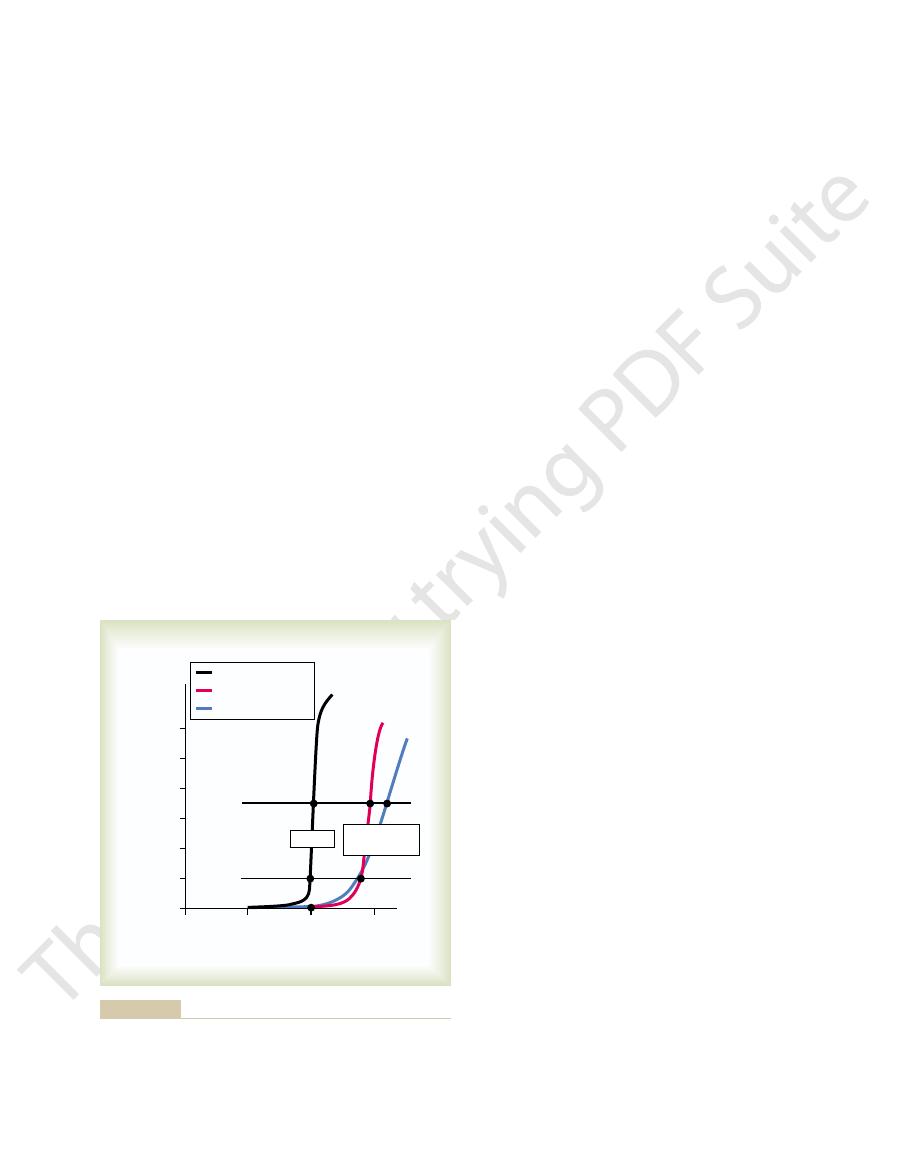
peripheral resistance increases,
salt and water is normal. Note in all these different
or much greater than normal, but kidney excretion of
term total peripheral resistance
normal, carefully study Figure 19–5. This figure shows
water are lost from the body, and this continues until
natriuresis. Within hours, large amounts of salt and
rial pressure, causing pressure diuresis and pressure
kidneys (see again Figures 19–3 and 19–4). Instead, the
The answer to this is the following: Increasing resist-
or so. Why?
pressure usually is not maintained. Instead, the arte-
continue to function normally, the acute rise in arterial
rial pressure does rise immediately. Yet if the kidneys
, the arte-
should elevate the arterial pressure. Indeed,
cardiac output
nism for arterial pressure control. Recalling the basic
of Arterial Pressure if Fluid Intake and Renal
Resistance to Elevate the Long-Term Level
Failure of Increased Total Peripheral
after to be regulated at a new pressure level, at the
these is changed, one finds the arterial pressure there-
curve along the pressure axis. However, if either of
impossible to change the long-term mean
Thus, it is
arterial pressure.
versely, a decrease in the intake level would reduce the
160 mm Hg, 60 mm Hg above the normal level. Con-
In this case, the intake level has increased fourfold and
and water intake also can change the arterial pressure.
Figure 19–4
within a few days.
Chapter 19
The Integrated System for Pressure Control
219
arterial pressure follow to this new pressure level
B shows how a change in the level of salt
the equilibrium point has shifted to a pressure level of
arterial pressure level to a new value without changing
one or both of the two basic determinants of long-term
arterial pressure—either (1) the level of salt and water
intake or (2) the degree of shift of the renal function
pressure level at which the two new curves intersect.
Function Do Not Change
Now is the chance for the reader to see whether he or
she really understands the renal–body fluid mecha-
equation for arterial pressure—arterial pressure equals
times total peripheral resistance—it is
clear that an increase in total peripheral resistance
when the
total peripheral resistance is acutely increased
rial pressure returns all the way to normal within a day
ance in the blood vessels everywhere else in the body
besides in the kidneys does not change the equilibrium
point for blood pressure control as dictated by the
kidneys immediately begin to respond to the high arte-
the arterial pressure returns exactly to the pressure
level of the equilibrium point.
As proof of this principle that changes in total
peripheral resistance do not affect the long-term level
of arterial pressure if function of the kidneys is still
the approximate cardiac outputs and the arterial pres-
sures in different clinical conditions in which the long-
is either much less than
clinical conditions that the arterial pressure is also
exactly normal.
(A word of caution! Many times when the total
this increases the
intrarenal vascular resistance at the same time
alters the function of the kidney and can cause
hypertension by shifting the renal function curve to a
19–4A.
when we discuss hypertension caused by vasoconstric-
it is the increase in renal resistance
that is the culprit, not the increased total peripheral
resistance—an important distinction!)
lar fluid volume elevates arterial pressure is given in
(1) increased extracellular fluid volume (2) increases
Note especially in this schema the two ways in which
an increase in cardiac output can increase the arterial
is an indirect effect to raise total peripheral vascular
resistance through autoregulation
whenever an excess amount of blood flows through a
40
60
80
100
120
140
Arterial pressure and cardiac output
(per cent of normal)
Total peripheral resistance
(per cent of normal)
160
200
0
50
100
150
Beriberi
Anemia
Paget's disease
Pulmonary disease
Normal
Removal of four limbs
Hypothyroidism
AV shunts
Hyperthyroidism
Arterial pressure
output
Cardiac
Guyton AC: Arterial Pressure and Hypertension. Philadelphia: WB
but in all cases had no effect on arterial pressure. (Redrawn from
resistance caused equal and opposite changes in cardiac output
mally. Note that changing the whole-body total peripheral
malities. In these conditions, the kidneys were functioning nor-
arterial pressure and cardiac output in different clinical abnor-
Relations of total peripheral resistance to the long-term levels of
Figure 19–5
Saunders Co, 1980.)
blood vessel in the brain, followed by death of
2. The high pressure frequently damages a major
failure and coronary heart disease, often causing
1. Excess workload on the heart leads to early heart
The lethal effects of hypertension are caused mainly
to shortened life expectancy. At severely high pres-
as 250 mm Hg.
130 mm Hg and
pressure as high as
to 170 mm Hg, with
tension, the
is greater than about 135 mm Hg.) In severe hyper-
greater than about 90 mm Hg and the
is considered to be hypertensive. (This level of
greater than 110 mm Hg (normal is about 90 mm Hg)
accepted normal measure. A
“high blood pressure”), it is meant that his or her
When a person is said to have chronic
Chronic Hypertension (High Blood
can lead to considerable elevation of arterial pressure.
often increase the arterial pressure greatly, accumula-
of the extracellular fluid volume. Because only small
Thus, for these important reasons, the amount of salt
increasing the extracellular fluid volume.
of water from the renal tubular fluid, thereby
28.) The antidiuretic hormone then causes the
. (This is discussed in Chapter
2. The increase in osmolality caused by the excess
extracellular fluid volume.
concentration to normal. This increases the
the osmolality of the fluid increases, and this in
1. When there is excess salt in the extracellular fluid,
body, it also indirectly increases the extracellular fluid
is not excreted so easily. As salt accumulates in the
kidneys almost as rapidly as it is ingested, but salt
pressure than is an increase in water intake.The reason
sure, experimental studies have shown that an increase
Fluid Schema for Arterial Pressure Regulation
Importance of Salt (NaCl) in the Renal–Body
increase in cardiac output is often unmeasurable.
sure of 100 mm Hg up to 150 mm Hg. In fact, the slight
ing the arterial pressure. For instance, only a 5 to 10
, the secondary
cardiac
Finally, because arterial pressure is equal to
the total peripheral resistance.
blood vessels all over the body. This in turn increases
body, so that this autoregulation mechanism constricts
output, the blood flow increases in all tissues of the
When increased blood volume increases the cardiac
simply regulation of blood flow by the tissue itself.
phenomenon is called “autoregulation,” which means
decreases the blood flow back toward normal. This
tissue, the local tissue vasculature constricts and
220
Unit IV
The Circulation
output times total peripheral resistance
increase in total peripheral resistance that results from
the autoregulation mechanism helps greatly in increas-
per cent increase in cardiac output can increase the
arterial pressure from the normal mean arterial pres-
Although the discussions thus far have emphasized the
importance of volume in regulation of arterial pres-
in salt intake is far more likely to elevate the arterial
for this is that pure water is normally excreted by the
volume for two basic reasons:
turn stimulates the thirst center in the brain,
making the person drink extra amounts of
water to return the extracellular salt
salt in the extracellular fluid also stimulates the
hypothalamic-posterior pituitary gland secretory
mechanism to secrete increased quantities of
antidiuretic hormone
kidneys to reabsorb greatly increased quantities
diminishing the excreted volume of urine but
that accumulates in the body is the main determinant
increases in extracellular fluid and blood volume can
tion of even a small amount of extra salt in the body
Pressure) Is Caused by Impaired
Renal Fluid Excretion
hypertension (or
mean
arterial pressure is greater than the upper range of the
mean arterial pressure
mean
pressure occurs when the diastolic blood pressure is
systolic pressure
mean arterial pressure can rise to 150
diastolic
systolic pressure occasionally as high
Even moderate elevation of arterial pressure leads
sures—mean arterial pressures 50 per cent or more
above normal—a person can expect to live no more
than a few more years unless appropriately treated.
in three ways:
death as a result of a heart attack.
Increased extracellular fluid volume
Increased blood volume
Increased mean circulatory filling pressure
Increased venous return of blood to the heart
Increased cardiac output
Autoregulation
Increased total
peripheral resistance
Increased arterial pressure
resistance.
by first increasing the total peripheral
indirect effect
sure and an
to increase arterial pres-
direct effect
cardiac output has both a
increases the arterial pressure. Note especially that increased
Sequential steps by which increased extracellular fluid volume
Figure 19–6
decreased to only 30 per cent of normal. Then, at this
labeled “0” days, the kidney mass had already been
sequential changes. A week or so before the point
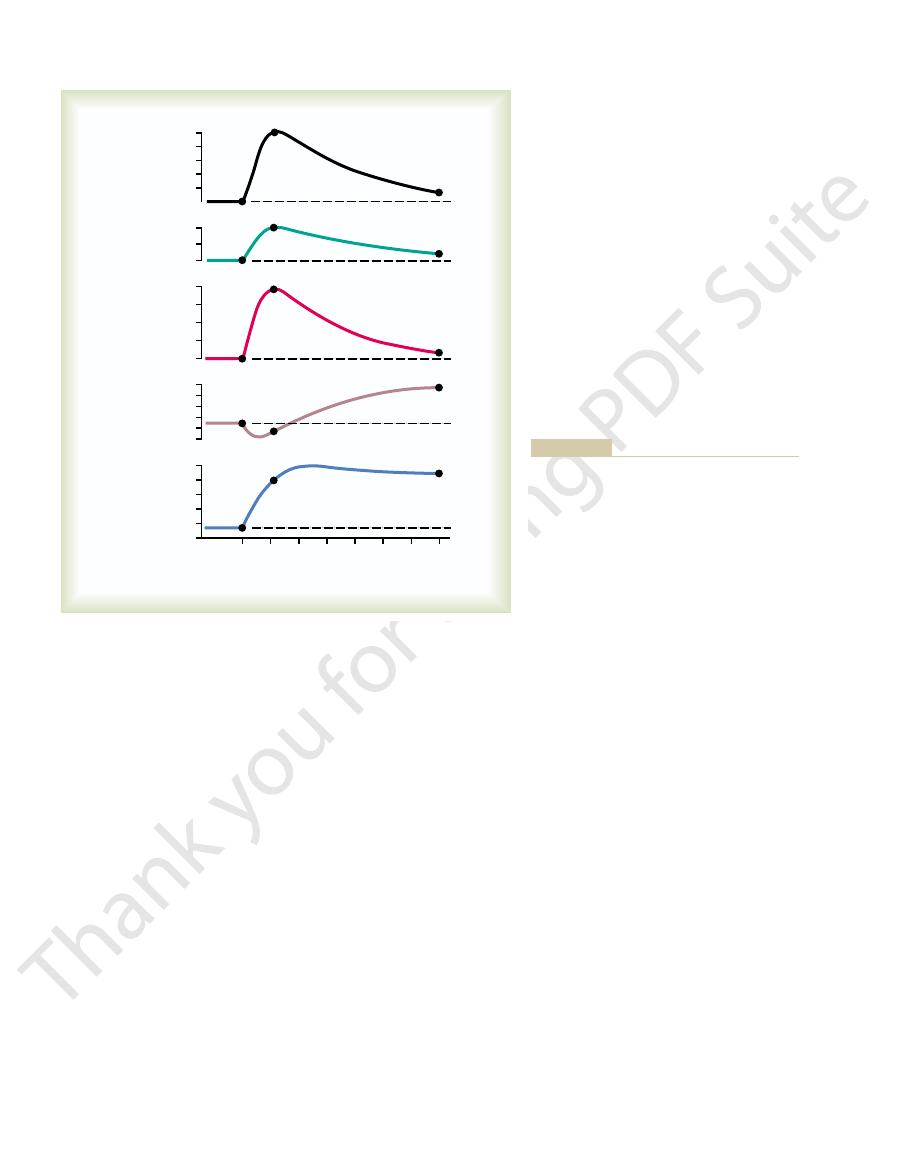
volume-loading hypertension. Figure 19–8 shows these
opment of Volume-Loading Hypertension.
Sequential Changes in Circulatory Function During the Devel-
intake.
salt and water. Therefore, salt and water accumulated
the volume-loading experiment of Figure 19–7. First,
of long-term arterial pressure regulation, he or she can
fore drank much more. Thus, this experiment demon-
again, and this time the pressure rose much more
the experiment, the dogs were given salt solution
returned to normal within 2 days. Finally, at the end of
water again instead of salt solution; the pressure
above normal. After 2 weeks, the dogs were given tap
their average arterial pressure rose to about 40 mm Hg
normal amounts of volume, and within a few days,
quench the thirst, the dogs drank two to four times the
drink instead of water. Because
mm Hg. Then, the dogs were given salt solution to
animals with only 30 per cent of normal renal mass.
the entire opposite kidney was removed, leaving the
kidneys were removed, and at the second circled point,
circled point on the curve, the two poles of one of the
70 per cent of their kidney mass removed. At the first
Figure 19–7 shows a typical experiment demonstrating
Experimental Volume-Loading Hypertension Caused by Reduced
fluid in the body, some examples of which follow.
tion. Volume-loading hypertension means hyperten-
called “volume-loading hypertension” have been
destruction and, eventually, kidney failure, uremia,
the kidneys, producing many areas of renal
3. High pressure almost always causes injury in
multiple other serious brain disorders.
can cause paralysis, dementia, blindness, or
on which part of the brain is involved, a stroke
. Clinically it is called a “stroke.” Depending
major portions of the brain; this is a
Chapter 19
The Integrated System for Pressure Control
221
cerebral
infarct
and death.
Lessons learned from the type of hypertension
crucial in understanding the role of the renal–body
fluid volume mechanism for arterial pressure regula-
sion caused by excess accumulation of extracellular
Renal Mass Along with Simultaneous Increase in Salt Intake.
volume-loading hypertension in a group of dogs with
Note that removal of this amount of kidney mass
increased the arterial pressure an average of only 6
salt solution fails to
rapidly to an even higher level because the dogs had
already learned to tolerate the salt solution and there-
strates volume-loading hypertension.
If the reader considers again the basic determinants
immediately understand why hypertension occurred in
reduction of the kidney mass to 30 per cent of normal
greatly reduced the ability of the kidneys to excrete
in the body and in a few days raised the arterial pres-
sure high enough to excrete the excess salt and water
It is especially
instructive to study the sequential changes in circula-
tory function during progressive development of
0.9% NaCl
0.9% NaCl
35–45
0
20
40
60
80
100
Mean arterial pressure
(per cent of control)
Days
0
100
110
120
130
140
150
% of left
kidney removed
Tap water
Entire right
kidney removed
American Heart Association, Inc.)
renal tissue removed. (Redrawn from Langston JB, Guyton AC, Douglas BH, Dorsett PE: Circ Res 12:508, 1963. By permission of the
Average effect on arterial pressure of drinking 0.9 per cent saline solution instead of water in four dogs with 70 per cent of
Figure 19–7
their
volume, blood volume, and cardiac output back to
3. Almost complete return of the extracellular fluid
2. Marked increase in total peripheral resistance
1. Hypertension
loading. We find the following effects:
Last, let us take stock of the final state of the circu-
body.
back into the blood. Second, the elevated arterial
olar resistance decreased the capillary pressure, which
resulted from two factors: First, the increase in arteri-
normal along with the decrease in cardiac output. This
Note, too, that the extracellular fluid volume and
almost all the way back to normal, while simultane-
local arterioles, thus returning the local blood flows
ated the hypertension, the excess blood flow through
Chapter 17 and earlier in this chapter. That is, after the
the long-term blood flow autoreg-
output decreased almost all the way back to normal
the cardiac
, while at the same time
changes occurred during the next few weeks. Espe-
variables had occurred, more prolonged secondary
of the increase in cardiac output, even though the total
to prevent the rise in pressure. At this time, the arte-
the rise in pressure. However, after 2 to 4 days, the
nism discussed in Chapter 18, which tried to prevent
This decrease was caused by the baroreceptor mecha-
in total peripheral resistance.
by studying the total peripheral resistance curve, which
at first as did the fluid volumes and cardiac output. The
20 to 40 per cent above normal. Simultaneously, the
lar fluid volume, blood volume, and cardiac output to
thereafter. The acute effect was to increase extracellu-
point, the intake of salt and water was increased to
222
Unit IV
The Circulation
about six times normal and kept at this high intake
arterial pressure began to rise but not nearly so much
reason for this slower rise in pressure can be discerned
shows an initial decrease
baroreceptors adapted (reset) and were no longer able
rial pressure had risen almost to its full height because
peripheral resistance was still almost at the normal
level.
After these early acute changes in the circulatory
cially important was a progressive increase in total
peripheral resistance
,
mainly as a result of
ulation mechanism that is discussed in detail in
cardiac output had risen to a high level and had initi-
the tissues then caused progressive constriction of the
in all the body tissues and also the cardiac output
ously causing a secondary increase in total peripheral
resistance.
blood volume returned almost all the way back to
allowed the fluid in the tissue spaces to be absorbed
pressure now caused the kidneys to excrete the excess
volume of fluid that had initially accumulated in the
lation several weeks after the initial onset of volume
normal
0
2
4
6
8
10
12
14
Days
0
110
120
130
140
150
18
20
22
24
26
28
5.0
5.5
6.0
6.5
7.0
5.0
5.5
6.0
15
16
17
18
19
20
33%
20%
40%
–13%
30%
40%
33%
5%
4%
5%
Extracellular
fluid volume
(liters)
Blood
volume
(liters)
Cardiac output
(L/min)
Total
peripheral
resistance
(mm Hg/L/min)
Arterial
pressure
(mm Hg)
Hypertension. Philadelphia: WB Saunders Co,
(Modified from Guyton AC: Arterial Pressure and
secondary increase in total peripheral resistance.
almost to normal while simultaneously causing a
regulation mechanism returns the cardiac output
cause of the hypertension. Subsequently, the auto-
initial increase in cardiac output as the basic
volume-loading hypertension.
Progressive changes in important circulatory
Figure 19–8
system variables during the first few weeks of
Note especially the
1980.)
of the kidneys. The JG cells are modified smooth
pressure.
Figure 19–9 shows the functional steps by which the
Components of the Renin-Angiotensin
helping to correct the initial fall in pressure.
raises the arterial pressure in several ways, thus
when the arterial pressure falls too low. In turn, it
mechanism for controlling pressure. It is the renin-
fluid volume, the kidneys also have another powerful
Control and in Hypertension
System: Its Role in Pressure
secondarily elevated, as explained earlier in the
stages, the cardiac output generally returns almost to
tension, the cardiac output is increased, but in later
Here again, in the early stages of this type of hyper-
severe.
fore, the hypertension often finally becomes lethally
tion to that caused directly by the aldosterone. There-
months or years, the excess arterial pressure often
even greater. Furthermore, if the condition persists for
increased at the same time, the hypertension becomes
quently, hypertension occurs. And, if salt intake is
blood volume and extracellular fluid volume. Conse-
kidneys, thereby reducing the loss of these in the
cussed in Chapter 29, aldosterone increases the rate of
the condition called “primary aldosteronism.” As dis-
secretes large quantities of aldosterone, which is
sionally, by excesses of other types of steroids. A small
caused by excess aldosterone in the body or, occa-
Primary Aldosteronism
Hypertension Caused by
the end, the hypertension is a high peripheral resist-
increase in total peripheral resistance. Therefore, in
output increases at first and causes hypertension. Then
same way as shown in Figure 19–8. That is, the cardiac
extracellular fluid volume is allowed to increase,
each time the patient is dialyzed. If this is not done and
volume at a normal level—that is, it is important
is especially important to keep the patient’s body fluid
When a patient is maintained on an artificial kidney, it
Maintained on an Artificial Kidney
Who Have No Kidneys but Are Being
Volume-Loading Hypertension in Patients
tension has developed and, therefore, is secondary to
Thus, the increased total peripheral resistance in
the hypertension. The second stage in volume-loading
cardiac output. This increase in cardiac output causes
sion into two separate sequential stages: The first stage
Therefore, we can divide volume-loading hyperten-
Chapter 19
The Integrated System for Pressure Control
223
results from increased fluid volume causing increased
hypertension is characterized by high blood pressure
and high total peripheral resistance but return of the
cardiac output so near to normal that the usual meas-
uring techniques frequently cannot detect an abnor-
mally elevated cardiac output.
volume-loading hypertension occurs after the hyper-
the hypertension rather than being the cause of the
hypertension.
to remove an appropriate amount of water and salt
hypertension almost invariably develops in exactly the
the autoregulation mechanism returns the cardiac
output back toward normal while causing a secondary
ance type of hypertension.
Another type of volume-loading hypertension is
tumor in one of the adrenal glands occasionally
reabsorption of salt and water by the tubules of the
urine while at the same time causing an increase in
causes pathological changes in the kidneys that make
the kidneys retain even more salt and water in addi-
normal while the total peripheral resistance becomes
chapter for primary volume-loading hypertension.
The Renin-Angiotensin
Aside from the capability of the kidneys to control
arterial pressure through changes in extracellular
angiotensin system.
Renin is a protein enzyme released by the kidneys
System
renin-angiotensin system helps to regulate arterial
Renin is synthesized and stored in an inactive form
called prorenin in the juxtaglomerular cells (JG cells)
muscle cells located in the walls of the afferent
Decreased
arterial pressure
Renin (kidney)
Angiotensin I
Angiotensin II
Renin substrate
(angiotensinogen)
Angiotensinase
(Inactivated)
Vasoconstriction
Increased arterial pressure
Renal retention
of salt and water
Converting
enzyme
(lung)
sure control.
Renin-angiotensin vasoconstrictor mechanism for arterial pres-
Figure 19–9
culate in the blood, the entire long-term renal–body
Thus, whenever excess amounts of angiotensin cir-
salt and water reabsorption by the kidney tubules.
aldosterone, and the aldosterone in turn increases
2. Angiotensin causes the adrenal glands to secrete
1. Angiotensin acts directly on the kidneys to cause
Long-Term Control of Arterial Pressure
An Especially Important Means for
Cause Renal Retention of Salt and Water—
Effect of Angiotensin in the Kidneys to
fully active. Therefore, it is somewhat slower to act
can be of lifesaving service to the body, especially in
after severe hemorrhage. Therefore, sometimes it
blocked. This shows that the renin-angiotensin system
60 mm Hg when the renin-angiotensin system was
system was functional. Conversely, it rose to only
back to 83 mm Hg when the renin-angiotensin
pressure to 50 mm Hg—the arterial pressure rose
by a renin-blocking antibody). Note that after hemor-
pressure under two separate conditions: (1) with the
Figure 19–10 shows a typical experiment demon-
Vasoconstrictor Pressure Response to
nism in eventually raising the arterial pressure.
the extracellular fluid volume mechanism, is even
hours and days. This long-term effect, acting through
increases the extracellular fluid volume, which then
This slowly
The second principal means by which angiotensin
increasing pressure.
heart, thereby helping the heart pump against the
in Figure 19–9. Also, the mild constriction of the veins
pressure, as demonstrated at the bottom of the schema
total peripheral resistance, thereby raising the arterial
the veins. Constriction of the arterioles increases the
, occurs rapidly. Vasoconstriction
pressure. The first of these,
During its persistence in the blood, angiotensin
ways as well. However, it persists in the blood only
strictor, and it also affects circulatory function in other
endothelium of the lung vessels.
small vessels of the lungs, catalyzed by an enzyme
. This conversion occurs almost
angiotensin I, two additional amino acids are split
Within a few seconds to minutes after formation of
more angiotensin I during this entire time.
function. The renin persists in the blood for 30 minutes
to release a 10-amino acid peptide,
stance. As shown in the schema of Figure 19–9,
Renin itself is an enzyme, not a vasoactive sub-
functions.
However, small amounts of the renin do remain in the
of the kidneys to circulate throughout the entire body.
. Most of
the arterial pressure falls, intrinsic reactions in the
. When
arterioles immediately proximal to the glomeruli
224
Unit IV
The Circulation
kidneys themselves cause many of the prorenin mole-
cules in the JG cells to split and release renin
the renin enters the renal blood and then passes out
local fluids of the kidney and initiate several intrarenal
renin acts enzymatically on another plasma protein,
a globulin called renin substrate (or angiotensinogen),
angiotensin I.
Angiotensin I has mild vasoconstrictor properties but
not enough to cause significant changes in circulatory
to 1 hour and continues to cause formation of still
from the angiotensin I to form the 8-amino acid
peptide angiotensin II
entirely in the lungs while the blood flows through the
called converting enzyme that is present in the
Angiotensin II is an extremely powerful vasocon-
for 1 or 2 minutes because it is rapidly inactivated by
multiple blood and tissue enzymes collectively called
angiotensinases.
II has two principal effects that can elevate arterial
vasoconstriction in many
areas of the body
occurs intensely in the arterioles and much less so in
promotes increased venous return of blood to the
increases the arterial pressure is to decrease excretion
of both salt and water by the kidneys.
increases the arterial pressure during subsequent
more powerful than the acute vasoconstrictor mecha-
Rapidity and Intensity of the
the Renin-Angiotensin System
strating the effect of hemorrhage on the arterial
renin-angiotensin system functioning and (2) without
the system functioning (the system was interrupted
rhage—enough to cause acute decrease of the arterial
is powerful enough to return the arterial pressure at
least halfway back to normal within a few minutes
circulatory shock.
Note also that the renin-angiotensin vasocon-
strictor system requires about 20 minutes to become
for pressure control than are the nervous reflexes
and the sympathetic norepinephrine-epinephrine
system.
Angiotensin causes the kidneys to retain both salt and
water in two major ways:
salt and water retention.
fluid mechanism for arterial pressure control auto-
matically becomes set to a higher arterial pressure
level than normal.
Hemorrhage
0
10
20
30
40
Arterial pressure (mm Hg)
0
25
50
75
100
Minutes
With
renin-angiotensin system
Without
renin-angiotensin system
by Dr. Royce Brough.)
strictor system after severe hemorrhage. (Drawn from experiments
Pressure-compensating effect of the renin-angiotensin vasocon-
Figure 19–10
system functions normally, the pressure rises no more
system in controlling arterial pressure, when the
To emphasize the efficacy of the renin-angiotensin
normal, exactly opposite effects take place.
increased. Or, when salt intake is decreased below
the arterial pressure also almost to normal. Thus, the
fluid volume almost to normal, and, finally, return of
retention of salt and water, return of the extracellular
sure causes increased blood flow through the kidneys,
the arterial pressure. Then, the increased arterial pres-
by the schema in Figure 19–12, which shows that the
volume or arterial pressure. This function is explained
Despite Wide Variations in Salt Intake
Maintaining a Normal Arterial Pressure
tion of the arterial pressure.
pressure level of 115 mm Hg. Therefore, the effect of
Hg, and one for elevated angiotensin showing a
angiotensin showing an arterial pressure level of 75 mm
Finally, note the two equilibrium points, one for zero
aldosterone secretion, as explained above.
sure levels under the influence of angiotensin II. This
normal rate of angiotensin formation in the blood. Note
to angiotensin II, the active form of angiotensin). The
line depicting normal level of sodium intake. The left-
This figure shows two renal output curves as well as a
Figure 19–11 shows a quantitative analysis
However, research in our own laboratory has sug-
Thus both the direct effect of angiotensin on the
pressure.
causes water retention, as already explained, increas-
extracellular fluid sodium. This increased sodium then
the kidney tubules, thus increasing the total body
the renin-angiotensin system becomes activated, the
adrenal gland function in Chapter 77. Therefore, when
adrenal glands, as we shall discuss in relation to body
Effect of Aldosterone in Increasing Salt and Water Retention
water. The total result of all these effects is significant,
tubules. And still a third effect is that angiotensin has
reduces the pressure in the peritubular capillaries,
glomeruli into the tubules. Also, the slow flow of blood
the kidneys. As a result, less fluid filters through the
arterioles, thereby diminishing blood flow through
and water. One major effect is to constrict the renal
Renal Retention of Salt and Water.
Chapter 19
The Integrated System for Pressure Control
225
Mechanisms of the Direct Renal Effects of Angiotensin to Cause
Angiotensin has several
direct renal effects that make the kidneys retain salt
which causes rapid reabsorption of fluid from the
important direct actions on the tubular cells them-
selves to increase tubular reabsorption of sodium and
sometimes decreasing urine output less than one fifth
of normal.
Stimulation of Aldosterone Secretion by Angiotensin, and the
by the Kidneys.
Angiotensin is also one of the most
powerful stimulators of aldosterone secretion by the
fluid regulation in Chapter 29 and in relation to
rate of aldosterone secretion usually also increases;
and an important subsequent function of aldosterone
is to cause marked increase in sodium reabsorption by
ing the extracellular fluid volume and leading second-
arily to still more long-term elevation of the arterial
kidney and its effect acting through aldosterone are
important in long-term arterial pressure control.
gested that the direct effect of angiotensin on the
kidneys is perhaps three or more times as potent as the
indirect effect acting through aldosterone—even
though the indirect effect is the one most widely
known.
Quantitative Analysis of Arterial Pressure Changes Caused by
Angiotensin.
of the effect of angiotensin in arterial pressure control.
hand renal output curve is that measured in dogs whose
renin-angiotensin system had been blocked by the drug
captopril (which blocks the conversion of angiotensin I
right-hand curve was measured in dogs infused contin-
uously with angiotensin II at a level about 2.5 times the
the shift of the renal output curve toward higher pres-
shift is caused by both the direct effects of angiotensin
on the kidney and the indirect effect acting through
angiotensin to cause renal retention of salt and water
can have a powerful effect in promoting chronic eleva-
Role of the Renin-Angiotensin System in
One of the most important functions of the renin-
angiotensin system is to allow a person to eat either
very small or very large amounts of salt without
causing great changes in either extracellular fluid
initial effect of increased salt intake is to elevate the
extracellular fluid volume and this in turn to elevate
which reduces the rate of secretion of renin to a much
lower level and leads sequentially to decreased renal
renin-angiotensin system is an automatic feedback
mechanism that helps maintain the arterial pressure at
or near the normal level even when salt intake is
Normal
Intake
0
2.5
0
60
80
100
120
140
160
Sodium intake and output (times normal) 0
2
4
6
8
10
Arterial pressure (mm Hg)
Angiotensin levels in the blood
(times normal)
Equilibrium
points
115 mm Hg when the angiotensin II level is high.
point of 75 mm Hg when the angiotensin II level is low and at
curve, showing regulation of the arterial pressure at an equilibrium
Effect of two angiotensin II levels in the blood on the renal output
Figure 19–11
usually rises rapidly for the first hour or so, and this is
and continues to rise for several days. The pressure
or minutes, the systemic arterial pressure begins to rise
by the dashed curve in the figure. Then, within seconds
renal artery beyond the constrictor, as demonstrated
of the remaining kidney, as shown in Figure 19–13, the
When one kidney is
continuation of the elevated pressure.
over a period of days, this, too, causes hypertension
2. By causing the kidneys to retain salt and water;
resistance and arterial pressure; this effect occurs
body, thereby increasing the total peripheral
1. By constricting the arterioles throughout the entire
We have already noted that angiotensin can increase
develops.
animals,
similar severe long-term hypertension
developed. Also, when large amounts of angiotensin
in whom this has occurred, severe hypertension has
quantities of angiotensin II are formed. In all patients
tremendous quantities of renin; in turn, equally large
the JG cells
or by Infusion of Angiotensin II
Caused by a Renin-Secreting Tumor
Angiotensin Is Involved: Hypertension
Types of Hypertension in Which
the normal increase, often as much as 50 to 60 mm Hg.
angiotensin system is blocked, the same increase in salt
increase in salt intake. Conversely, when the renin-
than 4 to 6 mm Hg in response to as much as a 50-fold
226
Unit IV
The Circulation
intake sometimes causes the pressure to rise 10 times
Occasionally a tumor of the renin-secreting juxta-
glomerular cells (
) occurs and secretes
are infused continuously for days or weeks into
the arterial pressure in two ways:
within seconds after one begins to infuse
angiotensin.
and is the principal cause of the long-term
“One-Kidney” Goldblatt Hypertension.
removed and a constrictor is placed on the renal artery
immediate effect is greatly reduced pressure in the
Increased salt intake
Increased extracellular volume
Increased arterial pressure
Decreased renin and angiotensin
Decreased renal retention of salt and water
Return of extracellular volume almost to normal
Return of arterial pressure almost to normal
normal level.
angiotensin system returns the arterial pressure almost to the
arterial pressure, but feedback decrease in activity of the renin
Sequential events by which increased salt intake increases the
Figure 19–12
Renal artery constricted
Constriction released
0
4
8
12
Pressure (mm Hg)
Times normal
Days
0
1
7
50
100
150
200
Renin secretion
Systemic arterial
pressure
Distal renal arterial
pressure
sion is called “one-kidney” Goldblatt hypertension.
to the clamp, and rate of renin secretion. The resulting hyperten-
changes in systemic arterial pressure, renal artery pressure distal
kidney after the other kidney has been removed. Note the
Effect of placing a constricting clamp on the renal artery of one
Figure 19–13

are not completely understood, ischemia of the placenta
the baby. Although the precise causes of preeclampsia
toxemia of
imately 5 to 10 per cent of expectant mothers develop
Hypertension in Preeclampsia (Toxemia of Pregnancy).
term autoregulation process can be.
tissue and not in accord with the level of the pressure.
and the low-pressure area, the local blood flow is con-
sure. The result is that, in both the high-pressure area
the blood vessels. The only reasonable answer is that
the circulation similarly, so that there is no reason to
Likewise, the nervous system innervates both areas of
lower body, because the same blood flows to both areas.
body? The answer is not that there are differences in
normal. How could this be, with the pressure in the
legs, where the pressure is not elevated, is almost exactly
normal, is almost exactly normal. Also, blood flow in the
where the pressure may be 40 to 60 per cent above
by aortic coarctation is that blood flow in the arms,
normal, whereas the pressure in the upper body is far
return to normal. Likewise, in coarctation of the aorta,
kidneys are no longer ischemic, so that secretion of
but high pressure persists in the upper body. The
upper body. The arterial pressure in the lower body at
aldosterone are formed, and hypertension occurs in the
kidneys at first falls, renin is secreted, angiotensin and
above the renal arteries, the blood pressure in both
tension. That is, when a constrictor is placed on the aorta
The mechanism of this upper-body hypertension is
than that in the lower body.
the lower aorta. As a consequence, the arterial pressure
tiple, small collateral arteries in the body wall, with
occurs, blood flow to the lower body is carried by mul-
When this
the head and arms but proximal to the renal arteries,
Loading and Vasoconstriction
Caused by Combinations of Volume
Other Types of Hypertension
kidney disease.
especially in older persons, is such patchy ischemic
kidney mass also to retain salt and water. Indeed, one
the formation of angiotensin II, causes the remaining
tissue secretes renin, and this in turn, acting through
hypertension. That is, the patchy ischemic kidney
kidneys are normal. When this occurs, almost identical
vascular constrictions, whereas other areas of the
Often, patchy areas of one or both kidneys
Chronically.
sequently, hypertension develops.
ferent reasons, become salt and water retainers. Con-
to retain salt and water. Thus, both kidneys, but for dif-
produced by the ischemic kidney. This renin causes
rial pressure in this kidney. Then the “normal” oppo-
nism: The constricted kidney secretes renin and also
This hypertension results from the following mecha-
“Two-Kidney” Goldblatt Hypertension.
constriction of the renal artery. That is, the aortic pres-
new sustained level. The quantitative value of this sus-
terone). In 5 to 7 days, the body fluid volume will have
The second rise in arterial pressure is caused by
normal, so that the kidney is no longer ischemic.
turn raises the arterial pressure acutely. The secretion
II and aldosterone in the blood. The angiotensin in
Figure 19–13, and this causes increased angiotensin
the kidney, as demonstrated by the lowermost curve in
renal artery, large quantities of renin are secreted by
constrictor mechanism. That is, because of poor blood
The early rise in arterial pressure in Goldblatt
in honor of Dr. Goldblatt, who
returned almost all the way back to normal.The hyper-
reaches its new stable pressure level, the
several days. When the
Chapter 19
The Integrated System for Pressure Control
227
followed by a slower additional rise during the next
systemic arterial pressure
renal arterial
pressure (the dashed curve in the figure) will have
tension produced in this way is called “one-kidney”
Goldblatt hypertension
first studied the important quantitative features of
hypertension caused by renal artery constriction.
hypertension is caused by the renin-angiotensin vaso-
flow through the kidney after acute constriction of the
of renin rises to a peak in an hour or so but returns
nearly to normal in 5 to 7 days because the renal arte-
rial pressure by that time has also risen back to
retention of salt and water by the constricted kidney
(that is also stimulated by angiotensin II and aldos-
increased enough to raise the arterial pressure to its
tained pressure level is determined by the degree of
sure must rise high enough so that renal arterial pres-
sure distal to the constrictor is enough to cause normal
urine output.
Hypertension also
can result when the artery to only one kidney is con-
stricted while the artery to the other kidney is normal.
retains salt and water because of decreased renal arte-
site kidney retains salt and water because of the renin
formation of angiotension II and aldosterone both of
which circulate to the opposite kidney and cause it also
Hypertension Caused by Diseased Kidneys That Secrete Renin
are diseased and become ischemic because of local
effects occur as in the two-kidney type of Goldblatt
of the most common causes of renal hypertension,
Hypertension in the Upper Part of the Body Caused by Coarctation
of the Aorta.
One out of every few thousand babies is
born with pathological constriction or blockage of the
aorta at a point beyond the aortic arterial branches to
a condition called coarctation of the aorta.
much vascular resistance between the upper aorta and
in the upper part of the may be 40-50 per cent higher
almost identical to that of one-kidney Goldblatt hyper-
the level of the kidneys rises approximately to normal,
renin and formation of angiotensin and aldosterone
the arterial pressure in the lower body is usually almost
higher than normal.
Role of Autoregulation in the Hypertension Caused by Aortic
Coarctation.
A significant feature of hypertension caused
upper body 40 to 60 per cent greater than in the lower
vasoconstrictor substances in the blood of the upper and
believe that there is a difference in nervous control of
long-term autoregulation develops so nearly completely
that the local blood flow control mechanisms have com-
pensated almost 100 per cent for the differences in pres-
trolled almost exactly in accord with the needs of the
One of the reasons these observations are so important
is that they demonstrate how nearly complete the long-
Approx-
a syndrome called preeclampsia (also called
pregnancy). One of the manifestations of preeclampsia
is hypertension that usually subsides after delivery of
and subsequent release by the placenta of toxic factors
are believed to play a role in causing many of the man-

person is 150 mm Hg, acute reduction of the mean
. In other words, if the mean
somehow improved
impaired, and the kidneys will not excrete adequate
The renal-pressure natriuresis mechanism is
secrete aldosterone.
which, in turn, stimulates the adrenal gland to
stimulation, which increases renin release by the
. This may
hypothalamus, which, in turn, have an excitatory
hormones, such as
fully understood, but recent studies suggest that
. The causes of
is increased in overweight patients
and years, total peripheral vascular resistance may
in response to their increased metabolic demands.
kidneys, gastrointestinal tract, and skeletal muscle
adipose tissue. However, blood flow in the heart,
due, in part, to the
Cardiac output is increased
In fact, new clinical guidelines for treating hyper-
for developing primary hypertension. Clinical studies
are overweight, and studies of different populations
tension. The majority of patients with hypertension
excess weight gain
In most patients,
sion discussed above.
hypertension, there is a strong hereditary tendency, the
as renal artery stenosis. In some patients with primary
to known causes, such
, in contrast to those forms of
is of unknown origin
nicians. These terms mean simply that
widely known as “essential hypertension” by many cli-
tension are said to have “primary hypertension,” also
hypertension. In other strains of hypertensive rats,
glomerular membranes. These structural changes could
kidneys: (1) increased preglomerular renal arterial
the late stages of this type of hypertension, two struc-
siderably more active than in normal rats. However, in
hypertension, the sympathetic nervous system is con-
been studied to the greatest extent, the Okamoto strain,
at least one strain of dogs. In the strain of rats that has
different strains of rats, at least one strain of rabbits, and
a number of strains of lower animals, including several
Spontaneous Hereditary Hypertension in Lower Animals.
type.
mainly an acute type of hypertension, not a chronic
control mechanism. Therefore, the neurogenic hyper-
called central “resetting” of the baroreceptor pressure
the absent baroreceptor signal fades away, which is
Hg. The pressure returns to nearly normal within about
sure to increase from 100 mm Hg to as high as 160 mm
That is, loss of the normal inhibitory effect on the
of the arterial pressure in the aorta and carotid arteries.
The sudden cessation of normal nerve signals from
ceptor Nerves.
hypertension ensues.
where in the body, and
stimulated, peripheral vasoconstriction occurs every-
anxiety, the sympathetic system becomes excessively
For instance, when a person becomes
Acute neurogenic hypertension
hypertension when they have excess salt intake.
These patients are especially prone to extra degrees of
of urine becomes elevated, and the long-term level of
glomerular fluid filtration. For obvious reasons, the arte-
an autoimmune process), which also reduces the rate of
pressure natriuresis, and development of hypertension.
the glomeruli into the renal tubules, impaired renal-
vasoconstriction, decreased rate of fluid filtration from
and other vasodilator substances, causing
nitric oxide
kidneys. This
throughout the body, including the blood vessels of the
in turn, cause dysfunction of vascular endothelial cells
mother. Substances released by the ischemic placenta,
ifestations of this disorder, including hypertension in the
228
Unit IV
The Circulation
endothelial dysfunction decreases release of
Another pathological abnormality that may con-
tribute to hypertension in preeclampsia is thickening of
the kidney glomerular membranes (perhaps caused by
rial pressure level required to cause normal formation
arterial pressure becomes correspondingly elevated.
Neurogenic Hypertension.
can be caused by strong stimulation of the sympathetic
nervous system.
excited for any reason or at times during states of
acute
Acute Neurogenic Hypertension Caused by Sectioning the Barore-
Another type of acute neurogenic hyper-
tension occurs when the nerves leading from the
baroreceptors are cut or when the tractus solitarius
is destroyed in each side of the medulla oblongata
(these are the areas where the nerves from the carotid
and aortic baroreceptors connect in the brain stem).
the baroreceptors has the same effect on the nervous
pressure control mechanisms as a sudden reduction
vasomotor center caused by normal baroreceptor
nervous signals allows the vasomotor center suddenly
to become extremely active and the mean arterial pres-
2 days because the response of the vasomotor center to
tension caused by sectioning the baroreceptor nerves is
Spon-
taneous hereditary hypertension has been observed in
there is evidence that in early development of the
tural changes have been observed in the nephrons of the
resistance and (2) decreased permeability of the
easily be the basis for the long-term continuance of the
impaired renal function also has been observed.
“Primary (Essential) Hypertension”
About 90 to 95 per cent of all people who have hyper-
the hypertension
hypertension that are secondary
same as occurs in animal strains of genetic hyperten-
and sedentary
lifestyle appear to play a major role in causing hyper-
suggest that excess weight gain and obesity may
account for as much as 65 to 70 percent of the risk
have clearly shown the value of weight loss for reduc-
ing blood pressure in most patients with hypertension.
tension recommend increased physical activity and
weight loss as a first step in treating most patients with
hypertension.
Some of the characteristics of primary hypertension
caused by excess weight gain and obesity include:
1.
additional blood flow required for the extra
also increases with weight gain due to increased
metabolic rate and growth of the organs and tissues
As the hypertension is sustained for many months
be increased.
2. Sympathetic nerve activity, especially in the kidneys,
increased sympathetic activity in obesity are not
leptin, released from fat cells
may directly stimulate multiple regions of the
influence on the vasomotor centers of the brain
medulla.
3. Angiotensin II and aldosterone levels are increased
two- to threefold in many obese patients
be caused partly by increased sympathetic nerve
kidneys and therefore formation of angiotensin II,
4.
amounts of salt and water unless the arterial
pressure is high or unless kidney function is
arterial pressure in the essential hypertensive
arterial pressure artificially to the normal value of
vasculature, or (3) by blocking the action of the
thetic transmitter substance on the renal vasculature,
ways: (1) by inhibiting sympathetic nervous signals to
kidneys. Different ones act in one of the following
Vasodilator drugs usually cause vasodilation in
tubular reabsorption of salt and water.
tension: (1)
Two general classes of drugs are used to treat hyper-
weight, and pharmacological treatment with antihy-
Unfortunately, many patients are unable to lose
physical activity and weight loss in most patients.
for treating hypertension recommend, as a first step,
Treatment of Essential Hypertension.
in this chapter.
sure to become salt-sensitive, as discussed previously
discussed in Chapter 31. Abnormal function of the
of hypertensive patients. For example, salt-sensitive
The reason for the difference between nonsalt-
or 60 years of age.
more salt-sensitive as a person ages, especially after 50
characteristic; instead, blood pressure usually becomes
some individuals being more salt-sensitive than others.
characteristic—it is a quantitative characteristic, with
Salt-sensitivity of blood pressure is not an all-or-none
Two additional points should be emphasized: (1)
have salt-sensitive essential hypertension, the high salt
to high salt intake. Conversely, in those patients who
hypertension, the arterial pressure does not increase
intake representing 3.5 times the normal intake. In
people. Now, let us plot on this same graph (1) a
right, to a much higher pressure level than for normal
hypertension. Note
sive patients, one called (1)
Figure 19–14, can be recorded in essential hyperten-
sive patients, two types of curves, shown to the right in
When this procedure is used in essential hyperten-
time recording the changes in arterial pressure.
come into balance with the intake, and at the same
days, then waiting for the renal output of sodium to
increasing the level of sodium intake. The sodium-
very slowly, over many days or weeks, by gradually
essential hypertension. The curves of this figure are
Figure 19–14 is a graphical analysis of
the severity of the hypertension. Eventually uncon-
However, if hypertension is not effectively treated,
increased levels of angiotensin II and aldosterone.
natriuresis, as discussed below.
therapies, however, usually do not cause marked
elevated value of 150 mm Hg. Chronic reductions
cause almost total anuria, and the person will retain
100 mm Hg (but without otherwise altering renal
Chapter 19
The Integrated System for Pressure Control
229
function except for the decreased pressure) will
salt and water until the pressure rises back to the
in arterial pressure with effective antihypertensive
salt and water retention by the kidneys because
these therapies also improve renal-pressure
Experimental studies in obese animals and obese
patients suggest that impaired renal-pressure natri-
uresis in obesity hypertension is caused mainly by
increased renal tubular reabsorption of salt and
water due to increased sympathetic nerve activity and
there may also be vascular damage in the kidneys that
can reduce the glomerular filtration rate and increase
trolled hypertension associated with obesity can lead
to severe vascular injury and complete loss of kidney
function.
Graphical Analysis of Arterial Pressure Control in Essential
Hypertension.
called sodium-loading renal function curves because
the arterial pressure in each instance is increased
loading type of curve can be determined by increasing
the level of sodium intake to a new level every few
nonsalt-sensitive hyperten-
sion and the other (2) salt-sensitive
in both instances that the curves are shifted to the
normal level of salt intake and (2) a high level of salt
the case of the person with nonsalt-sensitive essential
significantly when changing from normal salt intake
intake significantly exacerbates the hypertension.
(2) Salt-sensitivity of blood pressure is not a fixed
sensitive essential hypertension and salt-sensitive
hypertension is presumably related to structural or
functional differences in the kidneys of these two types
hypertension may occur with different types of chronic
renal disease due to gradual loss of the functional units
of the kidneys (the nephrons) or to normal aging as
renin-angiotensin system can also cause blood pres-
Current guidelines
lifestyle modifications that are aimed at increasing
pertensive drugs must be initiated.
vasodilator drugs that increase renal blood
flow and (2) natriuretic or diuretic drugs that decrease
many other tissues of the body as well as in the
the kidneys or by blocking the action of the sympa-
(2) by directly relaxing the smooth muscle of the renal
High intake
E
B
0
50
150
Salt intake and output
(times normal)
0
1
2
3
4
5
6
Arterial pressure (mm Hg)
Nonsalt-sensitive
Normal
Normal
Essential
hypertension
Salt-sensitive
A
D
B
1
Normal intake
100
C
1980, by Annual Reviews http://www.AnnualReviews.org.)
31:15, 1980. With permission, from the
Salt balance and long-term blood pressure control. Annu Rev Med
sion. (Redrawn from Guyton AC, Coleman TG, Young DB, et al:
essential hypertension and (2) salt-sensitive essential hyperten-
Analysis of arterial pressure regulation in (1) nonsalt-sensitive
Figure 19–14
Annual Review of Medi-
cine,
”
more for minutes or hours; as a result, the pressure in
pressure in the blood vessels becomes too high, they
is demonstrated by the following example: When the
stress-relaxation mechanism
when this is needed. The
We have already described at length the role of the
vasculature, and (3) shift of fluid through the tissue
constrictor mechanism, (2) stress-relaxation of the
in Figure 19–15, are (1) the renin-angiotensin vaso-
acute arterial pressure change. Three of these, shown
operate in the reverse direction, again returning the
blood transfusion, the same control mechanisms
When the pressure suddenly rises too high, as might
arterial pressure back into a survival range.
heart, and (3) to cause constriction of most peripheral
as might be caused by severe hemorrhage, the nervous
they are also powerful. After any acute fall in pressure,
these mechanisms begin to react within seconds, but
and (3) the chemoreceptor mechanism. Not only do
They are (1) the baroreceptor feedback mechanism,
three mechanisms that show responses within seconds.
or other nervous responses. Note in Figure 19–15 the
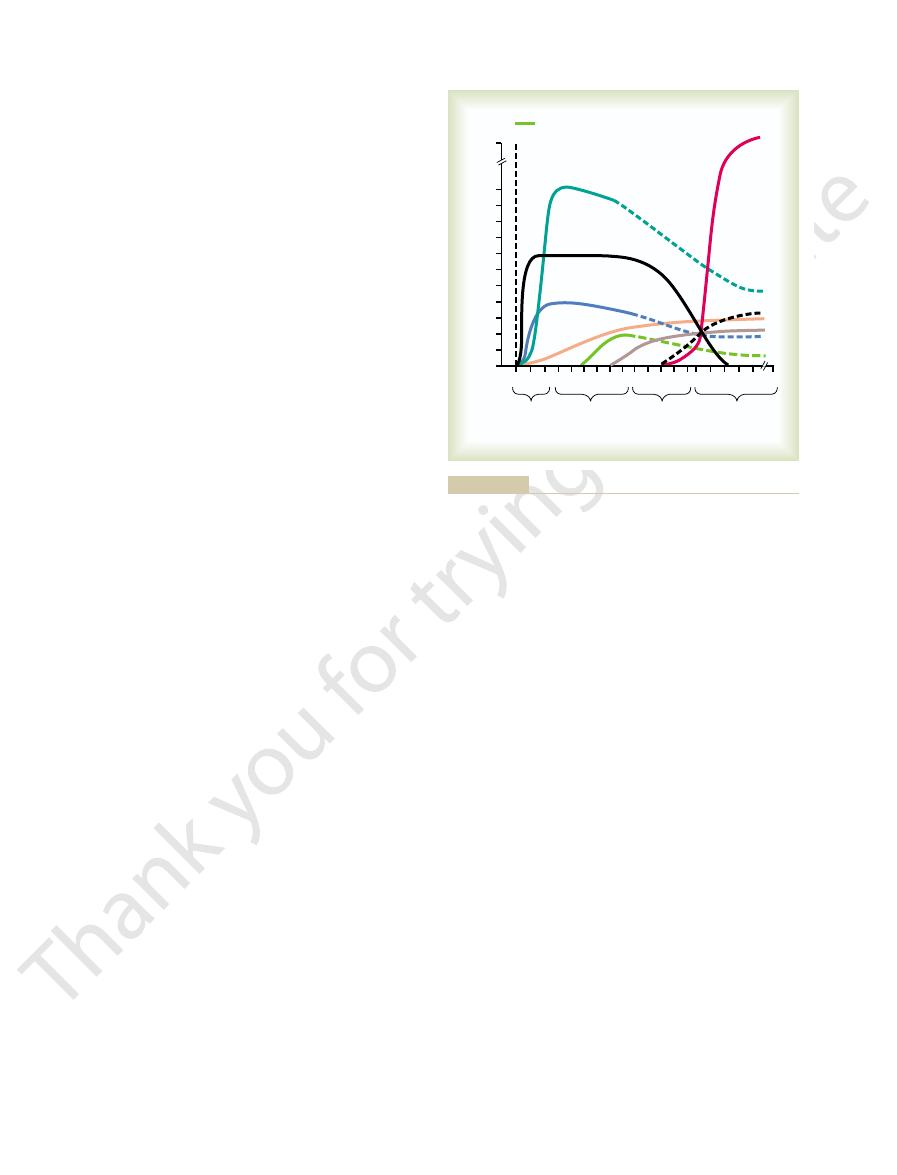
The rapidly acting pressure control
how they fit together as a total, integrated system for
pressure regulation, days, months, and years. Let us see
hours; and (3) those that provide long-term arterial
respond over an intermediate time period, minutes or
react rapidly, within seconds or minutes; (2) those that
nisms can be divided into three groups: (1) those that
arterial pressure control mechanism. These mecha-
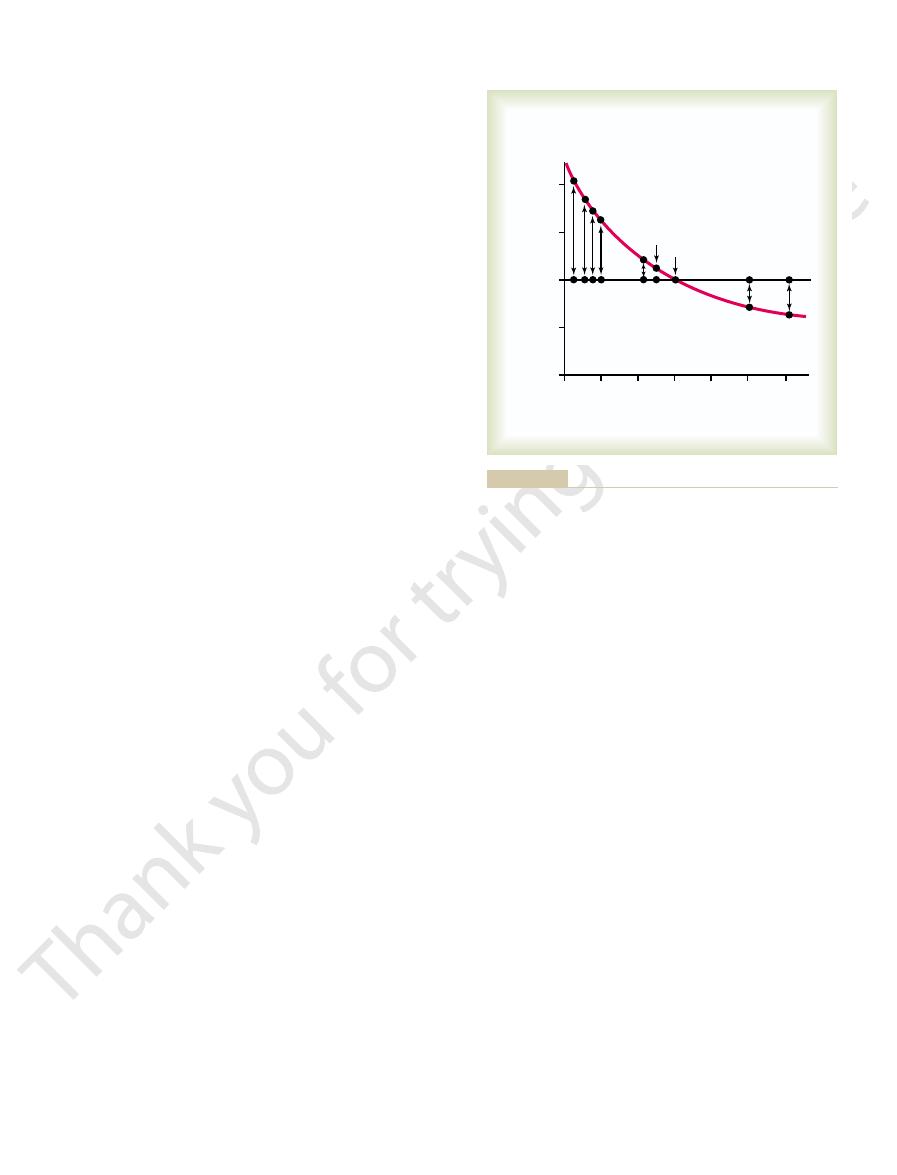
control responses, expressed as feedback gain, of eight
Figure 19–15 shows the approximate immediate
puzzle. Figure 19–15 helps to put these together.
rial pressure. However, there are other pieces to the
the nervous control system. In this chapter, we have
In Chapter 18, we saw that the first line of de-
back to its normal value, not merely back to a pressure
the circulatory system can re-establish full normality,
live through the acute episode. The second is to return
first is survival, that is, to return the arterial pressure
problems confront the pressure control system. The
bleeds severely so that the pressure falls suddenly, two
forms a specific function. For instance, when a person
by several interrelated systems, each of which per-
By now, it is clear that arterial pressure is regulated
Arterial Pressure Regulation
Summary of the Integrated,
natriuretic or diuretic drugs are discussed in greater
tion of water, as explained earlier in the chapter. These
wall; this blockage in turn also prevents the reabsorp-
Those drugs that reduce reabsorption of salt and
renal tubules.
230
Unit IV
The Circulation
renin-angiotensin system on the renal vasculature or
water by the renal tubules include especially drugs that
block active transport of sodium through the tubular
detail in Chapter 31.
Multifaceted System for
not by a single pressure controlling system but instead
immediately to a high enough level that the person can
the blood volume eventually to its normal level so that
including return of the arterial pressure all the way
level required for survival.
fense against acute changes in arterial pressure is
emphasized a second line of defense achieved mainly
by kidney mechanisms for long-term control of arte-
(seconds and minutes) and long-term (hours and days)
pressure control.
Rapidly Acting Pressure Control Mechanisms, Acting Within
Seconds or Minutes.
mechanisms are almost entirely acute nervous reflexes
(2) the central nervous system ischemic mechanism,
mechanisms combine (1) to cause constriction of the
veins and provide transfer of blood into the heart,
(2) to cause increased heart rate and contractility of
the heart to provide greater pumping capacity by the
arterioles to impede flow of blood out of the arteries;
all these effects occur almost instantly to raise the
occur in response to rapid overadministration of a
pressure back toward normal.
Pressure Control Mechanisms That Act After Many Minutes.
Several pressure control mechanisms exhibit signifi-
cant responses only after a few minutes following
capillary walls in and out of the circulation to readjust
the blood volume as needed.
renin-angiotensin vasoconstrictor system to provide a
semi-acute means for increasing the arterial pressure
become stretched and keep on stretching more and
Hours
Days
Seconds
Minutes
2 4 816
0 15 30 1 2 4 8 1632 1
1 2 4 8 16
Maximum feedback gain at optimal pressure
Time after sudden change in pressure
•
0
1
2
3
4
5
6
7
8
9
10
11
Acute change in pressure at this time
Renin-angiotensin-vasoconstriction
Baroreceptors
Capillar
y
Fluid
shi
ft
•
•
!!
CNS
isc
he
m
ic
res
po
ns
e
C
h
emorecepto
rs
Str
ess
rela
xati
o
n
Aldo
stero
ne
R
e
n
a
l–
b
lo
o
d
v
o
lu
m
e
p
re
s
s
u
re
c
o
n
tr
o
l
Hypertension. Philadelphia: WB Saunders Co, 1980.)
weeks’ time. (Redrawn from Guyton AC: Arterial Pressure and
body fluid pressure control mechanism that occurs after a few
) of the renal
arterial pressure. Note especially the infinite gain (
nisms at different time intervals after onset of a disturbance to the
Approximate potency of various arterial pressure control mecha-
Figure 19–15
∞

tension? J Clin Invest 111:947, 2003.
kidney: key factors in understanding salt-sensitive hyper-
Rossier BC: Negative regulators of sodium transport in the
pressure. Hypertension 37:1199, 2001.
Reckelhoff JF: Gender differences in the regulation of blood
sion. J Clin Invest 113:1075, 2004.
O’Shaughnessy KM, Karet FE: Salt handling and hyperten-
tension. Ann Intern Med 139:761, 2003.
Oparil S, Zaman MA, Calhoun DA: Pathogenesis of hyper-
Hypertens 14:68S, 2001.
nitric oxide systems in salt-sensitive hypertension. Am J
Manning RD Jr, Hu L, Tan DY, Meng S: Role of abnormal
of human hypertension. Cell 104:545, 2001.
Lifton RP, Gharavi AG, Geller DS: Molecular mechanisms
Rep 5:386, 2003.
demic on hypertension and renal disease. Curr Hypertens
Hall JE, Jones DW, Kuo JJ, et al: Impact of the obesity epi-
tion in hypertension. Kidney Int Suppl 55:S35, 1996.
Hall JE, Guyton AC, Brands MW: Pressure-volume regula-
nance of the kidney. J Am Soc Nephrol 10(Suppl 12):S258,
term arterial pressure regulation: the overriding domi-
Hall JE, Brands MW, Henegar JR: Angiotensin II and long-
41:625, 2003.
Hall JE: The kidney, hypertension, and obesity. Hypertension
52:584, 1972.
long-term regulation and in hypertension. Am J Med
sure regulation: overriding dominance of the kidneys in
Guyton AC, Coleman TG, Cowley AW Jr, et al: Arterial pres-
kidneys and body fluids. Science 252:1813, 1991.
Guyton AC: Blood pressure control—special role of the
phia: WB Saunders Co, 1980.
Guyton AC: Arterial Pressure and Hypertension. Philadel-
168:161, 2000.
hypertension: role of nitric oxide. Acta Physiol Scand
Granger JP, Alexander BT: Abnormal pressure-natriuresis in
Hypertens 14:178S, 2001.
physiology of pregnancy-induced hypertension. Am J
Granger JP, Alexander BT, Bennett WA, Khalil RA: Patho-
Physiol Rev 72:231, 1992.
Cowley AW J: Long-term control of arterial blood pressure.
blood pressure. Hypertension 42:1206, 2003.
prevention, detection, evaluation, and treatment of high
Seventh Report of the Joint National Committee on
Pressure Education Program Coordinating Committee.
Treatment of High Blood Pressure. National High Blood
Committee on Prevention, Detection, Evaluation, and
Chobanian AV, Bakris GL, Black HR, et al: Joint National
poses.
system, and several other factors that provide special
renin-angiotensin-aldosterone system, the nervous
by the renal–body fluid mechanism. This long-term
and, finally, is stabilized at the long-term pressure level
characteristics of the intermediate pressure controls,
pressure controls, then continues with the sustaining
to changes in salt intake. Thus, arterial pressure control
terone system, blood pressure becomes very sensitive
tive. But, without a functional renin-angiotensin-aldos-
from one day to another. We have seen in this chapter
instance, a person’s salt intake varies tremendously
the aldosterone and renal fluid mechanisms. For
of the renal–body fluid mechanism. Especially impor-
and over the next hour or days, this plays an important
is aldosterone. A decrease in arterial pressure leads
fluid mechanism. One of these, shown in Figure 19–15,
chapter.
this concept, which has been the major point of this
kidneys. By now, the reader should be familiar with
not merely partway back, to that pressure level that
all the way
equal to infinity. This means that this mechanism can
showing significant response. Yet it eventually devel-
nism), demonstrating that it takes a few hours to begin
the far right in Figure 19–15 is shown the renal-blood
kidneys in long-term control of arterial pressure. To
The
Long-Term Mechanisms for Arterial Pressure Regulation.
pressure control measures.
importance of these non-nervous, intermediate time
become less and less effective, which explains the
During this time, the nervous mechanisms usually
mostly activated within 30 minutes to several hours.
These three intermediate mechanisms become
fluid is lost out of the circulation into the tissues, thus
Conversely, when the capillary pressure rises too high,
tissues into the circulation, thus building up the blood
that any time capillary pressure falls too low, fluid is
capillary fluid shift mechanism
The
intermediate-term pressure “buffer.”
of the vessels, called stress-relaxation, can serve as an
the vessels falls toward normal. This continuing stretch
Chapter 19
The Integrated System for Pressure Control
231
means simply
absorbed through the capillary membranes from the
volume and increasing the pressure in the circulation.
reducing the blood volume as well as virtually all the
pressures throughout the circulation.
goal of this chapter has been to explain the role of the
volume pressure control mechanism (which is the
same as the renal–body fluid pressure control mecha-
ops a feedback gain for control of arterial pressure
eventually return the arterial pressure
back,
provides normal output of salt and water by the
It must also be remembered that many factors can
affect the pressure-regulating level of the renal–body
within minutes to an increase in aldosterone secretion,
role in modifying the pressure control characteristics
tant is interaction of the renin-angiotensin system with
that the salt intake can decrease to as little as 1/10
normal or can increase to 10 to 15 times normal and
yet the regulated level of the mean arterial pressure
will change only a few millimeters of mercury if the
renin-angiotensin-aldosterone system is fully opera-
begins with the lifesaving measures of the nervous
mechanism in turn has multiple interactions with the
blood pressure control capabilities for special pur-
References
1999.