
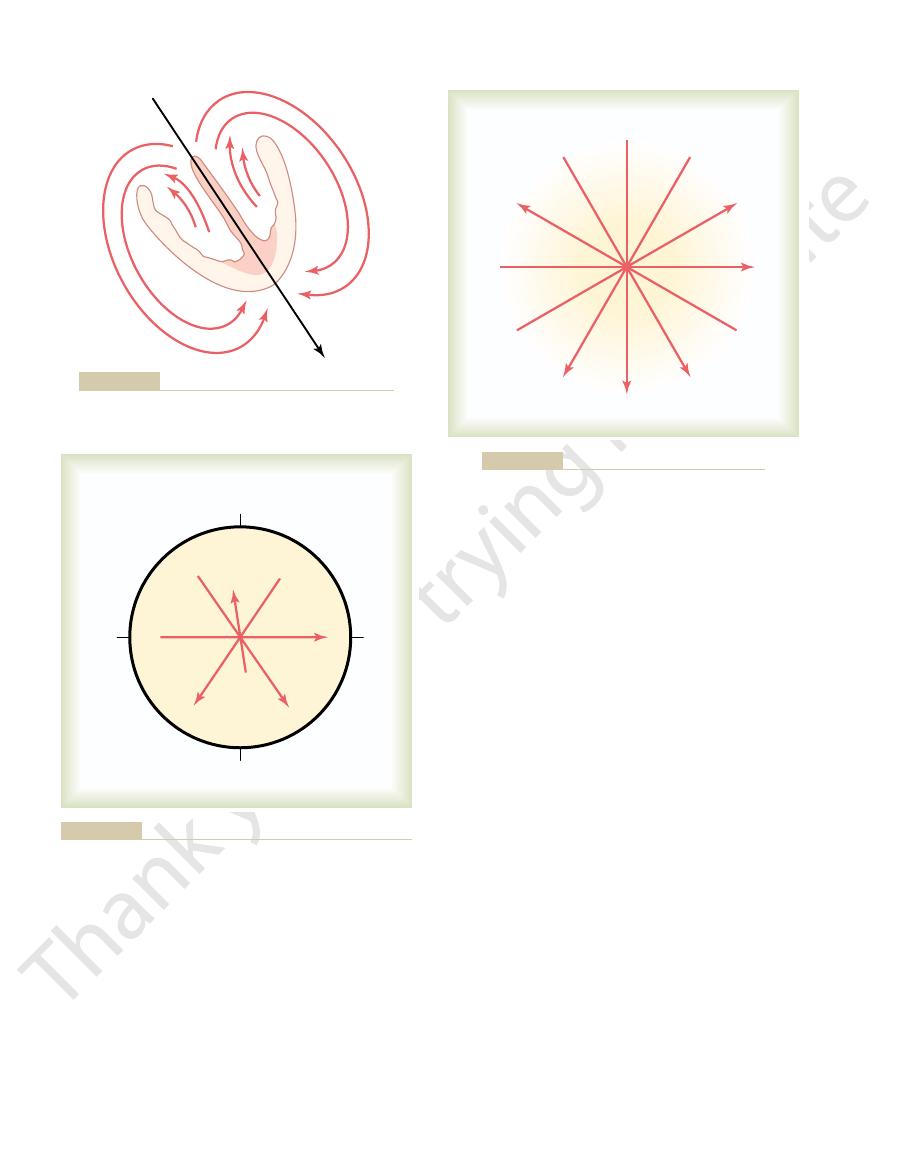
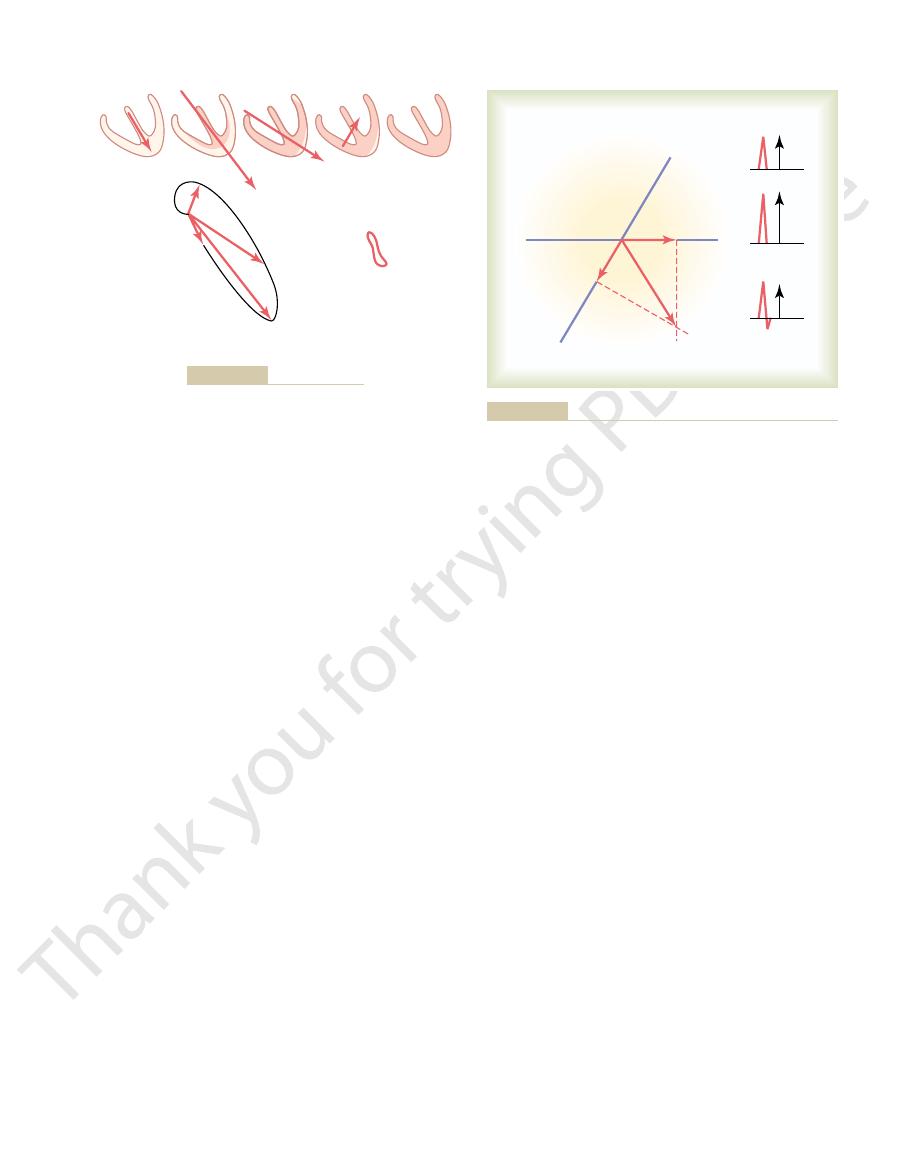
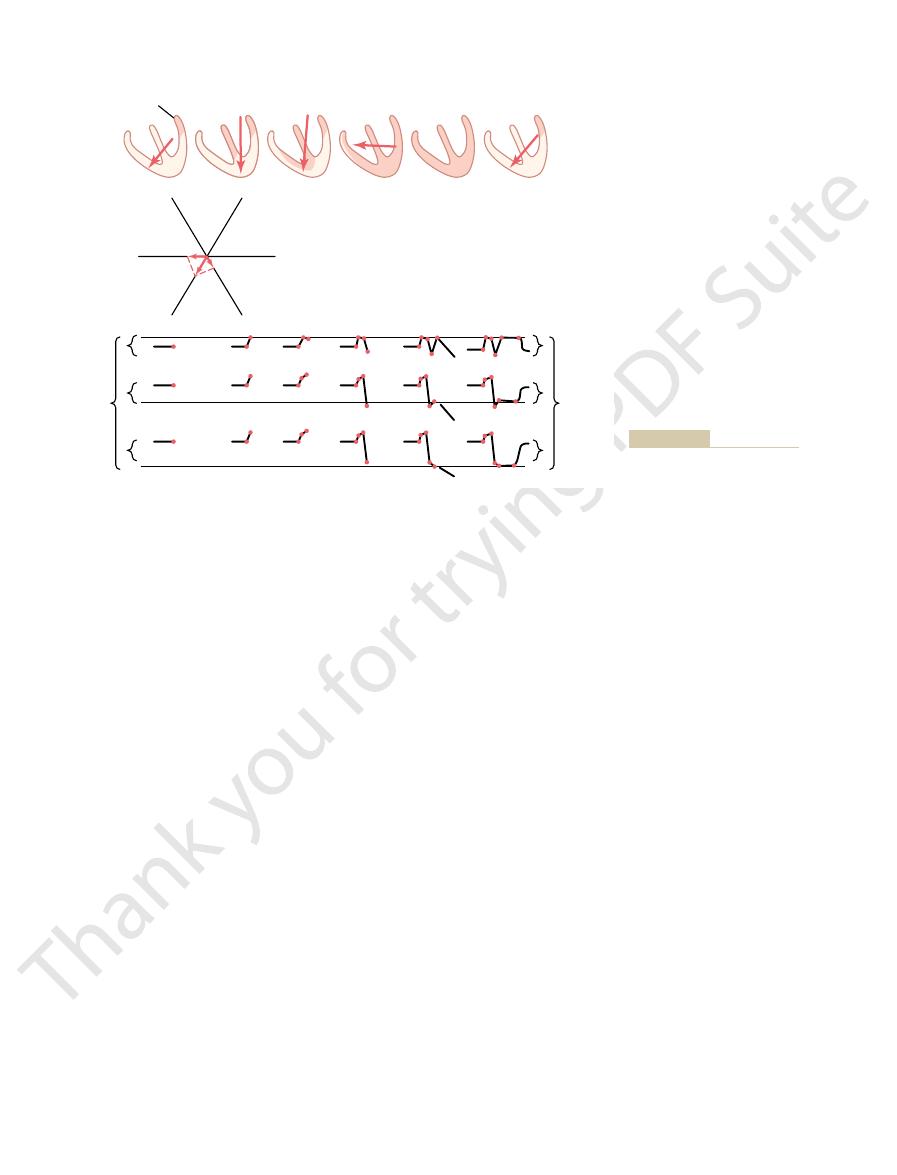
the vector is said to extend in the direction of 0 degrees, as shown in Figure
When a vector is exactly horizontal and directed toward the person’s left side,
Direction of a Vector Is Denoted in Terms of Degrees
current is considerable in quantity, the potential is large, and the vector is long.
cles in a direction from base toward apex. Furthermore, because the summated
black
instantaneous mean vector,
erated potential at this particular instant, called the
apex than in the upward direction. Therefore, the summated vector of the gen-
from the depolarized areas toward the still polarized areas. Overall, consider-
long elliptical arrows. Some current also flows inside the heart chambers directly
and the nondepolarized areas on the outside of the heart, as indicated by the
tation, electrical current flows between the depolarized areas inside the heart
of the apical endocardial walls of the two ventricles. At this instant of heart exci-
area and the negative signs, depolarization of the ventricular septum and parts
Figure 12–1 shows, by the shaded
“Resultant” Vector in the Heart at Any Given Instant.
convention, the length of the arrow is drawn
Also, by
with the arrowhead in the positive direction.
ated by the current flow,
particular direction in the heart at a given instant during the cardiac cycle. A
tours of the electrocardiogram, one must first become thoroughly familiar with
Use of Vectors to Represent Electrical Potentials
of Electrocardiograms
Principles of Vectorial Analysis
waves in the different electrocardiographic leads.
electrocardiogram. For this reason, almost all
consequently, alter the shapes of the waves in the
mission through the heart, it is obvious that any
From the discussion in Chapter 10 of impulse trans-
Abnormalities: Vectorial Analysis
C
H
A
P
T
E
R
1
2
131
Electrocardiographic
Interpretation of Cardiac Muscle
and Coronary Blood Flow
change in the pattern of this transmission can cause
abnormal electrical potentials around the heart and,
serious abnormalities of the heart muscle can be
diagnosed by analyzing the contours of the different
Before it is possible to understand how cardiac abnormalities affect the con-
the concept of vectors and vectorial analysis as applied to electrical potentials
in and around the heart.
Several times in Chapter 11 it was pointed out that heart current flows in a
vector is an arrow that points in the direction of the electrical potential gener-
proportional to the voltage of the
potential.
ably more current flows downward from the base of the ventricles toward the
is represented by the long
arrow drawn through the center of the ventri-
this chapter.
limb leads I, II, and III, to understand the remainder of
axes and their polarities, particularly for the bipolar
minus signs in the figure.
The
of the axes of all these leads are shown in Figure 12–3,
30 degrees. The directions
90 degrees; and aVL
aVF,
120 degrees; lead aVR,
By similar analysis, it can be seen that lead III has
60 degrees.
connects in the lower left-hand corner. Therefore, the
right arm and left leg. The right arm connects to the
In recording lead II, electrodes are placed on the
0 degrees.
the positive electrode to the left, the axis of lead I is
trodes lie exactly in the horizontal direction, with
placed respectively on the two arms. Because the elec-
of the lead. Lead I is recorded from two electrodes
ative electrode to positive electrode is called the “axis”
opposite sides of the heart, and the direction from neg-
unipolar limb leads are described. Each lead is actu-
In Chapter 11, the three standard bipolar and the three
in the chapter.
with respect to the base of the heart, as discussed later
ization wave, the apex of the heart remains positive
direction. This means that during most of the depolar-
through the center of Figure 12–2 in the
59 degrees, which is shown by vector
mean QRS vector,
through the ventricles, called the
In a normal heart, the average direction of the
270) degrees.
it extends straight upward, it has a direction of
180 degrees; and when
to right, it has a direction of
90 degrees; when it extends from the person’s left
from above and straight downward, it has a direction
vectors rotates clockwise: when the vector extends
12–2. From this zero reference point, the scale of
132
Unit III
The Heart
of
+
+
-90 (or
+
vector during spread of the depolarization wave
is
about
+
A drawn
+59-degree
Axis for Each Standard Bipolar Lead
and Each Unipolar Limb Lead
ally a pair of electrodes connected to the body on
torso in the upper right-hand corner and the left leg
direction of this lead is about
+
an axis of about
+
+210 degrees;
+
-
which is known as the hexagonal reference system.
polarities of the electrodes are shown by the plus and
The reader must learn these
- -
-
-
-
-
-
-
-
-
-
- - -
-
-
-
-
-
-
-
-
-
--
-
-
+
+
+
+
+
+
+
+
+
+
+
+
+
+
+
+
+
+
+
+ +
+ +
+ + + + + +
+
+
+
+
+
+
+
+
+
+
+
+
+
+
+
+
+
+
+
+
+
+
+
+
Mean vector through the partially depolarized ventricles.
Figure 12–1
-
90
∞
+
270
∞
-
90
∞
180
∞
-
100
∞
0
∞
59
∞
120
∞
A
heart.
and the “axis” of the potential (expressed in degrees) for each
Vectors drawn to represent potentials for several different hearts,
Figure 12–2
90
∞
60
∞
0
∞
-
30
∞
210
∞
aVR
aVR
aVF
aVL
aVL
I
II
III
III
I
120
∞
-
+
+
+
-
+
+
-
-
-
+
-
Axes of the three bipolar and three unipolar leads.
Figure 12–3
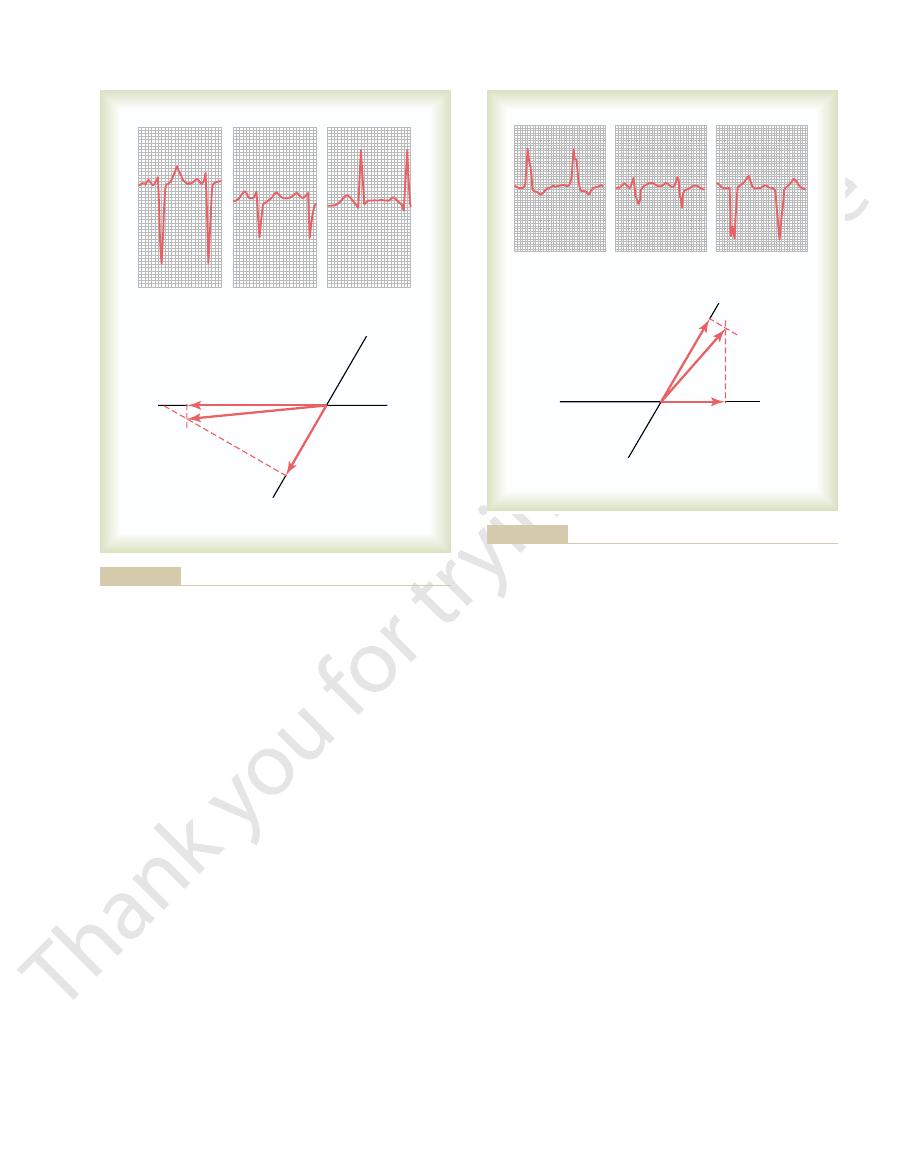
In Figure 12–6, vector
Vectorial Analysis of Potentials in the Three Standard
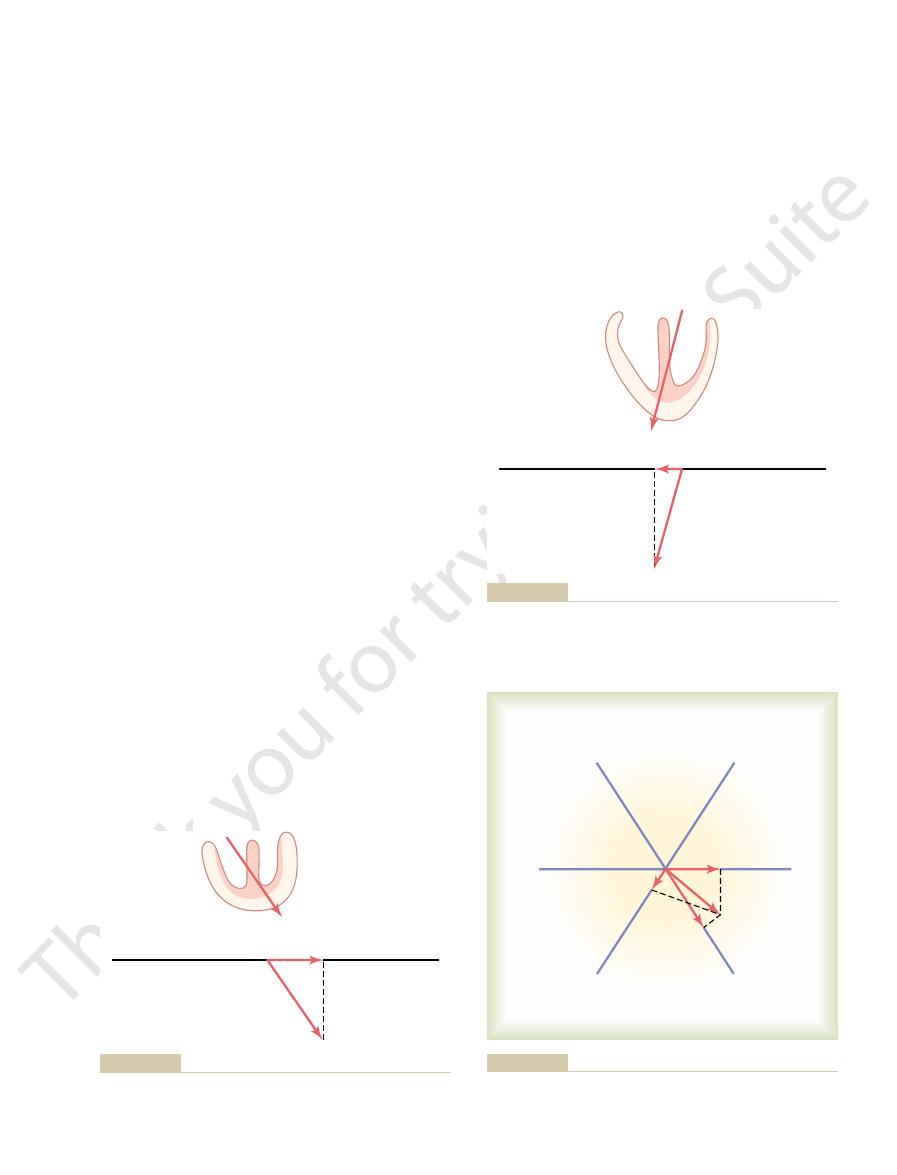
the entire voltage of the vector will be recorded.
almost exactly the same axis as the lead axis, essentially
Conversely,
is very low.
voltage recorded in the electrocardiogram of this lead
tion almost perpendicular to the axis of the lead, the
0.3 millivolts. This figure demon-
will be slight, about
in the electrocardiogram), and the voltage recorded
direction, indicating that at this particular instant, the
Vector
lead I, we draw a perpendicular line from the tip of
livolts. To determine the potential actually recorded in
direction of 100 degrees, and its voltage is again 2 mil-
right. In this instance, the instantaneous vector has a
analysis. In this example, vector
Figure 12–5 shows another example of vectorial
times 2 millivolts, or about
cardiogram of lead I is positive. And the instantaneous
the positive end of the lead I axis, which means that
I axis. The arrow of this projected vector points toward
to the lead I axis, and
in lead I, a line perpendicular to the axis of lead I is
axis of lead I in the 0-degree direction. To determine
is shown again, and a line is drawn to represent the
is 2 millivolts. In the diagram below the heart, vector
of the potential, represented by the length of vector
55 degrees, and the voltage
of current flow in the ventricles. In this instance, the
Figure 12–4 shows a partially depolarized heart;
follows.
gram of each lead for a given vector in the heart, as
vectors and, second, the axes of the leads, it is possible
Now that we have discussed, first, the conventions for
Recorded in Different Leads
Vectorial Analysis of Potentials
Electrocardiographic Interpretation of Cardiac Muscle and Coronary Blood Flow Abnormalities
Chapter 12
133
representing potentials across the heart by means of
to use these together to determine the instantaneous
potential that will be recorded in the electrocardio-
vector A represents the instantaneous mean direction
direction of the vector is
+
A,
A
how much of the voltage in vector A will be recorded
drawn from the tip of vector A
a so-called projected vector (B) is drawn along the lead
the record momentarily being recorded in the electro-
recorded voltage will be equal to the length of B
divided by the length of A
1 millivolt.
A represents the elec-
trical potential and its axis at a given instant during
ventricular depolarization in a heart in which the left
side of the heart depolarizes more rapidly than the
vector A to the lead I axis and find projected vector B.
B is very short and this time in the negative
recording in lead I will be negative (below the zero line
-
strates that when the vector in the heart is in a direc-
when the heart vector has
Bipolar Limb Leads.
A depicts the
-
A
B
I
I
A
+
vector A represents the instantaneous potential in the ventricles.
Determination of a projected vector B along the axis of lead I when
Figure 12–4
-
B
I
I
A
+
when vector A represents the instantaneous potential in the
Determination of the projected vector B along the axis of lead I
Figure 12–5
ventricles.
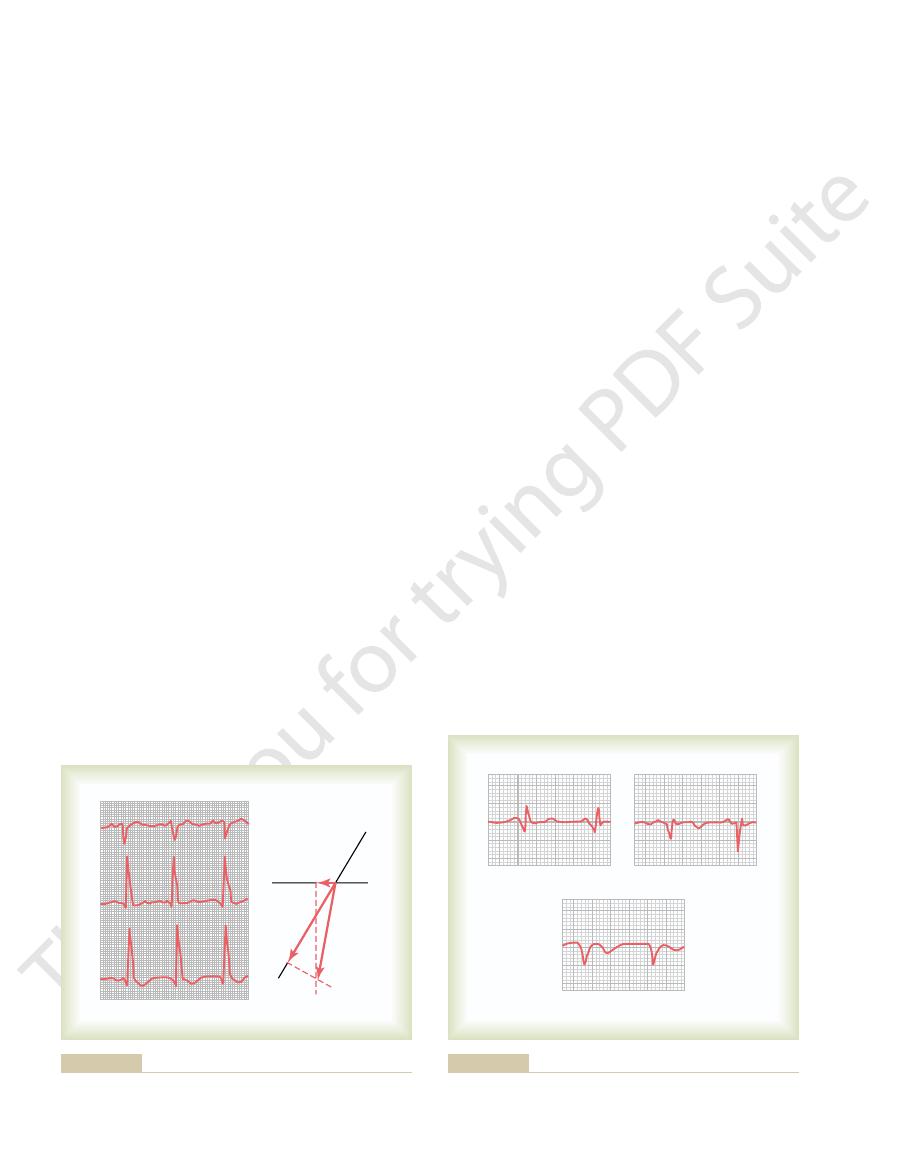
A
B
C
D
I
II
III
III
II
I
+
+
+
-
-
-
vector A represents the instantaneous potential in the ventricles.
Determination of projected vectors in leads I, II, and III when
Figure 12–6

about 0.15 second later, repolarization begins and
Repolarization—The T Wave
Electrocardiogram During
deflection is the S wave.
Figure 12–7 is the R wave, and the final negative
vector occurs. The major positive deflection shown in
side, which creates a weak vector from left to right for
the Q wave. When it occurs, it is caused by initial depo-
which is not shown in Figure 12–7; this depression is
depression at its beginning in one or more of the leads,
three standard bipolar limb leads.
Thus, the QRS complexes are completed in the
zero.
becomes zero, and the voltages in all leads become
and no electrical potential is generated. The vector
depolarized, so that no current flows around the heart
depolarization, the entire ventricular muscle mass is
In Figure 12–7
voltage of lead I is still positive.
both negative—that is, below the line—whereas the
this time, the voltages recorded in leads II and III are
ized positive. Because of the direction of the vector at
of the left ventricle, and it is short because only a
depolarization, the heart vector points toward the base
In Figure 12–7
voltage in lead I to that in lead III is increasing.
to depolarize than the right. Therefore, the ratio of the
the other epicardial surfaces of the heart. Also, the axis
electronegative, neutralizing much of the positivity on
depolarization, the heart vector is becoming shorter
In Figure 12–7
become depolarized. Therefore, the voltages in all
after onset of depolarization, the heart vector is long
In Figure 12–7
of the leads. The voltage in lead II is greater than the
fore, all electrocardiographic voltages are low, as
of the ventricles—the septum—is depolarized. There-
time, the vector is short because only a small portion
0.01 second after the onset of depolarization. At this
begun to be depolarized, representing an instant about
In Figure 12–7
summary of this sequence follows.
in detail by the procedure given here. A short
understood. Each of these analyses should be studied
successive normal vectors presented in Figure 12–7 be
vectorial analysis, it is essential that this analysis of the
will cause recording below the zero line.
diogram above the zero line, whereas a negative vector
vector in a lead will cause recording in the electrocar-
Keep in mind that a positive
electrocardiographic leads. To the right in each figure
the ventricle in each figure. Each of these vectors is
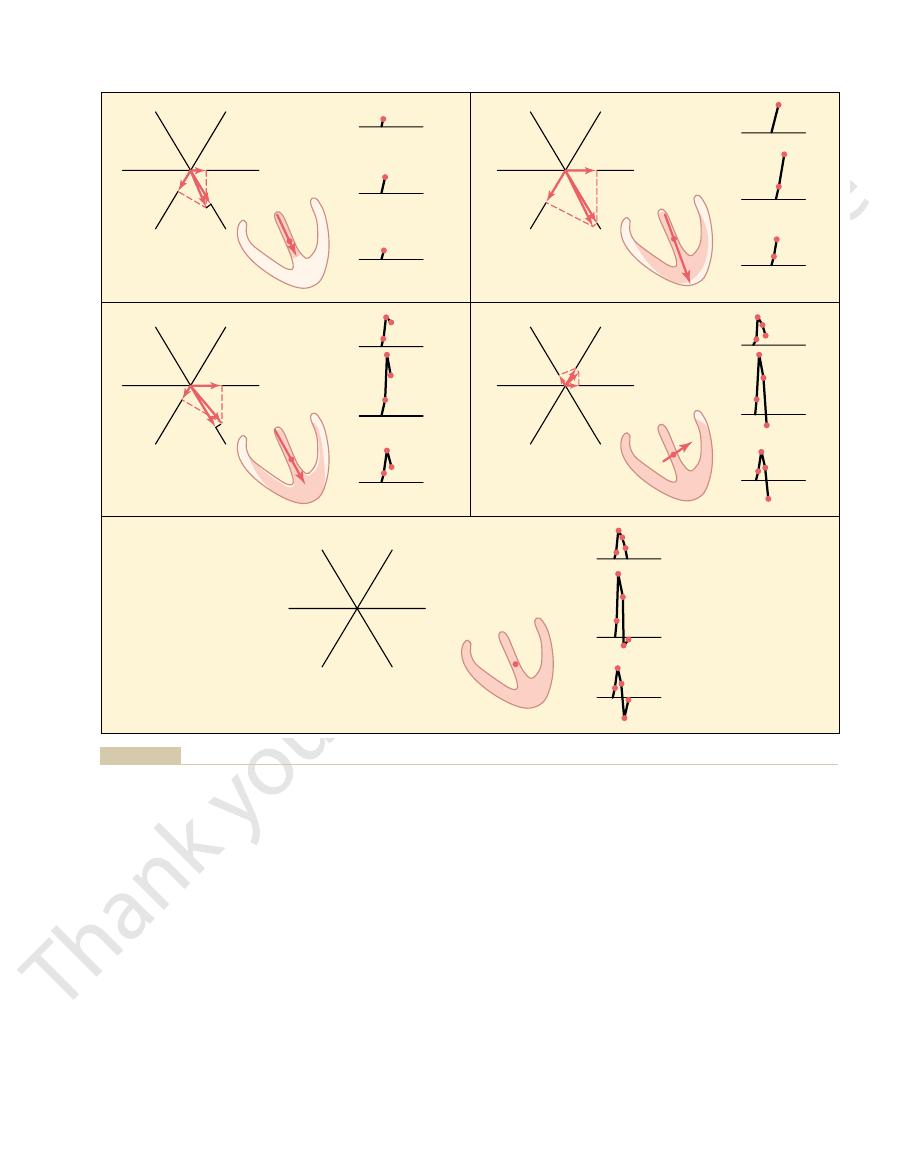
At each stage in Figure 12–7, parts
C, D,
Figure 12–7
the outside of the heart, as shown progressively in
Finally, it spreads through the ventricular muscle to
der of the two ventricles, as shown in Figure 12–7
. Next, depolarization
of the ventricle in Figure 12–7
the septum, as demonstrated by the shaded portion
cardial surface of the septum. Then depolarization
through the atrioventricular bundle, the first part of
When the cardiac impulse enters the ventricles
Ventricles—The QRS Complex
Intervals During Depolarization of the
Vectors That Occur at Successive
Normal Electrocardiogram
Vectorial Analysis of the
limb lead axes used for Figure 12–6.
Figure 12–3) are used in place of the standard bipolar
potentials recorded in augmented limb leads, except
), it is about one third that in the
), it is almost equal to that in the heart; and
); in lead
The potential in lead I (vector
positive directions along the axes of all the leads.
the electrocardiogram is positive—that is, above the
potential in lead III. In each of these, the record in
potential in lead II, and projected vector
at that instant in lead I, projected vector
The projected vector
three different standard leads, as shown in the figure.
the three standard bipolar limb leads, perpendicular
larized heart. To determine the potential recorded at
134
Unit III
The Heart
instantaneous electrical potential of a partially depo-
this instant in the electrocardiogram for each one of
lines (the dashed lines) are drawn from the tip of
vector A to the three lines representing the axes of the
B depicts the potential recorded
C depicts the
D depicts the
zero line—because the projected vectors point in the
B) is about one half that
of the actual potential in the heart (vector A
II (vector C
in lead III (vector D
heart.
An identical analysis can be used to determine
that the respective axes of the augmented leads (see
the ventricles to become depolarized is the left endo-
spreads rapidly to involve both endocardial surfaces of
A
spreads along the endocardial surfaces of the remain-
B and
C.
and E.
A to E, the
instantaneous mean electrical potential of the ventri-
cles is represented by a red vector superimposed on
then analyzed by the method described in the preced-
ing section to determine the voltages that will be
recorded at each instant in each of the three standard
is shown progressive development of the electrocar-
diographic QRS complex.
Before proceeding with further consideration of
A, the ventricular muscle has just
recorded to the right of the ventricular muscle for each
voltages in leads I and III because the heart vector
extends mainly in the same direction as the axis of lead
II.
B, which represents about 0.02 second
because much of the ventricular muscle mass has
electrocardiographic leads have increased.
C, about 0.035 second after onset of
and the recorded electrocardiographic voltages are
lower because the outside of the heart apex is now
of the vector is beginning to shift toward the left side
of the chest because the left ventricle is slightly slower
D, about 0.05 second after onset of
minute portion of the ventricular muscle is still polar-
E, about 0.06 second after onset of
Sometimes the QRS complex has a slight negative
larization of the left side of the septum before the right
a fraction of a second before the usual base-to-apex
After the ventricular muscle has become depolarized,
repolarization is small. Later, the vector becomes
first, the vector is relatively small because the area of
the apex until it disappears in the last stage. At
white areas—the repolarized areas. At each stage,
In Figure 12–8, five stages of repolarization of the
T wave in all three bipolar limb leads is positive, which
As a result, the normal
repolarize before the inner surfaces, the positive end
tion in the endocardial areas.
flow to the endocardium, thereby slowing repolariza-
contraction, which greatly reduces coronary blood
dial areas, conversely, normally repolarize last. This
The endocar-
cles, especially near the apex of the heart.
repolarize first is the entire outer surface of the ventri-
fore,
than most of the external surfaces of the heart. There-
these areas should repolarize first as well. However,
ventricular muscle depolarize first, it seems logical that
larization causes the T wave in the electrocardiogram.
proceeds until complete at about 0.35 second.This repo-
Electrocardiographic Interpretation of Cardiac Muscle and Coronary Blood Flow Abnormalities
Chapter 12
135
Because the septum and endocardial areas of the
this is not the usual case because the septum and other
endocardial areas have a longer period of contraction
the greatest portion of ventricular muscle mass to
sequence of repolarization is postulated to be caused
by the high blood pressure inside the ventricles during
Because the outer apical surfaces of the ventricles
of the overall ventricular vector during repolarization
is toward the apex of the heart.
is also the polarity of most of the normal QRS complex.
ventricles are denoted by progressive increase of the
the vector extends from the base of the heart toward
−
−
−
I
I
I
+
+
+
II
II
II
III
III
A
III
−
−
−
I
I
I
+
+
+
II
II
II
III
III
B
III
−
I
I
I
+
+
+
II
II
II
III
III
C
III
−
−
−
−
−
I
I
I
+
+
+
II
II
II
III
III
D
III
−
−
−
I
I
I
+
+
+
II
II
II
III
III
E
III
Shaded areas of the ventricles are depolarized (–); nonshaded areas are still polarized (
Figure 12–7
+). The ventricular vectors and QRS complexes
0.01 second after onset of ventricular depolarization (A); 0.02 second after onset of depolarization (B); 0.035 second after onset of
depolarization (C); 0.05 second after onset of depolarization (D); and after depolarization of the ventricles is complete, 0.06 second after
onset (E).
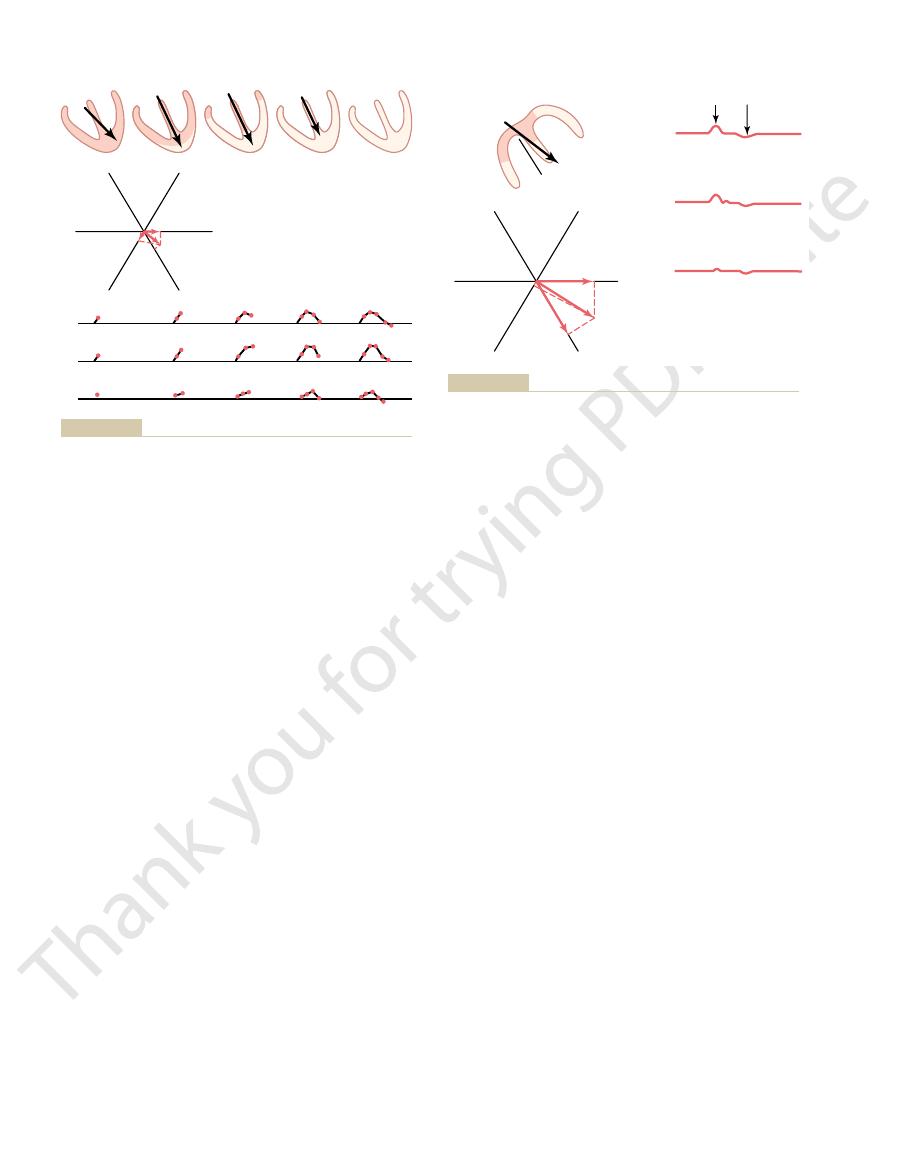
Second, the vector changes direction because of
increasing and decreasing voltage of the vector.
myocardium. It changes in two aspects: First, the
Vectorcardiogram
complex, although in some very abnormal states, it
of the ventricles appears. Therefore, it is almost always
In the normal electrocardiogram, the
limb leads.
ence line from the P wave; that is, it is normally nega-
this T wave is on the opposite side of the zero refer-
follows about 0.15 second after the atrial P wave, but
the right in Figure 12–9, the so-called atrial T wave
that occurs in the ventricles.) Therefore, as shown to
backward to the vector of
itive with respect to the rest of the atria. Therefore, the
begins, the region around the sinus node becomes pos-
Thus, when repolarization
become depolarized first.
is the sinus nodal region, the area that had originally
the area in the atria that also becomes repolarized first
musculature in distal parts of the atria. Because of this,
tion signal. Therefore, the musculature around the
slower than in the ventricles
much
Repolarization of the Atria—The Atrial T Wave.
depolarization is known as the atrial P wave.
leads, as shown in Figure 12–9. This record of atrial
standard bipolar limb leads I, II, and III, the electro-
depolarization. Because this direction is generally
12–9. Furthermore, the vector remains generally in this
depolarization is denoted by the black vector in Figure
where the sinus node lies, and the direction of initial
and spreads in all directions over the atria. Therefore,
The P Wave
Depolarization of the Atria—
take place, the T wave of the electrocardiogram is
stages of repolarization. Thus, over about 0.15 second,
under each of the ventricles, depicting the progressive
The changes in the electrocardiograms of the three
that the total quantity of current flow decreases. These
Finally, the vector becomes weaker again because the
136
Unit III
The Heart
stronger because of greater degrees of repolarization.
areas of depolarization still persisting become so slight
changes also demonstrate that the vector is greatest
when about half the heart is in the polarized state and
about half is depolarized.
standard limb leads during repolarization are noted
the period of time required for the whole process to
generated.
Depolarization of the atria begins in the sinus node
the point of original electronegativity in the atria is
about at the point of entry of the superior vena cava
direction throughout the process of normal atrial
in the positive directions of the axes of the three
cardiograms recorded from the atria during depolar-
ization are also usually positive in all three of these
Spread of
depolarization through the atrial muscle is
because the atria have no
Purkinje system for fast conduction of the depolariza-
sinus node becomes depolarized a long time before the
atrial repolarization vector is
depolarization. (Note that this is opposite to the effect
tive rather than positive in the three standard bipolar
atrial T wave
appears at about the same time that the QRS complex
totally obscured by the large ventricular QRS
does appear in the recorded electrocardiogram.
It has been noted in the discussion up to this point that
the vector of current flow through the heart changes
rapidly as the impulse spreads through the
vector increases and decreases in length because of
I
-
-
-
I
I
+
+
+
II
II
III
III
II
III
approximately 0.15 second.
The total time from the beginning of the T wave to its end is
showing also vectorial analysis of the first stage of repolarization.
Generation of the T wave during repolarization of the ventricles,
Figure 12–8
I
P
T
-
-
-
-
-
-
-
-
-
-
-
-
-
I
I
+
+
+
+ +
+
+
+
+
+
+
+
+ +
+
+ + +
+
+
+
+
+
+
+
+
+
II
II
III
III
SA
II
III
the three standard leads. At the right are the atrial P and T waves.
the maximum vector through the atria and the resultant vectors in
Figure 12–9
Depolarization of the atria and generation of the P wave, showing
SA, sinoatrial node.
for that lead, as shown by the
recording is negative,
negative during part of the cycle. If any part of a
and in lead III, the recording is mainly positive but
III. In lead I of Figure 12–11, the recording is positive,
recording the standard leads, one determines the net
Figure 12–11 shows a method for doing this. After
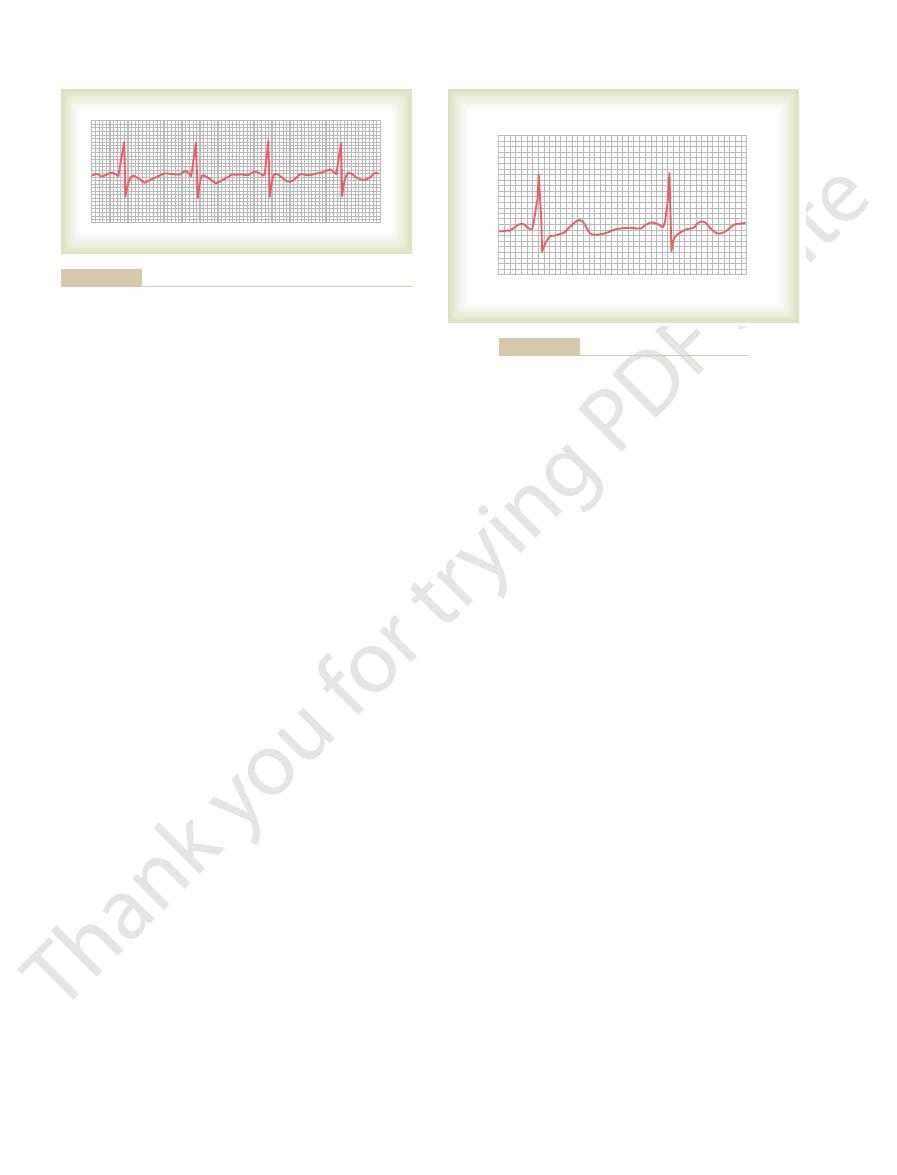
Clinically, the electrical axis of the heart usually is esti-
Determining the Electrical Axis from
tions of the heart, this direction changes markedly—
ventricles is 59 degrees. In many pathological condi-
The mean electrical axis of the normal
ventricles.
This preponderant direction of the potential during
most of the cycle of ventricular depolarization, the
mainly toward the apex of the heart. That is, during
12–10 is that of a normal heart. Note from this vec-
tion (the QRS vectorcardiogram) shown in Figure
The vectorcardiogram during ventricular depolariza-
of the Ventricular QRS—
vector, thus inscribing the vectorcardiogram on the
the vector changes, the spot of light on the oscilloscope
each side of the heart to the horizontal plates. When
Vectorcardiograms can be recorded on an oscilloscope
QRS vectorcardiogram.
The elliptical figure generated by the positive ends
zero once again, as shown at point 5.
become totally depolarized, and the vector becomes
occurs in another 0.01 second. Finally, the ventricles
second, vector 3 represents the potential, and vector 4
about 0.02 second after vector 1. After another 0.02
slightly to one side. Thus, vector 2 of Figure 12–10 rep-
becomes stronger and stronger, usually swinging
ventricular muscle becomes depolarized, the vector
by the positive end of vector 1. As more of the
portion of the ventricular vectorcardiogram, as shown
tricles, but it is relatively weak, thus generating the first
When the septum first becomes depolarized, the
cles at the beginning of ventricular depolarization, the
there is no vectorial electrical potential. However,
muscle is polarized between heartbeats, the positive
ative end of all the successive vectors. While the heart
zero reference point,
In the large vectorcardiogram of Figure 12–10, point
the cardiac cycle, as shown in Figure 12–10.
vectorcardio-
potential from the heart. The so-called
Electrocardiographic Interpretation of Cardiac Muscle and Coronary Blood Flow Abnormalities
Chapter 12
137
changes in the average direction of the electrical
gram depicts these changes at different times during
5 is the
and this point is the neg-
end of the vector remains at the zero point because
as soon as current begins to flow through the ventri-
positive end of the vector leaves the zero reference
point.
vector extends downward toward the apex of the ven-
resents the state of depolarization of the ventricles
of the vectors is called the
by connecting body surface electrodes from the neck
and lower abdomen to the vertical plates of the oscil-
loscope and connecting chest surface electrodes from
follows the course of the positive end of the changing
oscilloscopic screen.
Mean Electrical Axis
And Its Significance
torcardiogram that the preponderant direction of the
vectors of the ventricles during depolarization is
direction of the electrical potential (negative to posi-
tive) is from the base of the ventricles toward the apex.
depolarization is called the mean electrical axis of the
sometimes even to opposite poles of the heart.
Standard Lead Electrocardiograms
mated from the standard bipolar limb lead electrocar-
diograms rather than from the vectorcardiogram.
potential and polarity of the recordings in leads I and
this negative potential is sub-
tracted from the positive part of the potential to deter-
mine the net potential
arrow to the right of the QRS complex for lead III.
1
2
3
4
5
5
4
3
2
Depolarization
QRS
Repolarization
T
1
QRS and T vectorcardiograms.
Figure 12–10
I
III
III
III
I
+
+
-
-
II
I
59
∞
-
60
∞
0
∞
180
∞
120
∞
trocardiographic leads (leads I and III).
Plotting the mean electrical axis of the ventricles from two elec-
Figure 12–11
deviation, to an electrical axis of 170 degrees, which is
cardiogram of Figure 12–13 shows intense right axis
The electro-
from Hypertrophy of the Right Ventricle.
Vectorial Analysis of Right Axis Deviation Resulting
relatively normal in size.
aortic valvular stenosis, aortic valvular regurgitation,
sure. A similar picture of left axis deviation occurs
(high arterial blood pressure), which
tricle. In this instance, the axis deviation was caused by
15-degree direction. This is a typical electrocardio-
grams. Vectorial analysis demonstrates left axis devia-
Figure 12–12 shows
Hypertrophy of the Left Ventricle.
Vectorial Analysis of Left Axis Deviation Resulting from
hypertrophied ventricle.
positively charged. Thus, the axis deviates toward the
toward the hypertrophied side, which remains strongly
ventricle, and this causes
than through the normal ventricle. Consequently, the
Second, more time is required for the depolarization
excess generation of electrical potential on that side.
side of the heart than on the other side, and this allows
for two reasons. First, a far
the axis of the heart shifts toward the
hypertrophies,
When one ventricle greatly
Hypertrophy of One Ventricle.
(2) when a person stands up, and (3) normally in tall,
This occurs (1) at the end of deep inspiration,
Likewise, angulation of the heart to the right causes
upward against the heart all the time.
stocky, fat people whose diaphragms normally press
against the diaphragm, and (3) quite frequently in
down, because the abdominal contents press upward
at the end of deep expiration, (2) when a person lies
. Such shift occurs (1)
itself is angulated to the left, the mean electrical axis
limits, as follows.
hearts. However, a number of abnormal conditions of
100 degrees. The causes of the normal variations are
averages about 59 degrees, this axis can swing even
Cause Axis Deviation
Abnormal Ventricular Conditions That
as determined in Figure 12–11, is 59 degrees positive
of the mean electrical axis of the normal ventricles,
the direction of the mean vector. Thus, the orientation
vector, and the mean electrical axis is represented by
between these two points. The approximate average
mean vector. Therefore, the
ventricles, and the point of intersection of the lead I
rial analysis, the apex of the
of these two perpendicular lines represents, by vecto-
leads I and III, respectively. The point of intersection
lar mean electrical potential, one draws perpendicular
To determine the vector of the total QRS ventricu-
along the line depicting lead III. If it is negative, it is
and, if positive, it is plotted in the positive direction
a negative direction. Also, for lead III, the net poten-
Conversely, if this potential is negative, it is plotted in
If the net potential of lead I is positive, it is plotted
shown in Figure 12–11.
potential at the point of intersection of the axes, as
on the axes of the respective leads, with the base of the
Then each net potential for leads I and III is plotted
138
Unit III
The Heart
in a positive direction along the line depicting lead I.
tial is placed with its base at the point of intersection,
plotted in the negative direction.
lines (the dashed lines in the figure) from the apices of
mean QRS vector in the
and lead III axes represents the negative end of the
mean QRS vector is drawn
potential generated by the ventricles during depolar-
ization is represented by the length of this mean QRS
(
+59 degrees).
Although the mean electrical axis of the ventricles
in the normal heart from about 20 degrees to about
mainly anatomical differences in the Purkinje distri-
bution system or in the musculature itself of different
the heart can cause axis deviation beyond the normal
Change in the Position of the Heart in the Chest.
If the heart
of the heart also shifts to the left
the mean electrical axis of the ventricles to shift to the
right.
lanky people whose hearts hang downward.
hypertrophied ventricle
greater quantity of muscle exists on the hypertrophied
wave to travel through the hypertrophied ventricle
normal ventricle becomes depolarized considerably in
advance of the hypertrophied
a strong vector from the normal side of the heart
the three standard bipolar limb lead electrocardio-
tion with mean electrical axis pointing in the
-
gram caused by increased muscle mass of the left ven-
hypertension
caused the left ventricle to hypertrophy so that it could
pump blood against elevated systemic arterial pres-
when the left ventricle hypertrophies as a result of
or
any number of congenital heart conditions in which the
left ventricle enlarges while the right ventricle remains
II
III
I
I
I
III
III
+
+
-
-
. Note the slightly prolonged QRS complex as well.
(hypertrophic left ven-
Left axis deviation in a hypertensive heart
Figure 12–12
tricle)
rapidly than the right ventricle, so that the left side of
is blocked, the left ventricle depolarizes far more
When the right bundle branch
Vectorial Analysis of Right Axis Deviation in Right
caused by hypertrophy.
the chapter. This extremely prolonged QRS complex
Figure 12–14. This is discussed in greater detail later in
in the affected side of the heart. One can see this by
ation, the duration of the QRS complex is greatly pro-
the Purkinje system is blocked, in addition to axis devi-
demonstrated in Figure 12–14, which shows typical left
the vector points toward the left ventricle. This is
ventricle. In other words, there is intense left axis devi-
during most of the depolarization process, and a strong
Thus, the right ventricle becomes electronegative,
the left ventricle. Consequently, much of the left ven-
blocked, cardiac depolarization spreads through the
When the left bundle branch is
Vectorial Analysis of Left Axis Deviation in Left Bundle
ation occurs as follows.
tials do not neutralize each other. As a result, axis devi-
nearly simultaneously, and the depolarization poten-
before it spreads through the other. Therefore, depo-
the major bundle branches is blocked, the cardiac
heart) almost neutralize each other. But if only one of
the same instant. As a result, the potentials generated
Ordinarily, the
tetralogy of Fallot
phy of the right ventricle, such as
valve stenosis.
ventricular QRS axis. The right axis deviation demon-
Electrocardiographic Interpretation of Cardiac Muscle and Coronary Blood Flow Abnormalities
Chapter 12
139
111 degrees to the right of the normal 59-degree mean
strated in this figure was caused by hypertrophy of the
right ventricle as a result of congenital pulmonary
Right axis deviation also can occur in
other congenital heart conditions that cause hypertro-
and
interventricular septal defect.
Bundle Branch Block Causes Axis Deviation.
lateral walls of the two ventricles depolarize at almost
the same instant because both the left and the right
bundle branches of the Purkinje system transmit the
cardiac impulse to the two ventricular walls at almost
by the two ventricles (on the two opposite sides of the
impulse spreads through the normal ventricle long
larization of the two ventricles does not occur even
Branch Block.
right ventricle two to three times as rapidly as through
tricle remains polarized for as long as 0.1 second after
the right ventricle has become totally depolarized.
whereas the left ventricle remains electropositive
vector projects from the right ventricle toward the left
ation of about
-50 degrees because the positive end of
axis deviation resulting from left bundle branch block.
Because of slowness of impulse conduction when
longed because of extreme slowness of depolarization
observing the excessive widths of the QRS waves in
differentiates bundle branch block from axis deviation
Bundle Branch Block.
the ventricles becomes electronegative as long as
II
III
I
I
I
III
+
+
-
-
III
ation and a slightly prolonged QRS complex also are seen.
with right ventricular hypertrophy. Intense right axis devi-
congenital pulmonary valve
High-voltage electrocardiogram in
Figure 12–13
stenosis
II
III
I
I
I
III
+
+
-
-
III
the greatly prolonged QRS complex.
Figure 12–14
Left axis deviation caused by left bundle branch block. Note also
electricity around the heart, so that the voltages at the
to a lesser extent, also can “short-circuit” the
reach the outside surfaces of the body.
dial fluid. Thus, this effusion effectively “short-circuits”
trical currents with great ease, a large portion of the
pericardium.
Decreased Voltage Caused by Conditions Surrounding the
of muscle mass throughout the ventricles.
QRS complex, which is common after multiple small
decreased voltage. Figure 12–16 shows a typical low-
once. Consequently, this condition causes some pro-
This
diminished muscle mass.
old myocardial artery
Decreased Voltage Caused by Cardiac Myopathies.
Decreased Voltage of the
shown in Figures 12–12 and 12–13.
graphic leads are considerably greater than normal, as
quantities of electricity around the heart. As a result,
when a person has high blood pressure. The increased
monary valve, and the left ventricle hypertrophies
the other. For example, the right ventricle hypertro-
often is increased muscle mass of the heart, which
The cause of high-voltage QRS complexes most
4 millivolts, the patient is considered to have a high-
general, when the sum of the voltages of all the QRS
tions are not invariable, even for the normal heart. In
voltage and lead II the highest. However, these rela-
millivolts, with lead III usually recording the lowest
to the bottom of the S wave, vary between 0.5 and 2.0
limb leads, as measured from the peak of the R wave
Normally, the voltages in the three standard bipolar
Increased Voltage in the Standard
Abnormal Voltages of the QRS
12–15, which shows an axis of about 105 degrees
demonstrated, and its vector is analyzed, in Figure
other words, intense right axis deviation occurs. Right
cle and its positive end toward the right ventricle. In
develops, with its negative end toward the left ventri-
0.1 second before the right. Therefore, a strong vector
140
Unit III
The Heart
axis deviation caused by right bundle branch block is
instead of the normal 59 degrees and a prolonged QRS
complex because of slow conduction.
Conditions That Cause
Complex
Bipolar Limb Leads
complexes of the three standard leads is greater than
voltage electrocardiogram.
ordinarily results from hypertrophy of the muscle in
response to excessive load on one part of the heart or
phies when it must pump blood through a stenotic pul-
quantity of muscle causes generation of increased
the electrical potentials recorded in the electrocardio-
Electrocardiogram
One of
the most common causes of decreased voltage of the
QRS complex is a series of
infarctions with resultant
also causes the depolarization wave to move through
the ventricles slowly and prevents major portions of
the heart from becoming massively depolarized all at
longation of the QRS complex along with the
voltage electrocardiogram with prolongation of the
infarctions of the heart have caused local delays of
impulse conduction and reduced voltages due to loss
Heart.
One of the most important causes of decreased
voltage in electrocardiographic leads is fluid in the
Because extracellular fluid conducts elec-
electricity flowing out of the heart is conducted from
one part of the heart to another through the pericar-
the electrical potentials generated by the heart,
decreasing the electrocardiographic voltages that
Pleural effu-
sion,
I
II
III
III
+
I
I
+
-
-
III
also the greatly prolonged QRS complex.
Figure 12–15
Right axis deviation caused by right bundle branch block. Note
I
II
III
previous myocardial infarction
Low-voltage electrocardiogram following local damage through-
Figure 12–16
out the ventricles caused by
.

of lead III, the voltage of the current of injury in lead
so that the record is positive. Furthermore, because the
of the lead. In lead III, the projected vector points in
lead II, the record is above the line because the pro-
points toward the negative end of the lead I axis. In
record in lead I below the zero potential line,
the QRS complex begins,
shown in the lower portions of the figure, even before
toward the injured muscle. As
vector, the
direction of about 125 degrees, with the base of the
injury,” as shown in the first heart in the figure, is in a
rest of the ventricles. The vector of this “current of
Therefore, during the T-P interval—that is, when the
In Figure 12–17, a small area in the base of the left ven-
Effect of Current of Injury on the
current of injury in the heart. During ischemia, not
occlusions,
of local areas of heart muscle caused by local coronary
ischemia
that damage the muscle membranes; and (3)
larization cannot take place; (2)
mechanical trauma,
neutral or positive polarity.
rounding fluids, whereas the remainder of the heart is
depolarized and emits negative charges into the sur-
of the heart is negative, because this is the part that is
current of injury.
ized areas even between heartbeats. This is called a
When this occurs, current flows between
all the time.
depolarized
that damage the heart muscle itself, often cause part
Many different cardiac abnormalities, especially those
Current of Injury
as those shown in Figure 12–14.
peaks in some of the electrocardiographic leads, such
axis deviations. This often causes double or even triple
becomes irregular, causing rapid shifts in voltages and
system. As a result, cardiac impulse conduction
scar tissue, and (2) multiple small local blocks in the
ventricular system, with replacement of this muscle by
are caused by two conditions: (1) destruction of
Figures 12–14 and 12–15.
where in the ventricular conduction system, as shown
when it lasts more than 0.12 second, the prolongation
In general, a QRS complex is considered to be
greater.
one of the bundle branches occurs, the duration of the
one third of normal. Therefore, if complete block of
muscle instead of by way of the Purkinje system. This
When the Purkinje fibers are blocked, the cardiac
from Purkinje System Blocks
the left or right ventricle, the QRS complex may be
to 0.08 second, whereas in hypertrophy or dilatation of
must then travel. The normal QRS complex lasts 0.06
dilated, owing to the longer pathway that the impulse
longed QRS complex. Such prolongation often occurs
still polarized. Therefore,
tinues to spread through the ventricles—that is, as long
The QRS complex lasts as long as depolarization con-
of Cardiac Hypertrophy or Dilatation
Patterns of the QRS Complex
Prolonged and Bizarre
electrocardiographic potentials in the various leads.
to the surface of the body, and this results in decreased
than normally. Therefore, the lungs act as an insulator
of air in the lungs. Also, the chest cavity enlarges, and
that of pericardial effusion. In pulmonary emphysema,
diographic potentials, but by a different method from
Electrocardiographic Interpretation of Cardiac Muscle and Coronary Blood Flow Abnormalities
Chapter 12
141
surface of the body and in the electrocardiograms are
decreased.
Pulmonary emphysema can decrease the electrocar-
conduction of electrical current through the lungs is
depressed considerably because of excessive quantity
the lungs tend to envelop the heart to a greater extent
to prevent spread of electrical voltage from the heart
Prolonged QRS Complex as a Result
as part of the ventricles is depolarized and part is
prolonged conduction of the
impulse through the ventricles always causes a pro-
when one or both ventricles are hypertrophied or
prolonged to 0.09 to 0.12 second.
Prolonged QRS Complex Resulting
impulse must then be conducted by the ventricular
decreases the velocity of impulse conduction to about
QRS complex usually is increased to 0.14 second or
abnormally long when it lasts more than 0.09 second;
is almost certainly caused by pathological block some-
by the electrocardiograms for bundle branch block in
Conditions That Cause Bizarre QRS
Complexes
Bizarre patterns of the QRS complex most frequently
cardiac muscle in various areas throughout the
conduction of impulses at many points in the Purkinje
of the heart to remain partially or totally
the pathologically depolarized and the normally polar-
Note especially that the injured part
Some abnormalities that can cause current of injury
are (1)
which sometimes makes
the membranes remain so permeable that full repo-
infectious processes
which is by far the most common cause of
enough nutrients from the coronary blood supply are
available to the heart muscle to maintain normal mem-
brane polarization.
QRS Complex
tricle is newly infarcted (loss of coronary blood flow).
normal ventricular muscle is totally polarized—abnor-
mal negative current still flows from the infarcted area
at the base of the left ventricle and spreads toward the
negative end,
this vector causes an initial
because
the projected vector of the current of injury in lead I
jected vector points more toward the positive terminal
the same direction as the positive terminal of lead III,
vector lies almost exactly in the direction of the axis
III is much greater than in either lead I or lead II.
segment. In the figure, a horizontal line has been
trocardiograms is not on the same line as the T-P
In other words, the J point of each of these two elec-
an injured heart. Both records show injury potentials.
Figure
Use of the J Point in Plotting Axis of Injury Potential.
zero potential level
the level of the J point. This horizontal line is then the
potential caused by a current of injury, a horizontal
Then, for analysis of the electrical axis of the injury
gram, as shown in Figure 12–18.
point is known as the “J point” in the electrocardio-
electrocardiogram at this instant is at zero voltage.This
disappears at this point. Therefore, the potential of the
is flowing around the heart. Even the current of injury
damaged parts and the normal parts, so that no current
cles have become depolarized, including both the
complex. At exactly this point, all parts of the ventri-
the exact point at which the
tial level: First, one notes
electrocardiogram. For these reasons, the following
leg, these stray currents make it impossible for one to
fluids of the body. Therefore, when two electrodes are
such as currents resulting from “skin potentials” and
heart. However, many stray currents exist in the body,
Potential for Analyzing Current
in each lead, as noted at the far right in Figure 12–17.
larization in the injured base of the left ventricle. Thus,
finally repolarizes, except the area of permanent depo-
Next, as repolarization takes place, all of the heart
in the electrocardiogram, no current flows from the
muscle is in a negative state. Therefore, at this instant
next-to-last stage in Figure 12–17), all the ventricular
When the heart becomes totally depolarized, at the
lower part of Figure 12–17.
can be constructed graphically, as demonstrated in the
manently depolarized. By vectorial analysis, the suc-
depolarized is the base of the right ventricle, because
The last portion of the ventricles to become totally
the apex and back toward the bases of the ventricles.
depolarized; then the depolarization spreads down to
process of depolarization, the septum first becomes
142
Unit III
The Heart
As the heart then proceeds through its normal
the base of the left ventricle is already totally and per-
cessive stages of electrocardiogram generation by the
depolarization wave traveling through the ventricles
end of the depolarization process (as noted by the
ventricles to the electrocardiographic electrodes
because now both the injured heart muscle and the
contracting muscle are depolarized.
repolarization causes a return of the current of injury
The J Point—The Zero Reference
of Injury
One would think that the electrocardiograph
machines for recording electrocardiograms could
determine when no current is flowing around the
from differences in ionic concentrations in different
connected between the arms or between an arm and a
predetermine the exact zero reference level in the
procedure must be used to determine the zero poten-
wave of depolarization just completes its passage
through the heart, which occurs at the end of the QRS
line is drawn in the electrocardiogram for each lead at
in the electrocardiogram from
which all potentials caused by currents of injury must
be measured.
12–18 shows electrocardiograms (leads I and III) from
drawn through the J point to represent the zero
-
-
-
I
I
+
+
+
II
II
III
III
Current
of injury
Injured area
Current
of injury
I
J
J
J
II
III
the electrocardiogram.
Effect of a current of injury on
Figure 12–17
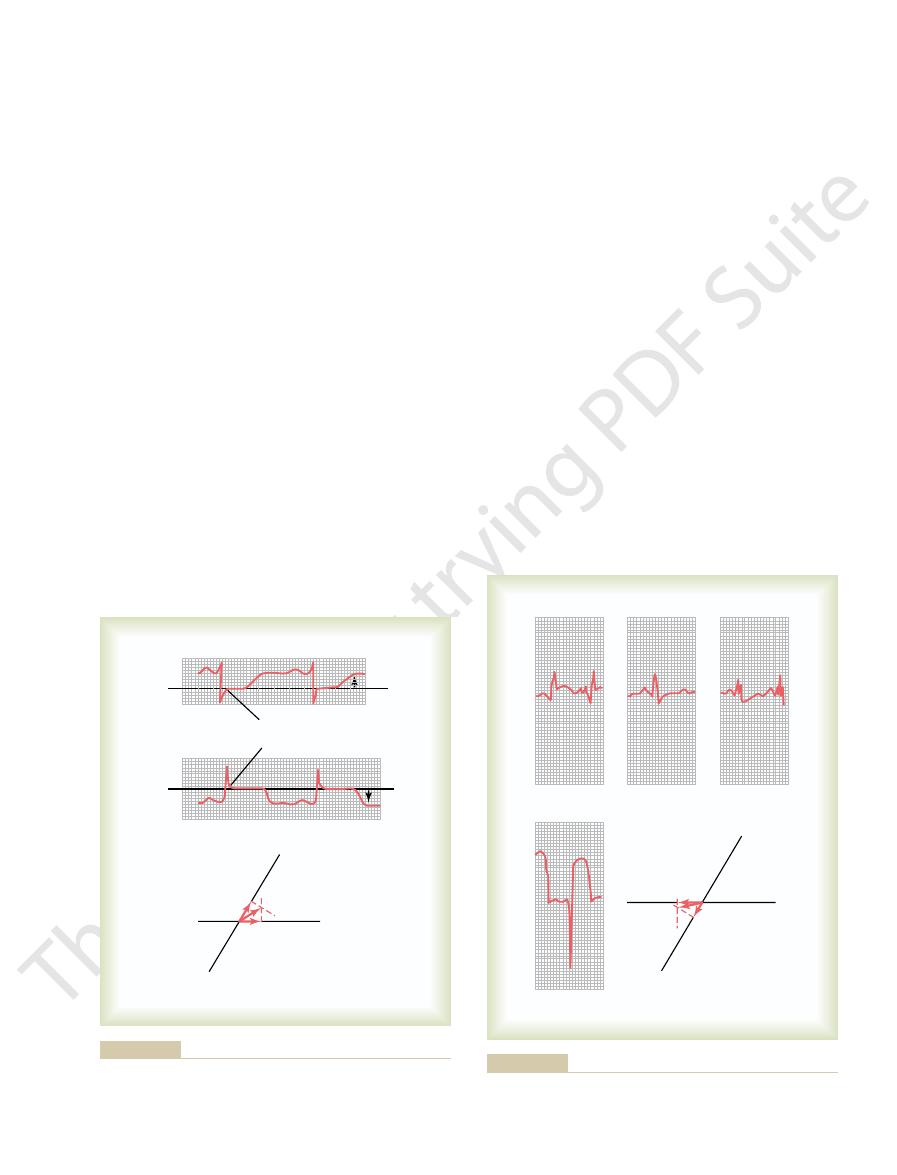
Figure 12–19 shows the
Acute Anterior Wall Infarction.
current of injury.
Figures 12–19 and 12–20. Therefore, one of the most
the T-P interval between heartbeats, as shown in
coronary occlusion, and a strong current of injury
(the T-P portion) of each heart cycle.
membranes. As long as this state exists, an injury
Consequently, repolarization of the muscle membrane
dioxide, and (3) lack of sufficient food nutrients.
lack of oxygen, (2) excess accumulation of carbon
the metabolism of the muscle for three reasons: (1)
again until he or she understands it thoroughly. No
This analysis is obviously complex. However, it is
right ventricle.
In the example shown in Figure 12–18,
the ventricles.
toward the permanently depolarized, “injured” area of
the ventricles,
30 degrees. If one
upward, with an axis of about
instance, the resultant vector extends from the right
is determined by vectorial analysis as described. In this
nates of these leads, and the resultant vector of the
At the bottom in Figure 12–18, the respective injury
therefore, is negative.
and is, therefore, positive. Conversely, in lead III, the
mined from the J point. In lead I, the recorded voltage
voltage level in each of the two recordings. The injury
Electrocardiographic Interpretation of Cardiac Muscle and Coronary Blood Flow Abnormalities
Chapter 12
143
potential in each lead is the difference between the
voltage of the electrocardiogram immediately before
onset of the P wave and the zero voltage level deter-
of the injury potential is above the zero potential level
injury potential is below the zero voltage level and,
potentials in leads I and III are plotted on the coordi-
injury potential for the whole ventricular muscle mass
side of the ventricles toward the left and slightly
-
places this vector for the injury potential directly over
the negative end of the vector points
the injured area would be in the lateral wall of the
essential that the student go over it again and
other aspect of electrocardiographic analysis is more
important.
Coronary Ischemia as a Cause
of Injury Potential
Insufficient blood flow to the cardiac muscle depresses
cannot occur in areas of severe myocardial ischemia.
Often the heart muscle does not die because the blood
flow is sufficient to maintain life of the muscle even
though it is not sufficient to cause repolarization of the
potential continues to flow during the diastolic portion
Extreme ischemia of the cardiac muscle occurs after
flows from the infarcted area of the ventricles during
important diagnostic features of electrocardiograms
recorded after acute coronary thrombosis is the
electrocardiogram in the three standard bipolar limb
I
I
0
I
0
“J” point
“J” point
+
-
+
+
-
-
III
III
0
III
0
+
-
potential is shown by the lowermost panel.
for leads I and II. Also, the method for plotting the axis of the injury
J point as the zero reference potential of the electrocardiograms
Figure 12–18
I
II
I
I
V
2
+
+
-
-
III
III
III
injury potential in lead V
acute anterior wall infarction
Current of injury in
Figure 12–19
. Note the intense
2
.
terior wall infarction, demonstrating changes in the
shows a V
Figure 12–21
Recovery from Acute Coronary Thrombosis.
portion of the heart that is emitting the current of injury.
muscle, and the negative end points toward the injured
potential vector points toward the normal cardiac
is involved. In making such vectorial analyses, it must
current of injury, regardless of which part of the heart
anterior and posterior wall infarctions, it is possible to
the apex on the posterior wall of the left ventricle.
the heart, one would suspect that this infarct is near
potentials in leads II and III, is in the apical portion of
rior wall of the heart and, as indicated by the injury
infarct, as indicated by the chest lead, is on the poste-
the positive end pointing upward. Thus, because the
degrees, with the negative end pointing downward and
analysis, as shown in the figure, one finds that the
injury potential is negative in both leads. By vectorial
and III of Figure 12–20, it is readily apparent that the
of the heart opposite to the anterior chest wall, which
words, the current of injury is coming from the back
of the vector) points away from the chest wall. In other
anterior chest wall, and the negative end (injured end
the current of injury is positive. This means that the
apparent that during the T-P interval, the potential of
is drawn through the J point of this lead, it is readily
also in the chest lead. If a zero potential reference line
) from a patient with posterior wall infarction. The
Figure 12–20 shows the three
Posterior Wall Infarction.
nary artery.
heart. Therefore, one would conclude that this anterior
gram, the current of injury is coming mainly from the
right ventricle. Thus, in this particular electrocardio-
degrees, with the negative end pointing toward the left
potential in lead III. This means that the resultant
from the anterior wall of the ventricles, which diag-
This means that the current of injury is emanating
other words, the negative end of the injury potential
heart is in an area of strongly negative potential. In
injury potential during the T-P interval is found, which
the J point of this electrocardiogram, a strong
diogram is the intense injury potential in chest lead V
patient with acute anterior wall cardiac infarction. The
leads and in one chest lead (lead V
144
Unit III
The Heart
2
) recorded from a
most important diagnostic feature of this electrocar-
2
.
If one draws a zero horizontal potential line through
negative
means that the chest electrode over the front of the
vector in this heart is against the anterior chest wall.
noses this condition as anterior wall infarction.
Analyzing the injury potentials in leads I and III,
one finds a negative potential in lead I and a positive
vector of the injury potential in the heart is about
+150
ventricle and the positive end pointing toward the
left ventricle as well as from the anterior wall of the
wall infarction almost certainly is caused by thrombo-
sis of the anterior descending branch of the left coro-
standard bipolar limb leads and one chest lead (lead
V
2
major diagnostic feature of this electrocardiogram is
positive end of the vector is in the direction of the
is the reason this type of electrocardiogram is the basis
for diagnosing posterior wall infarction.
If one analyzes the injury potentials from leads II
resultant vector of the injury potential is about
-95
Infarction in Other Parts of the Heart.
By the same proce-
dures demonstrated in the preceding discussions of
determine the locus of any infarcted area emitting a
be remembered that the positive end of the injury
3
chest lead from a patient with acute pos-
electrocardiogram from the day of the attack to 1
III
V
I
II
II
II
+
+
-
-
III
III
2
acute posterior wall, apical infarction
Injury potential in
Figure 12–20
.
Same day
1 week
2 weeks
1 year
present on the first day after the infarction and still slightly present
tion, demonstrating disappearance of the injury potential that is
Recovery of the myocardium after moderate posterior wall infarc-
Figure 12–21
at 1 week.

would not begin at the apex as it normally does.
ened action potential, repolarization of the ventricles
mally short period of depolarization, that is, a short-
of T Wave Abnormalities
of the Ventricular Muscle as a Cause
Shortened Depolarization in Portions
delayed, the T wave is almost always of opposite polar-
trocardiogram. Thus, when conduction of the depolar-
oping. In other words, the mean axis of the T wave is
the left ventricle at the time that the T wave is devel-
to repolarize long before the left ventricle; this causes
from each other. Therefore, the right ventricle begins
However, the refractory periods of the right and left
second after depolarization of the right ventricle,
resulting from left bundle branch block. This causes
delayed conduction in the left ventricle
complex is considerably prolonged. The reason for this
Referring back to Figure 12–14, note that the QRS
Characteristics of the T Wave
Depolarization Wave on the
Effect of Slow Conduction of the
repolarization does not occur. Several factors can
of the intraventricular surfaces. That is, the T wave
Earlier in the chapter, it was pointed out that the T
Abnormalities in the T Wave
areas of the heart during diastole.
toris, because the coronary insufficiency becomes great
appears.
but as soon as he or she overworks the heart, the pain
Usually, no pain is felt as long as the person is quiet,
the left neck area and down the left arm. The pain typ-
of the upper chest. This pain usually also radiates into
“Angina pectoris”
Current of Injury in Angina Pectoris.
nent Q waves, for instance), decreased voltage, and
cases of old cardiac infarction. Local loss of muscle and
These configurations are certainly not found in all
apical part of the ventricle.
the left ventricle, but in posterior infarction, a Q wave
called the “ideal” configurations of the QRS complex
acute heart attack. The records show what might be
and leads I and
Figure 12–22 shows
ischemia exists, particularly during bouts of exercise
muscle dies, but if the muscle does not die, it will con-
coronary blood supply. Often, some of the heart
tion, the infarcted area never redevelops adequate
Conversely, in some patients with coronary infarc-
collateral coronary blood flow
infarction of moderate degree, showing that the
does not change greatly during the next year. This
3 weeks, it is gone. After that, the electrocardiogram
injury potential has diminished considerably, and after
the S-T segment). However, after about 1 week, the
acute attack (T-P segment displaced positively from
From this electrocardiogram, one can see that the
week later, 3 weeks later, and finally 1 year later.
Electrocardiographic Interpretation of Cardiac Muscle and Coronary Blood Flow Abnormalities
Chapter 12
145
injury potential is strong immediately after the
is the usual recovery pattern after acute cardiac
new
develops enough
to re-establish appropriate nutrition to most of the
infarcted area.
tinue to show an injury potential as long as the
when the heart is overloaded.
Old Recovered Myocardial Infarction.
leads I and III after anterior infarction
III after posterior infarction about 1 year after the
in these types of recovered myocardial infarction.
Usually a Q wave has developed at the beginning of
the QRS complex in lead I in anterior infarction
because of loss of muscle mass in the anterior wall of
has developed at the beginning of the QRS complex
in lead III because of loss of muscle in the posterior
local points of cardiac signal conduction block can
cause very bizarre QRS patterns (especially promi-
QRS prolongation.
means pain from the heart felt in the pectoral regions
ically is caused by moderate ischemia of the heart.
An injury potential sometimes appears in the elec-
trocardiogram during an attack of severe angina pec-
enough to prevent adequate repolarization of some
wave is normally positive in all the standard bipolar
limb leads and that this is caused by repolarization of
the apex and outer surfaces of the ventricles ahead
becomes abnormal when the normal sequence of
change this sequence of repolarization.
prolongation is
the left ventricle to become depolarized about 0.08
which gives a strong mean QRS vector to the left.
ventricular muscle masses are not greatly different
strong positivity in the right ventricle and negativity in
now deviated to the right, which is opposite the mean
electrical axis of the QRS complex in the same elec-
ization impulse through the ventricles is greatly
ity to that of the QRS complex.
If the base of the ventricles should exhibit an abnor-
Anterior
I
Q
III
Posterior
I
Q
III
infarction.
anterior wall infarction and a Q wave in lead III in posterior wall
occurred about 1 year previously, showing a Q wave in lead I in
Electrocardiograms of anterior and posterior wall infarctions that
Figure 12–22
liest signs of digitalis toxicity.
is shown in Figure 12–24. Therefore, changes in the T
or more of the electrocardiographic leads. A biphasic
wave inversion or biphasic T waves, may occur in one
other parts. As a result, nonspecific changes, such as T
given, depolarization duration in one part of the ven-
contraction. But when overdosages of digitalis are
insufficiency to increase the strength of cardiac muscle
22, digitalis is a drug that can be used during coronary
Effect of Digitalis on the T Wave.
ate coronary insufficiency.
tion to the rest of the heart, caused by mild to moder-
inversion, for instance, or a biphasic wave—is often
cific, because any change in the T wave in any lead—
waves. The changes in the T waves need not be spe-
trocardiogram, noting whether changes occur in the T
One means for detecting mild coronary insufficiency
exercise.
or relative coronary insufficiency that occurs during
gressive coronary occlusion; acute coronary occlusion;
place. The ischemia might result from chronic, pro-
As a result, definite changes in the T wave can take
decreases out of proportion to that in other portions.
area of the heart, the depolarization period of this area
sium channels. When the ischemia occurs in only one
shortening of depolarization of cardiac muscle,
Mild ischemia
in Figure 12–23.
extent of changing the entire T wave polarity, as shown
cause marked changes in the T wave, even to the
Thus, the simple fact that the base of the ventricles has
leads would be negative rather than the usual positive.
tion. Consequently, the T wave in all three standard
heart, opposite to the standard vector of repolariza-
ahead of the apex, and the vector of repolarization
Instead, the base of the ventricles would repolarize
146
Unit III
The Heart
would point from the apex toward the base of the
a shortened period of depolarization is sufficient to
is by far the most common cause of
because this increases current flow through the potas-
is to have the patient exercise and to record the elec-
evidence enough that some portion of the ventricular
muscle has a period of depolarization out of propor-
As discussed in Chapter
tricles may be increased out of proportion to that of
T wave caused by excessive administration of digitalis
wave during digitalis administration are often the ear-
References
See references for Chapter 13.
T
T
T
T
Inverted T wave resulting from mild
Figure 12–23
ischemia at the apex of the
ventricles.
T
T
Figure 12–24
Biphasic T wave caused by digitalis toxicity.