
parallel with one another.
separate individual cardiac muscle cells from one another. That is, cardiac
in Figure 9–2 are called
The dark areas crossing the cardiac muscle fibers
cardiac muscle is quite different from skeletal muscle, as we shall see.
same manner as occurs in skeletal muscle (see Chapter 6). But in other ways,
almost identical to those found in skeletal muscle; these fila-
muscle. Further, cardiac muscle has typical myofibrils that contain
recombining, and then spreading again. One also notes immediately from this
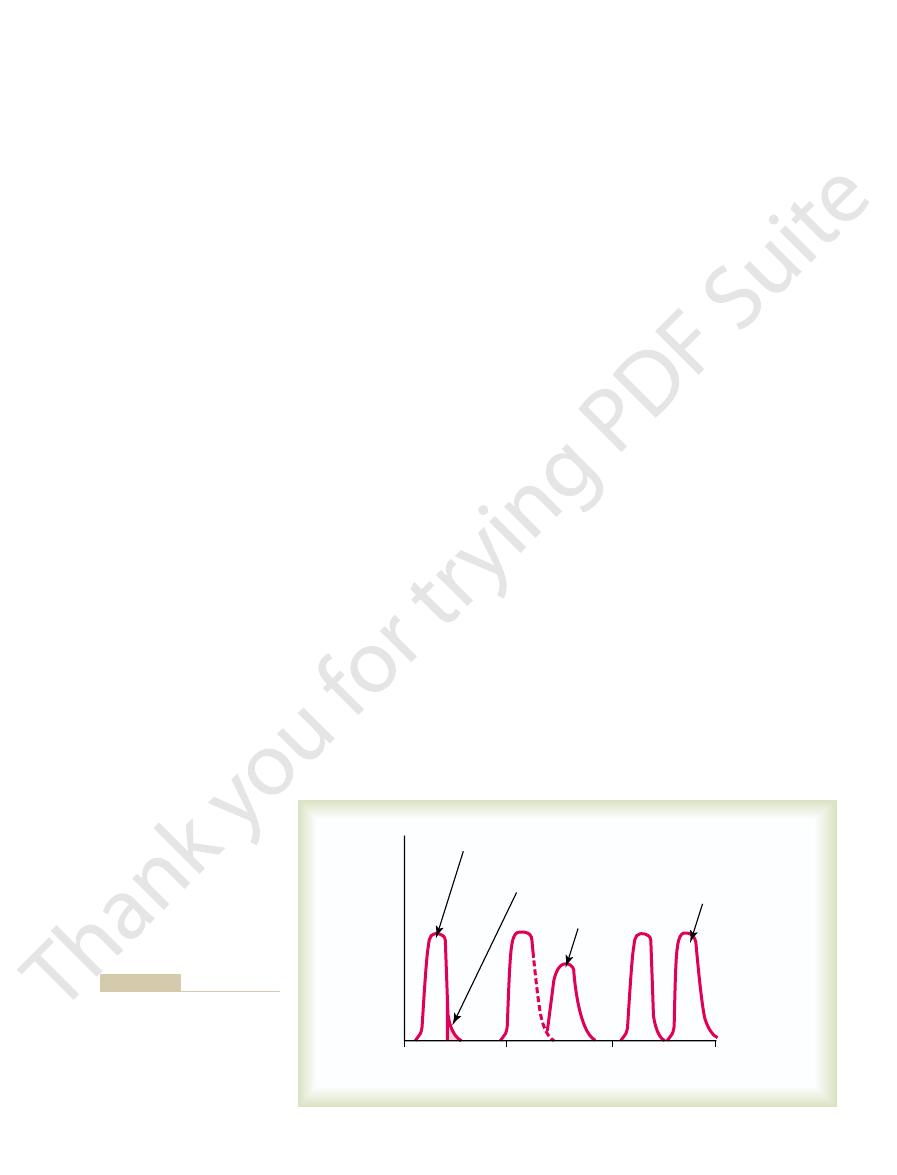
ing cardiac muscle fibers arranged in a latticework, with the fibers dividing,
Figure 9–2 shows a typical histological picture of cardiac muscle, demonstrat-
Physiologic Anatomy of Cardiac Muscle
action potentials through the heart, providing an excitatory system that controls
they contain few contractile fibrils; instead, they exhibit either automatic rhyth-
tal muscle, except that the duration of contraction is much longer. Conversely,
fibers. The
tricular muscle,
atrial muscle, ven-
The heart is composed of three major types of cardiac muscle:
Physiology of Cardiac Muscle
operates as a pump, beginning with the special features of heart muscle itself.
system is explained in Chapter 10. In this chapter, we explain how the heart
the heart muscle to cause the heart’s rhythmical beat. This rhythmical control
tractions called cardiac rhythmicity, transmitting action potentials throughout
ventricle.
helping to move blood into the ventricle. The ventricles then supply the main
atrium is a weak primer pump for the ventricle,
ventricle.
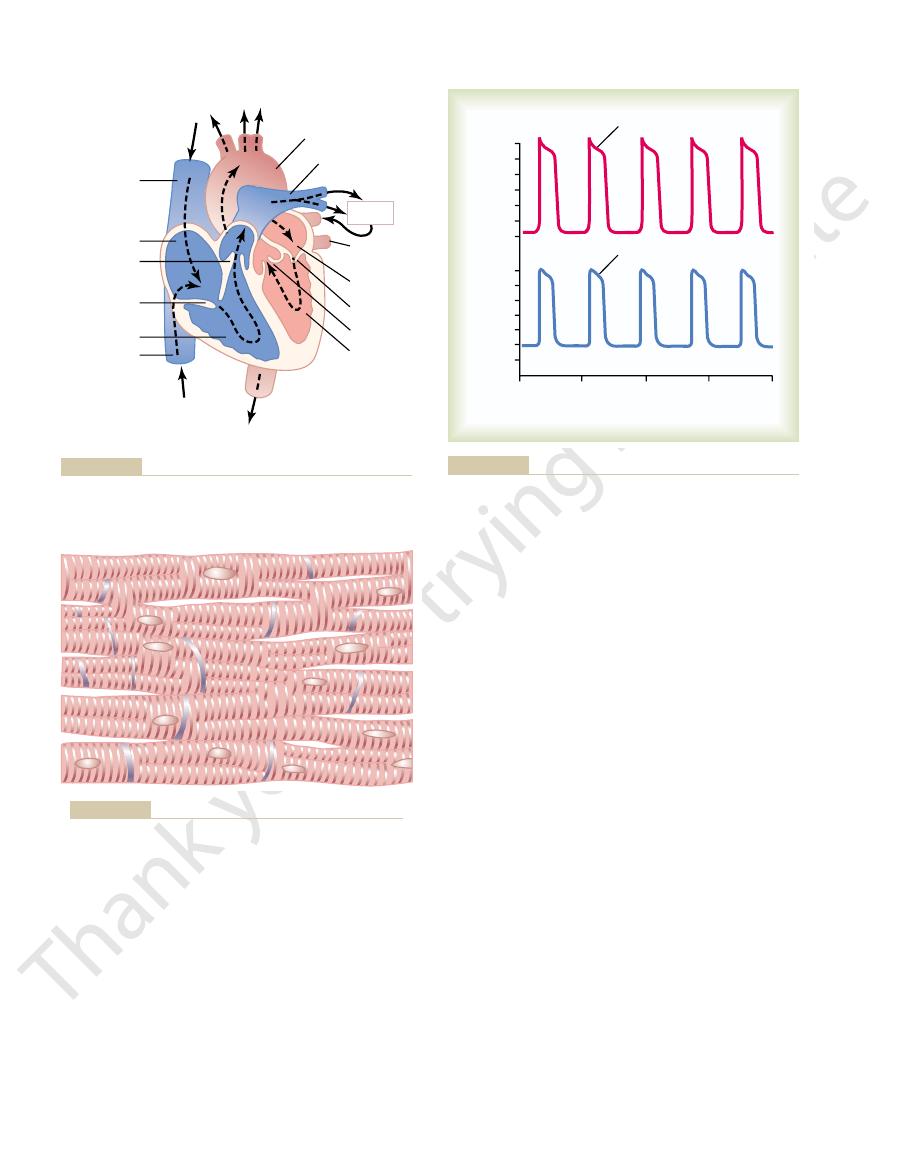
turn, each of these hearts is a pulsatile two-chamber
that pumps blood through the peripheral organs. In
that pumps blood through the lungs, and a
9–1, is actually two separate pumps: a
and circulatory system. The heart, shown in Figure
With this chapter we begin discussion of the heart
Heart Valves
Heart Muscle; The Heart as
C
H
A
P
T
E
R
9
103
a Pump and Function of the
right heart
left heart
pump composed of an atrium and a
Each
pumping force that propels the blood either (1) through the pulmonary circu-
lation by the right ventricle or (2) through the peripheral circulation by the left
Special mechanisms in the heart cause a continuing succession of heart con-
and specialized excitatory and conductive muscle
atrial and ventricular types of muscle contract in much the same way as skele-
the specialized excitatory and conductive fibers contract only feebly because
mical electrical discharge in the form of action potentials or conduction of the
the rhythmical beating of the heart.
figure that cardiac muscle is striated in the same manner as in typical skeletal
actin and
myosin filaments
ments lie side by side and slide along one another during contraction in the
Cardiac Muscle as a Syncytium.
intercalated discs; they are actually cell membranes that
muscle fibers are made up of many individual cells connected in series and in
long in cardiac muscle as in skeletal muscle.
the end of the plateau by abrupt repolarization. The
as shown in the figure, followed at
spike,
millivolts, during each beat. After the initial
between beats to a slightly positive value, about
85 millivolts,
from a very negative value, about
volts, which means that the intracellular potential rises
fiber, shown in Figure 9–3, averages about 105 milli-
The
Action Potentials in Cardiac Muscle
important for effectiveness of heart pumping.
short time ahead of ventricular contraction, which is
functional syncytiums allows the atria to contract a
This division of the muscle of the heart into two
A-V bundle,
tissue. Instead, they are conducted only by way of a
the ventricular syncytium directly through this fibrous
tials are not conducted from the atrial syncytium into
ings between the atria and ventricles. Normally, poten-
tutes the walls of the two ventricles. The atria are sepa-
two atria, and the
The heart actually is composed of two syncytiums:
throughout the latticework interconnections.
spreads to all of them, spreading from cell to cell
of these cells becomes excited, the action potential
past the intercalated discs. Thus, cardiac muscle is a
the cardiac muscle fibers, so that action potentials
from a functional point of view, ions move with ease
allow almost totally free diffusion of ions. Therefore,
able “communicating” junctions (gap junctions) that
104
Unit III
The Heart
At each intercalated disc the cell membranes fuse
with one another in such a way that they form perme-
in the intracellular fluid along the longitudinal axes of
travel easily from one cardiac muscle cell to the next,
syncytium of many heart muscle cells in which the
cardiac cells are so interconnected that when one
the atrial syncytium that constitutes the walls of the
ventricular syncytium that consti-
rated from the ventricles by fibrous tissue that
surrounds the atrioventricular (A-V) valvular open-
specialized conductive system called the
a bundle of conductive fibers several millimeters in
diameter that is discussed in detail in Chapter 10.
action potential recorded in a ventricular muscle
-
+20
the
membrane remains depolarized for about 0.2 second,
exhibiting a plateau
presence of this plateau in the action potential causes
ventricular contraction to last as much as 15 times as
Aorta
Pulmonary artery
Inferior
vena cava
Superior
vena cava
Right ventricle
Tricuspid
valve
Pulmonary
valve
Right atrium
Pulmonary
vein
Left atrium
Mitral valve
Aortic valve
Left
ventricle
Lungs
HEAD AND UPPER EXTREMITY
TRUNK AND LOWER EXTREMITY
chambers and heart valves.
Structure of the heart, and course of blood flow through the heart
Figure 9–1
“Syncytial,” interconnecting nature of cardiac muscle fibers.
Figure 9–2
Ventricular muscle
1
2
3
4
Millivolts
0
+20
–100
– 80
– 60
– 40
– 20
0
+20
– 60
– 40
– 20
–100
– 80
Seconds
0
Purkinje fiber
Plateau
Plateau
microelectrodes.
and from a ventricular muscle fiber, recorded by means of
Rhythmical action potentials (in millivolts) from a Purkinje fiber
Figure 9–3
There is an additional
ventricle is 0.25 to 0.30 second, which is about the
cardiac muscle. The normal refractory period of the
the left in Figure 9–4, during which a normal cardiac
period of the heart is the interval of time, as shown to
during the action potential. Therefore, the refractory
all excitable tissue, is refractory to restimulation
Cardiac muscle, like
Refractory Period of Cardiac Muscle.
as explained in Chapter 10.
system, which allows reasonably rapid conduction of
tal muscle fibers. The velocity of conduction in the
about 0.3 to 0.5 m/sec, or about
The veloci-
Velocity of Signal Conduction in Cardiac Muscle.
membrane potential to its resting level, thus ending
potassium ions also increases rapidly; this rapid loss of
sodium ions ceases, the membrane permeability for
the action potential voltage to its resting level. When
noted. Regardless of the cause, the decreased potas-
that does not occur in skeletal muscle. This decreased
about fivefold, an effect
tial, the permeability of the cardiac muscle membrane
is this: Immediately after the onset of the action poten-
The second major functional difference between
plateau phase activate the muscle contractile process,
tial. Further, the calcium ions that enter during this
muscle fiber, and this maintains a prolonged period of
for several tenths of a second. During this time, a large
to open and, even more important, remain open
This second population of channels differs
channels.
channels,
slow calcium
sodium channels
opening of two types of channels: (1) the same
cardiac muscle
is over within another thousandth of a second or so.
closure, repolarization occurs, and the action potential
of a second and then abruptly close. At the end of this
cellular fluid. These channels are called “fast” channels
channels
plateau in cardiac muscle. First, the
were presented in Chapter 5, but they merit summa-
not? The basic biophysical answers to these questions
have a plateau, whereas that of skeletal muscle does
potential of cardiac muscle so long, and why does it
this point, we must ask the questions: Why is the action
Heart Muscle; The Heart as a Pump and Function of the Heart Valves
Chapter 9
105
What Causes the Long Action Potential and the Plateau?
At
rizing here as well.
At least two major differences between the mem-
brane properties of cardiac and skeletal muscle
account for the prolonged action potential and the
action potential of
skeletal muscle is caused almost entirely by sudden
opening of large numbers of so-called fast sodium
that allow tremendous numbers of sodium
ions to enter the skeletal muscle fiber from the extra-
because they remain open for only a few thousandths
In
, the action potential is caused by
fast
as those in skeletal muscle and (2)
another entirely different population of
which are also called calcium-sodium
from the fast sodium channels in that they are slower
quantity of both calcium and sodium ions flows
through these channels to the interior of the cardiac
depolarization, causing the plateau in the action poten-
while the calcium ions that cause skeletal muscle con-
traction are derived from the intracellular sarcoplas-
mic reticulum.
cardiac muscle and skeletal muscle that helps account
for both the prolonged action potential and its plateau
for potassium ions decreases
potassium permeability may result from the excess
calcium influx through the calcium channels just
sium permeability greatly decreases the outflux of
positively charged potassium ions during the action
potential plateau and thereby prevents early return of
the slow calcium-sodium channels do close at the end
of 0.2 to 0.3 second and the influx of calcium and
potassium from the fiber immediately returns the
the action potential.
ty of conduction of the excitatory action potential
signal along both atrial and ventricular muscle fibers is
1
/
250
the velocity in very
large nerve fibers and about
1
/
10
the velocity in skele-
specialized heart conductive system—in the Purkinje
fibers—is as great as 4 m/sec in most parts of the
the excitatory signal to the different parts of the heart,
impulse cannot re-excite an already excited area of
duration of the prolonged plateau action potential.
relative refractory period of
1
2
3
Seconds
0
Relative refractory
period
Refractory period
Early premature
contraction
Later premature
contraction
Force of contraction
Note that premature contractions
effect of premature contraction.
relative refractory period, plus the
tion of the refractory period and
Force of ventricular heart muscle
Figure 9–4
contraction, showing also dura-
do not cause wave summation, as
occurs in skeletal muscle.

depicts the changes in left ventricular volume, the fifth
tricle, and left atrium, respectively. The fourth curve
curves show the pressure changes in the aorta, left ven-
cardiac cycle for the left side of the heart.The top three
Figure 9–5 shows the different events during the
systole.
diastole,
The cardiac cycle consists of a period of relaxation
power for moving blood through the body’s vascular
for the ventricles, and
before the strong ventricular contraction begins. Thus,
traction, thereby pumping blood into the ventricles
cardiac impulse from the atria into the ventricles. This
system from the atria into the ventricles, there is a
and then through the A-V bundle into the ventricles.
opening of the superior vena cava, and the action
, as explained in Chapter 10. This node is located
Each cycle is initiated by sponta-
cardiac cycle.
The cardiac events that occur from the beginning of
The Cardiac Cycle
tricular muscle.
action potential ends. Therefore, the duration of con-
comes along.
and the T tubule–extracellular fluid space. As a result,
the muscle fiber is suddenly cut off, and the calcium
potential, the influx of calcium ions to the interior of
the skeletal muscle fiber itself.)
(By way of contrast, the strength of skeletal muscle
tubule system—that is, the availability of calcium ions
Consequently, the quantity of calcium ions in the T
interstitium to percolate through the T tubules as well.
extracellular spaces surrounding the cells, allowing the
this is that the openings of the T tubules pass directly
calcium ions in the extracellular fluids. The reason for
The strength of contraction of cardiac muscle
when a T tubule action potential appears.
store of calcium ions, keeping these always available
means a volume 25 times as great. Also, inside the T
great as that of the skeletal muscle tubules, which
calcium to provide full contraction. Conversely, the T
without this extra calcium from the T tubules, the
selves at the time of the action potential. Indeed,
diffuses into the sarcoplasm from the T tubules them-
reticulum, a large quantity of extra calcium ions also
there is a second effect that is quite different. In addi-
coupling is the same as that for skeletal muscle, but
Thus far, this mechanism of excitation-contraction
myosin filaments along one another; this produces the
another few thousandths of a second, these calcium
muscle sarcoplasm from the sarcoplasmic reticulum. In
(T) tubules. The T tubule action potentials in turn act
tial passes over the cardiac muscle membrane, the
As is true for skeletal muscle, when an action poten-
for skeletal muscle in Chapter 7. Once again, there are
the myofibrils of muscle to contract. This was discussed
The term “excitation-contraction coupling” refers to
Transverse Tubules
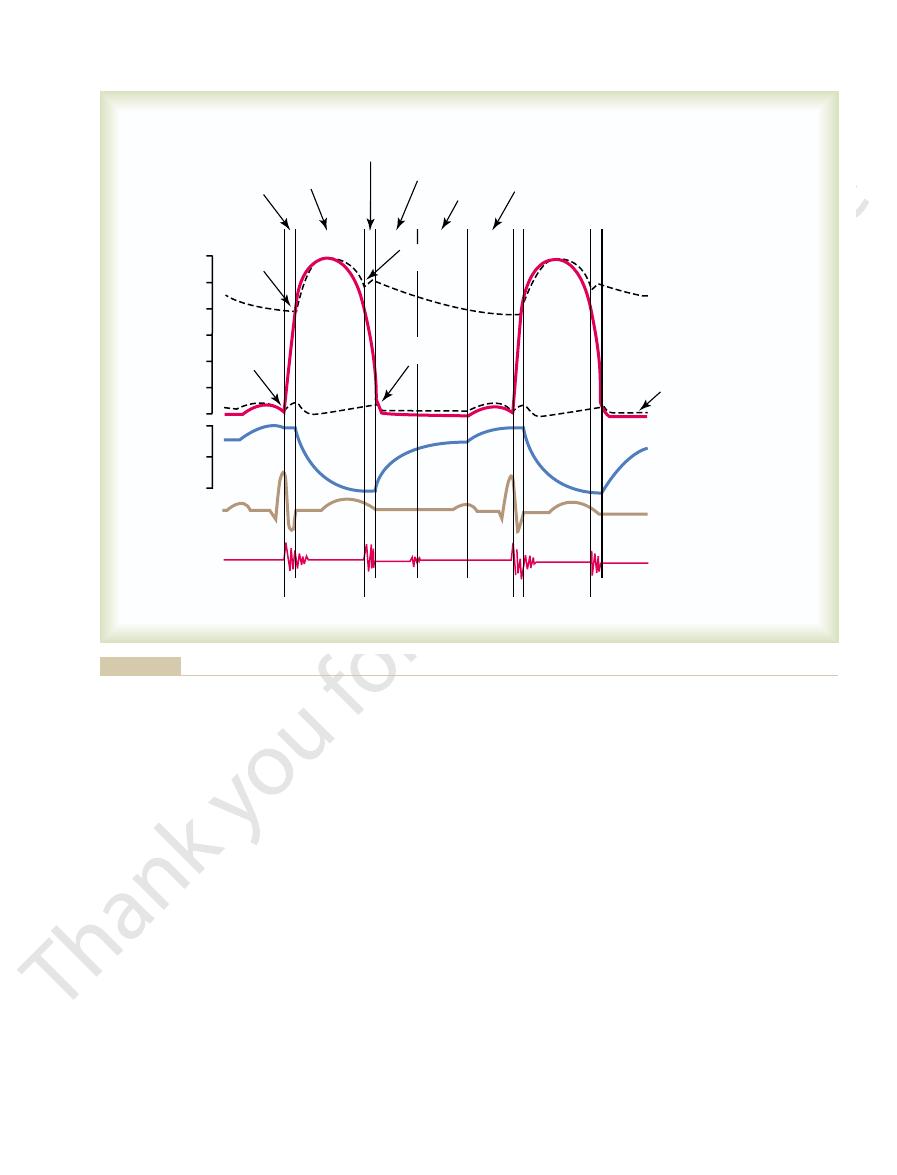
second example of Figure 9–4. The refractory period
strated by the early “premature” contraction in the
excited by a very strong excitatory signal, as demon-
106
Unit III
The Heart
about 0.05 second during which the muscle is more dif-
ficult than normal to excite but nevertheless can be
of atrial muscle is much shorter than that for the ven-
tricles (about 0.15 second for the atria compared with
0.25 to 0.30 second for the ventricles).
Excitation-Contraction Coupling—Function
of Calcium Ions and the
the mechanism by which the action potential causes
differences in this mechanism in cardiac muscle that
have important effects on the characteristics of cardiac
muscle contraction.
action potential spreads to the interior of the cardiac
muscle fiber along the membranes of the transverse
on the membranes of the longitudinal sarcoplasmic
tubules to cause release of calcium ions into the
ions diffuse into the myofibrils and catalyze the chemi-
cal reactions that promote sliding of the actin and
muscle contraction.
tion to the calcium ions that are released into the
sarcoplasm from the cisternae of the sarcoplasmic
strength of cardiac muscle contraction would be
reduced considerably because the sarcoplasmic re-
ticulum of cardiac muscle is less well developed than
that of skeletal muscle and does not store enough
tubules of cardiac muscle have a diameter 5 times as
tubules is a large quantity of mucopolysaccharides that
are electronegatively charged and bind an abundant
for diffusion to the interior of the cardiac muscle fiber
depends to a great extent on the concentration of
through the cardiac muscle cell membrane into the
same extracellular fluid that is in the cardiac muscle
to cause cardiac muscle contraction—depends to a
great extent on the extracellular fluid calcium ion
concentration.
contraction is hardly affected by moderate changes in
extracellular fluid calcium concentration because
skeletal muscle contraction is caused almost entirely
by calcium ions released from the sarcoplasmic retic-
ulum inside
At the end of the plateau of the cardiac action
ions in the sarcoplasm are rapidly pumped back out of
the muscle fibers into both the sarcoplasmic reticulum
the contraction ceases until a new action potential
Duration of Contraction.
Cardiac muscle begins to contract
a few milliseconds after the action potential begins and
continues to contract until a few milliseconds after the
traction of cardiac muscle is mainly a function of the
duration of the action potential, including the plateau—
about 0.2 second in atrial muscle and 0.3 second in ven-
one heartbeat to the beginning of the next are called
the
neous generation of an action potential in the sinus
node
in the superior lateral wall of the right atrium near the
potential travels from here rapidly through both atria
Because of this special arrangement of the conducting
delay of more than 0.1 second during passage of the
allows the atria to contract ahead of ventricular con-
the atria act as primer pumps
the ventricles in turn provide the major source of
system.
Diastole and Systole
called
during which the heart fills with blood,
followed by a period of contraction called
ventricles. Therefore, the atria simply function as
before the atria contract. Then, atrial contraction
into the atria; about 80 per cent of the blood flows
Function of the Atria as Primer Pumps
fibers begin to relax. Therefore, the T wave occurs
electrocardiogram. This represents the stage of repo-
ventricular T wave
Finally, one observes the
lar systole.
rising, as also shown in the figure. Therefore, the QRS
tion of the ventricles, which initiates contraction of the
About 0.16 second after the onset of the P wave, the
P wave.
traction, which causes a slight rise in the atrial pres-
through the atria, and this is followed by atrial con-
The
the surface of the body.
12, and 13. They are electrical voltages generated by
T waves,
R, S,
P, Q,
The electrocardiogram in Figure 9–5 shows the
Relationship of the Electrocardiogram
the heart—mainly by the heart valves—as it pumps. It
gram, which is a recording of the sounds produced by
the electrocardiogram, and the sixth a phonocardio-
Heart Muscle; The Heart as a Pump and Function of the Heart Valves
Chapter 9
107
is especially important that the reader study in detail
this figure and understand the causes of all the events
shown.
to the Cardiac Cycle
and
which are discussed in Chapters 11,
the heart and recorded by the electrocardiograph from
P wave is caused by spread of depolarization
sure curve immediately after the electrocardiographic
QRS waves appear as a result of electrical depolariza-
ventricles and causes the ventricular pressure to begin
complex begins slightly before the onset of ventricu-
in the
larization of the ventricles when the ventricular muscle
slightly before the end of ventricular contraction.
Blood normally flows continually from the great veins
directly through the atria into the ventricles even
usually causes an additional 20 per cent filling of the
1st
2nd
3rd
120
100
Pressure (mm Hg)
80
60
40
20
0
130
90
Volume (ml)
50
Systole
Systole
Diastole
Q
S
T
R
P
a
c
v
Phonocardiogram
Electrocardiogram
Ventricular volume
Ventricular pressure
Atrial pressure
Aortic pressure
A-V valve
opens
A-V valve
closes
Aortic valve
closes
Aortic
valve
opens
Isovolumic
contraction
Ejection
Isovolumic
relaxation
Rapid inflow
Diastasis
Atrial systole
ventricular volume, the electrocardiogram, and the phonocardiogram.
aortic pressure,
Events of the cardiac cycle for left ventricular function, showing changes in left atrial pressure, left ventricular pressure,
Figure 9–5

volume, the stroke volume output can be increased to
milliliters in the healthy heart. By both increasing the
into the ventricles during diastole, the ventricular end-
liters. Conversely, when large amounts of blood flow
When the heart contracts strongly, the end-systolic
The fraction of the end-diastolic
end-systolic volume.
in each ventricle, about 40 to 50 milliliters, is called the
The remaining volume
the volume decreases about 70 milliliters, which is
Then, as the ventricles empty during systole,
volume.
120 milliliters. This volume is called the
During diastole, normal filling of the ventricles
End-Diastolic Volume, End-Systolic Volume, and Stroke Volume
new cycle of ventricular pumping.
diastolic levels. Then the A-V valves open to begin a
During this period, the intraven-
isovolumic
change, giving rise to the period of
relax, even though the ventricular volume does not
to 0.06 second, the ventricular muscle continues to
aortic and pulmonary valves closed. For another 0.03
push blood back toward the ventricles, which snaps the
to decrease rapidly. The elevated pressures in the dis-
systole, ventricular relaxation begins suddenly, allow-
slow ejection.
and the last two thirds, the
thirds. Therefore, the first third is called the
ately, blood begins to pour out of the ventricles, with
pressures push the semilunar valves open. Immedi-
lar pressure slightly above 8 mm Hg), the ventricular
rises slightly above 80 mm Hg (and the right ventricu-
When the left ventricular pressure
Period of Ejection.
of the muscle fibers is occurring.
there is no emptying. This is called the period of
period, contraction is occurring in the ventricles, but
the aorta and pulmonary artery. Therefore, during this
causing the A-V valves to close. Then an additional
ular pressure rises abruptly, as shown in Figure 9–5,
ately after ventricular contraction begins, the ventric-
Period of Isovolumic (Isometric) Contraction.
Emptying of the Ventricles During Systole
of the filling of the ventricles during each heart cycle.
into the ventricles; this accounts for about 20 per cent
During the last third of diastole, the atria contract
directly into the ventricles.
ventricles; this is blood that continues to empty into
third of diastole. During the middle third of diastole,
The period of rapid filling lasts for about the first
rapid filling of the ventricles.
in Figure 9–5. This is called the
ventricles, as shown by the rise of the left
during ventricular systole immediately push the A-V
again to their low diastolic values, the moderately
because of the closed A-V valves. Therefore, as soon
During ventricular systole, large
Filling of the Ventricles.
Function of the Ventricles as Pumps
causing the v wave to disappear.
contraction is over, the A-V valves open, allowing this
during ventricular contraction. Then, when ventricular
atria from the veins while the A-V valves are closed
contraction; it results from slow flow of blood into the
The
ventricles.
but mainly by bulging of the A-V valves backward
contract; it is caused partly by slight backflow of blood
The
about 7 to 8 mm Hg.
atrial contraction, and the
atrial pressure increases 4 to 6 mm Hg during
is caused by atrial contraction. Ordinarily,
The
v atrial pressure waves,
a, c,
elevations, called the
atrial pressure curve of Figure 9–5, three minor pressure
Pressure Changes in the Atria—The a, c, and v Waves.
develop, especially shortness of breath.
exercises; then acute signs of heart failure occasionally
resting body. Therefore, when the atria fail to function,
effectiveness as much as 20 per cent. However, the
108
Unit III
The Heart
primer pumps that increase the ventricular pumping
heart can continue to operate under most conditions
even without this extra 20 per cent effectiveness
because it normally has the capability of pumping 300
to 400 per cent more blood than is required by the
the difference is unlikely to be noticed unless a person
In the
and
are
noted.
a wave
the right
left atrial pressure increases
c wave occurs when the ventricles begin to
into the atria at the onset of ventricular contraction
toward the atria because of increasing pressure in the
v wave occurs toward the end of ventricular
stored atrial blood to flow rapidly into the ventricles and
amounts of blood accumulate in the right and left atria
as systole is over and the ventricular pressures fall
increased pressures that have developed in the atria
valves open and allow blood to flow rapidly into the
ventricular
volume curve
period of
only a small amount of blood normally flows into the
the atria from the veins and passes through the atria
and give an additional thrust to the inflow of blood
Immedi-
0.02 to 0.03 second is required for the ventricle to build
up sufficient pressure to push the semilunar (aortic
and pulmonary) valves open against the pressures in
iso-
volumic or isometric contraction, meaning that tension
is increasing in the muscle but little or no shortening
about 70 per cent of the blood emptying occurring
during the first third of the period of ejection and the
remaining 30 per cent emptying during the next two
period of
rapid ejection,
period of
Period of Isovolumic (Isometric) Relaxation.
At the end of
ing both the right and left intraventricular pressures
tended large arteries that have just been filled with
blood from the contracted ventricles immediately
or iso-
metric relaxation.
tricular pressures decrease rapidly back to their low
Output.
increases the volume of each ventricle to about 110 to
end-diastolic
called the stroke volume output.
volume that is ejected is called the ejection fraction—
usually equal to about 60 per cent.
volume can be decreased to as little as 10 to 20 milli-
diastolic volumes can become as great as 150 to 180
end-diastolic volume and decreasing the end-systolic
more than double normal.
When listening to the heart with a stethoscope, one does
Sounds to Heart Pumping
Relationship of the Heart
that the pressures are only about one sixth as great, as
are similar to those in the aorta, except
The pressure curves in the
sure of 120 mm Hg (systolic pressure) that occurs in
tolic pressure), which is two thirds the maximal pres-
pressure usually has fallen to about 80 mm Hg (dias-
veins. Before the ventricle contracts again, the aortic
After the aortic valve has closed, the pressure in the
tion of the backflow.
before closure of the valve, followed by sudden cessa-
curve when the aortic valve closes. This is caused by a
the arteries, even during diastole.
stops ejecting blood and the aortic valve closes, the
Next, at the end of systole, after the left ventricle
to about 120 mm Hg.
The entry of blood into the arteries causes the walls
arteries.
cle rises much less rapidly, as shown in Figure 9–5,
Then, after the valve opens, the pressure in the ventri-
sure increases rapidly until the aortic valve opens.
When the left ventricle contracts, the ventricular pres-
stresses.
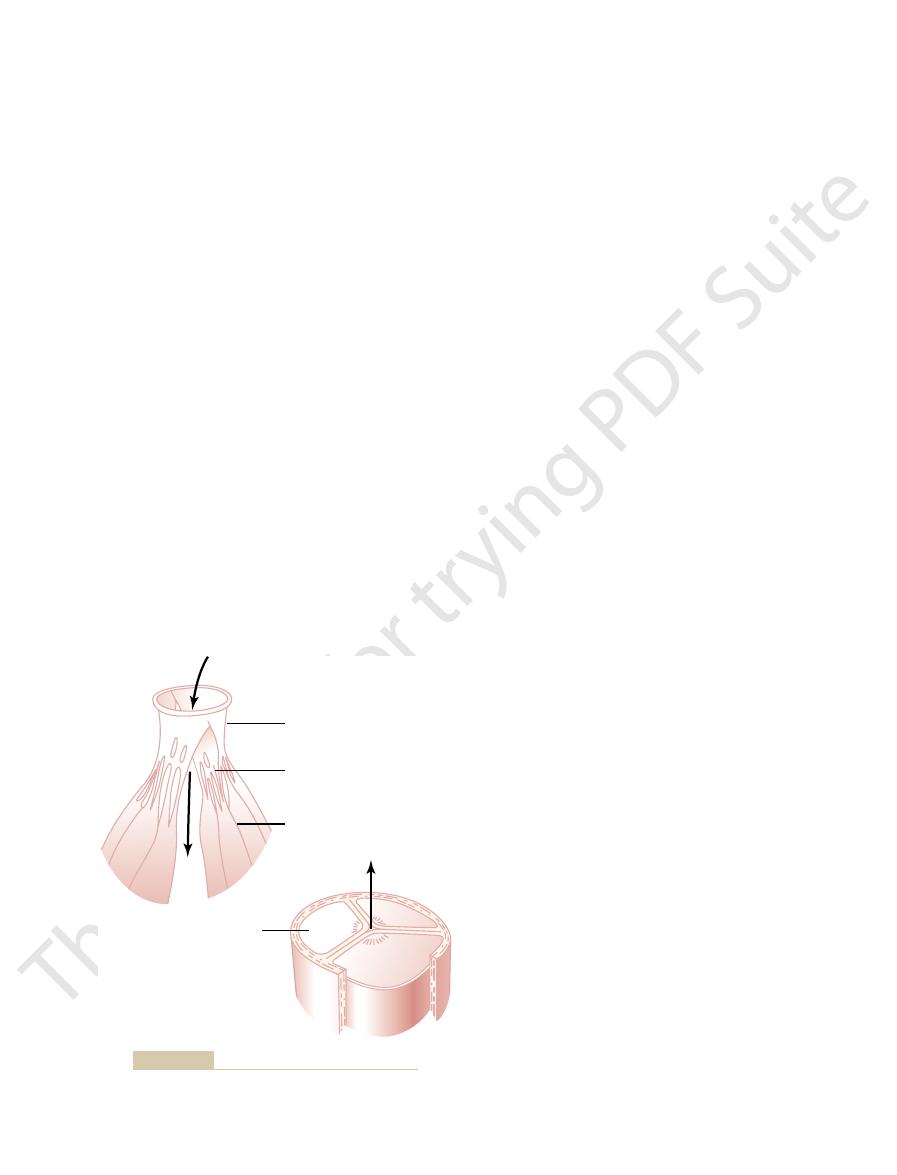
valve at the bottom of Figure 9–6) that they must be
lunar valves. It is obvious from the anatomy of the
the chordae tendineae, which is not true for the semi-
A-V valves. Finally, the A-V valves are supported by
because of the rapid closure and rapid ejection, the
than that through the much larger A-V valves. Also,
of smaller openings, the velocity of blood ejection
much softer closure of the A-V valves. Second, because
valves to snap to the closed position, in contrast to the
ently from the A-V valves. First, the high pressures in
The aortic and pul-
Aortic and Pulmonary Artery Valves.
incapacity.
tricular contraction, sometimes so far that it leaks
paralyzed, the valve bulges far backward during ven-
ventricular contraction. If a chorda tendinea becomes
help the valves to close. Instead, they pull the vanes of
but contrary to what might be expected, they
The papillary
chordae tendineae.
Figure 9–6 also
Function of the Papillary Muscles.
milliseconds.
cause closure, whereas the much heavier semilunar
thin, filmy A-V valves require almost no backflow to
in the forward direction. For anatomical reasons, the
pressure gradient pushes blood backward, and they
That is, they close when a backward
passively.
shown in Figure 9–6 for the left ventricle, close and
teries into the ventricles during diastole. These valves,
ventricles to the atria during systole, and the
The
Atrioventricular Valves.
Function of the Valves
Heart Muscle; The Heart as a Pump and Function of the Heart Valves
Chapter 9
109
A-V valves (the tricuspid
and mitral valves) prevent backflow of blood from the
semilu-
nar valves (the aortic and pulmonary artery valves)
prevent backflow from the aorta and pulmonary ar-
open
open when a forward pressure gradient forces blood
valves require rather rapid backflow for a few
shows papillary muscles that attach to the vanes of the
A-V valves by the
muscles contract when the ventricular walls contract,
do not
the valves inward toward the ventricles to prevent
their bulging too far backward toward the atria during
ruptured or if one of the papillary muscles becomes
severely and results in severe or even lethal cardiac
monary artery semilunar valves function quite differ-
the arteries at the end of systole cause the semilunar
through the aortic and pulmonary valves is far greater
edges of the aortic and pulmonary valves are subjected
to much greater mechanical abrasion than are the
aortic and pulmonary valves (as shown for the aortic
constructed with an especially strong yet very pliable
fibrous tissue base to withstand the extra physical
Aortic Pressure Curve
because blood immediately flows out of the ventricle
into the aorta and then into the systemic distribution
of these arteries to stretch and the pressure to increase
elastic walls of the arteries maintain a high pressure in
A so-called incisura occurs in the aortic pressure
short period of backward flow of blood immediately
aorta decreases slowly throughout diastole because
the blood stored in the distended elastic arteries flows
continually through the peripheral vessels back to the
the aorta during ventricular contraction.
right ventricle and pul-
monary artery
discussed in Chapter 14.
not hear the opening of the valves because this is a
Cusp
Cusp
MITRAL VALVE
AORTIC VALVE
Papillary muscles
Chordae tendineae
Mitral and aortic valves (the left ventricular valves).
Figure 9–6
0 mm Hg. Forty-five milliliters is the amount of
This phase in the volume-
Period of filling.
four phases.
ventricle. It is divided into
of the cardiac cycle
The red lines in Figure 9–7 form a loop
Work Output.
“Volume-Pressure Diagram” During the Cardiac Cycle; Cardiac
80 mm Hg.
ventricle,
by cardiac nerves. For the normal
person’s heart strength and degree of heart stimulation
250 and 300 mm Hg, but this varies widely with each
volumes, the actin and myosin filaments of the cardiac
pressure curve in Figure 9–7, because at these great
some conditions, as demonstrated by the falling systolic
further, the systolic pressure actually decreases under
170 milliliters. Then, as the volume increases still
During ventricular contraction, the “systolic” pres-
increases rapidly, partly because of fibrous tissue in the
Above 150 milliliters, the ventricular diastolic pressure
does not increase greatly. Therefore, up to this volume,
above about 150 milliliters, the “diastolic” pressure
contraction at each volume of filling.
The systolic pressure curve is determined by record-
of the ventricle.
before ventricular contraction occurs, which is the
The diastolic pressure curve is determined by filling
curves.
“systolic pressure.” These curves are volume-pressure
the two curves labeled “diastolic pressure” and
The most important components of the diagram are
ventricle.
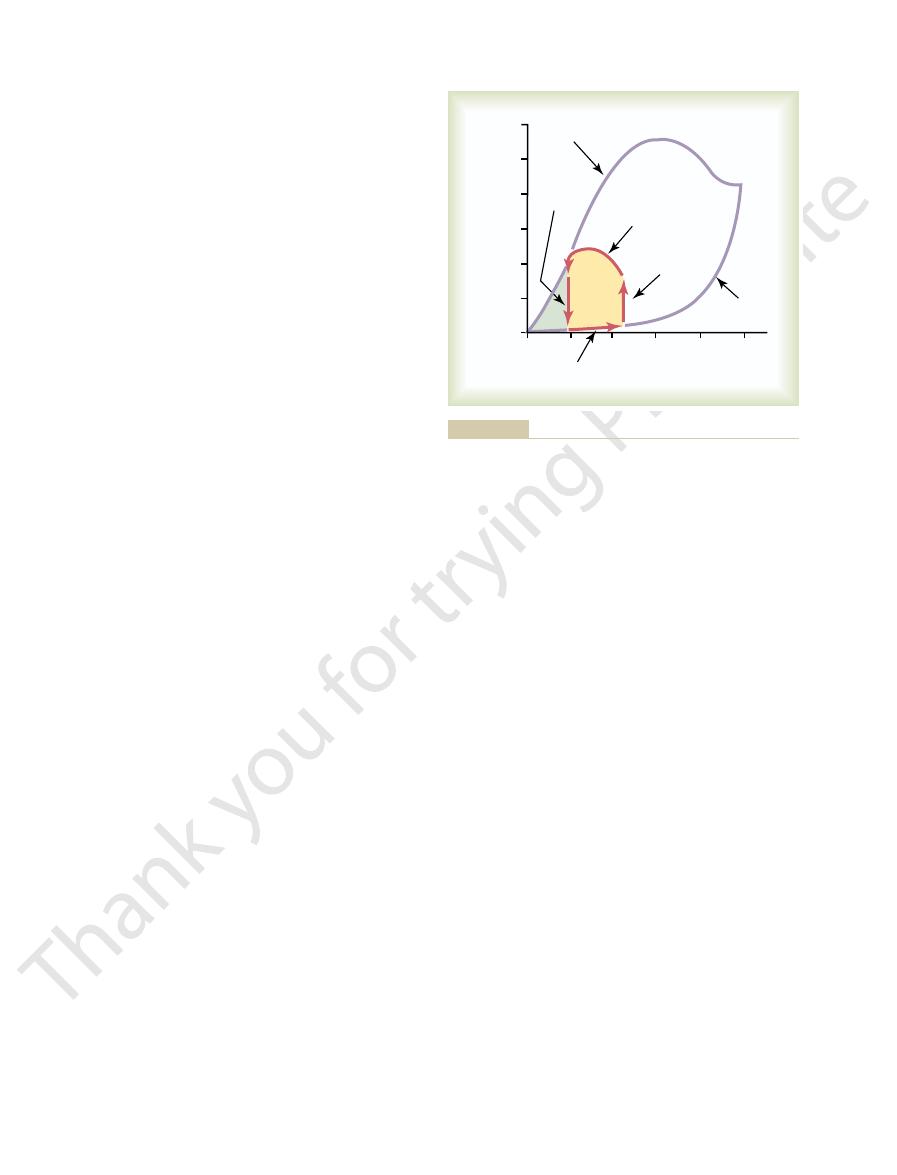
Figure 9–7 shows a diagram that is especially useful in
Graphical Analysis of Ventricular
create kinetic energy of blood flow.
great velocity through the stenosed valve, more than
ditions, such as aortic stenosis, in which blood flows with
total stroke work output. But in certain abnormal con-
Ordinarily, the work output of the left ventricle
that the two ventricles pump. The additional work
energy of blood flow
the aortic and pulmonary valves. This is the
Second, a minor proportion of the energy is used to
This is called
the low-pressure veins to the high-pressure arteries.
Work output of the heart is in two forms. First, by far
times the heart rate per minute.
work in 1 minute; this is equal to the stroke work output
heartbeat while pumping blood into the arteries.
The
Work Output of the Heart
tion to listening to the sounds with the stethoscope.
sounds are discussed more fully in Chapter 23, in rela-
The precise causes of the heart
vibrate for a short period. This sound is called the
because these valves close rapidly, and the surroundings
close at the end of systole, one hears a rapid snap
When the aortic and pulmonary valves
caused by closure of the A-V valves. The vibration is low
When the ventricles contract, one first hears a sound
of sudden pressure changes, giving off sound that travels
However, when the valves close, the vanes of the valves
relatively slow process that normally makes no noise.
110
Unit III
The Heart
and the surrounding fluids vibrate under the influence
in all directions through the chest.
in pitch and relatively long-lasting and is known as the
first heart sound.
second heart sound.
stroke work output of the heart is the amount of
energy that the heart converts to work during each
Minute
work output is the total amount of energy converted to
the major proportion is used to move the blood from
volume-pressure work or external work.
accelerate the blood to its velocity of ejection through
kinetic
component of the work output.
Right ventricular external work output is normally
about one sixth the work output of the left ventricle
because of the sixfold difference in systolic pressures
output of each ventricle required to create kinetic
energy of blood flow is proportional to the mass of
blood ejected times the square of velocity of ejection.
required to create kinetic energy of blood flow is only
about 1 per cent of the total work output of the ventri-
cle and therefore is ignored in the calculation of the
50 per cent of the total work output may be required to
Pumping
explaining the pumping mechanics of the left
the heart with progressively greater volumes of blood
and then measuring the diastolic pressure immediately
end-
diastolic pressure
ing the systolic pressure achieved during ventricular
Until the volume of the noncontracting ventricle rises
blood can flow easily into the ventricle from the atrium.
heart that will stretch no more and partly because the
pericardium that surrounds the heart becomes filled
nearly to its limit.
sure increases even at low ventricular volumes and
reaches a maximum at a ventricular volume of 150 to
muscle fibers are pulled apart far enough that the
strength of each cardiac fiber contraction becomes less
than optimal.
Note especially in the figure that the maximum sys-
tolic pressure for the normal left ventricle is between
right
the maximum systolic pressure is between 60 and
called the volume-pressure diagram
for normal function of the left
Phase I:
pressure diagram begins at a ventricular volume of
about 45 milliliters and a diastolic pressure near
50
100
150
200
250
0
0
Left ventricular volume (ml)
Intraventricular pressure (mm Hg)
250
200
150
100
50
300
Isovolumic
relaxation
Isovolumic
contraction
Systolic pressure
EW
III
IV
I
II
Diastolic
pressure
Period of ejection
Period of filling
normal cardiac cycle. EW, net external work.
changes in intraventricular volume and pressure during the
red lines is the “volume-pressure diagram,” demonstrating
pressure during diastole and systole. Also shown by the heavy
Figure 9–7
Relationship between left ventricular volume and intraventricular

in honor of Frank and
Starling mechanism of the heart,
Frank-
This intrinsic ability of the heart to adapt to increas-
pumps this incoming blood into the arteries, so that it
the right atrium. The heart, in turn, automatically
body controls its own local blood flow, and all the local
That is, each peripheral tissue of the
blood flow into the heart from the veins, which is called
tions, the amount of blood pumped by the heart each
In Chapter 20, we will learn that under most condi-
Intrinsic Regulation of Heart
this amount. The basic means by which the volume
liters of blood each minute. During severe exercise,
When a person is at rest, the heart pumps only 4 to 6
Regulation of Heart Pumping
cent. In heart failure, this can decrease to as low as 5 to
efficiency of the normal heart is between 20 and 25 per
efficiency of cardiac
. The ratio of work output to total chemical
traction, most of the expended chemical energy is con-
energy are discussed in Chapters 67 and 68.
work. The different chemical reactions that liberate this
lactate and glucose. Therefore, the rate of oxygen con-
and, to a lesser extent, of other nutrients, especially
to provide the work of contraction. This energy is
Heart muscle, like skeletal muscle, uses chemical energy
the Heart
for Cardiac Contraction:
Chemical Energy Required
which the ventricle must contract (the afterload), or
ventricle (the preload), the arterial pressure against
heart or circulation, the pressure during filling of the
The importance of the concepts of preload and after-
in the circulation rather than the pressure.)
III curve of the volume-pressure diagram. (Sometimes
artery leading from the ventricle. In Figure 9–7, this cor-
The
For cardiac contraction, the
against which the muscle exerts its contractile force,
tract, which is called the
tile properties of muscle, it is important to specify the
the ventricle contracts with greater pressure, and it
more blood during diastole, it rises much higher because
area of the work diagram becomes much larger. That is,
When the heart pumps large quantities of blood, the
tal studies of cardiac contraction, this diagram is used
the ventricle during its contraction cycle. In experimen-
0 mm Hg.
starting point, with about 45 milliliters of blood
change in volume. Thus, the ventricle returns to its
pressure level. The line labeled “IV” traces this
of the period of ejection, the aortic valve closes, and
Period of isovolumic relaxation.
Phase IV:
labeled “III” traces the changes in volume and
the ventricle into the aorta. Therefore, the curve
more contraction of the ventricle. At the same time,
During ejection, the
Period of ejection.
end of the line labeled “II.”
value of about 80 mm Hg, as depicted by the arrow
to equal the pressure in the aorta, at a pressure
However, the pressure inside the ventricle increases
isovolumic contraction, the volume of the ventricle
Period of isovolumic contraction.
diastolic pressure rising to about 5 mm Hg.
during phase I extends along the line labeled “I,”
milliliters. Therefore, the volume-pressure diagram
end-diastolic volume,
normally increases to about 115 milliliters, called
from the left atrium, the ventricular volume
volume.
Heart Muscle; The Heart as a Pump and Function of the Heart Valves
Chapter 9
111
blood that remains in the ventricle after the
previous heartbeat and is called the end-systolic
As venous blood flows into the ventricle
the
an increase of 70
with the volume increasing to 115 milliliters and the
Phase II:
During
does not change because all valves are closed.
Phase III:
systolic pressure rises even higher because of still
the volume of the ventricle decreases because the
aortic valve has now opened and blood flows out of
systolic pressure during this period of ejection.
At the end
the ventricular pressure falls back to the diastolic
decrease in intraventricular pressure without any
left in the ventricle and at an atrial pressure near
Readers well trained in the basic principles of physics
should recognize that the area subtended by this func-
tional volume-pressure diagram (the tan shaded area,
labeled EW) represents the net external work output of
for calculating cardiac work output.
it extends far to the right because the ventricle fills with
usually extends farther to the left because the ventricle
contracts to a smaller volume—especially if the ventri-
cle is stimulated to increased activity by the sympathetic
nervous system.
Concepts of Preload and Afterload.
In assessing the contrac-
degree of tension on the muscle when it begins to con-
preload, and to specify the load
which is called the afterload.
preload is usually con-
sidered to be the end-diastolic pressure when the ven-
tricle has become filled.
afterload of the ventricle is the pressure in the
responds to the systolic pressure described by the phase
the afterload is loosely considered to be the resistance
load is that in many abnormal functional states of the
both are severely altered from normal.
Oxygen Utilization by
derived mainly from oxidative metabolism of fatty acids
sumption by the heart is an excellent measure of the
chemical energy liberated while the heart performs its
Efficiency of Cardiac Contraction.
During heart muscle con-
verted into heat and a much smaller portion into work
output
energy expenditure is called the
contraction, or simply efficiency of the heart. Maximum
10 per cent.
the heart may be required to pump four to seven times
pumped by the heart is regulated are (1) intrinsic
cardiac regulation of pumping in response to changes
in volume of blood flowing into the heart and (2)
control of heart rate and strength of heart pumping by
the autonomic nervous system.
Pumping—The Frank-Starling
Mechanism
minute is determined almost entirely by the rate of
venous return.
tissue flows combine and return by way of the veins to
can flow around the circuit again.
ing volumes of inflowing blood is called the
blood pumped and increasing the ejection pressure.
as double normal, thereby increasing the volume of
even 250 beats per minute. Also, sympathetic stimula-
rate of 70 beats per minute up to 180 to 200 and, rarely,
Nerves.
per cent by sympathetic stimulation. By contrast, the
(cardiac output)
pressure, the amount of blood pumped each minute
shown in Figure 9–10. For given levels of input atrial
nerves, which abundantly supply the heart, as
The pumping effectiveness of the heart also is con-
Parasympathetic Nerves
Control of the Heart by the Sympathetic and
arteries.
cardiac muscle contraction increase, causing the
pressures, each ventricular volume and strength of
That is, as the ventricles fill in response to higher atrial
expressing the Frank-Starling mechanism of the heart.
Thus,
volume outputs per minute also increase.
atrial pressures increase, the respective ventricular
extrapolated from lower animals. As the right and left
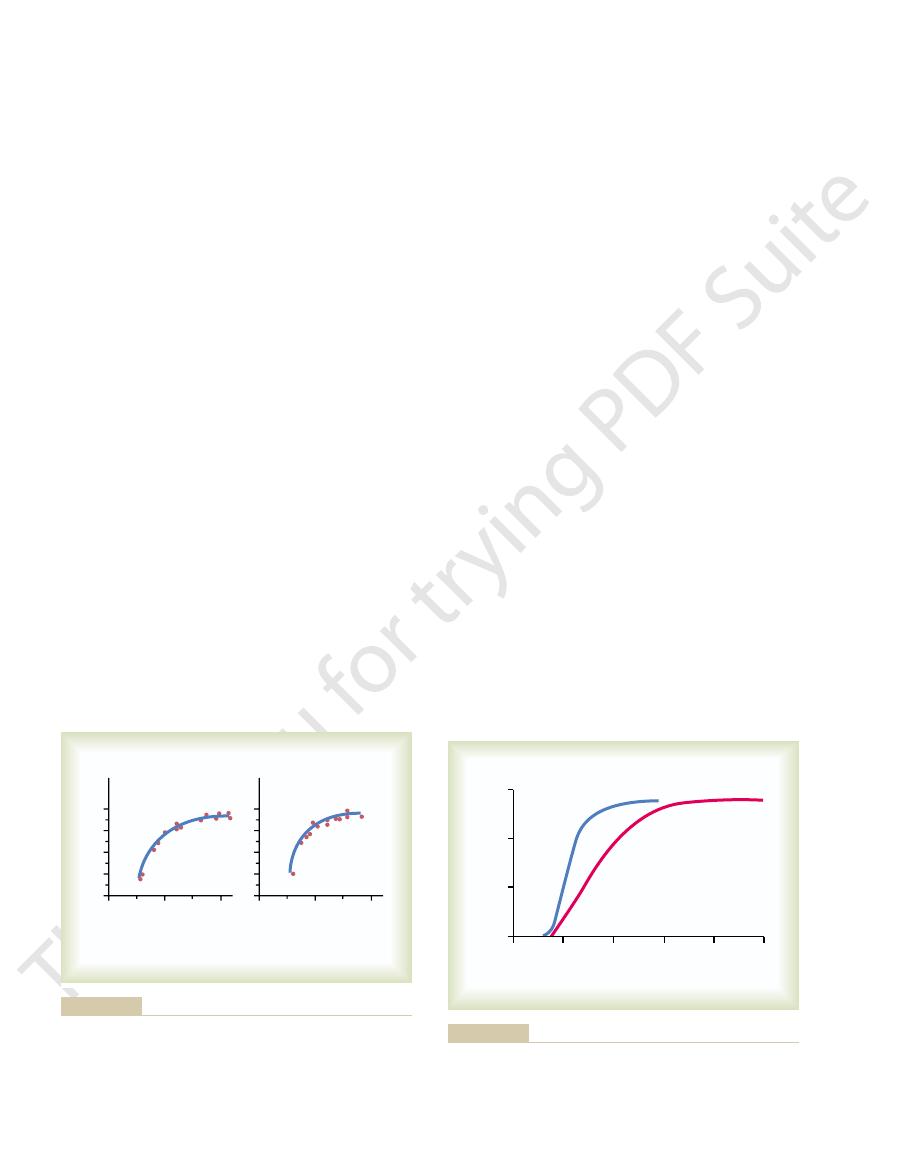
The two curves of this figure represent function of the
ventricular volume output curve.
Figure 9–9 shows another type of ventricular func-
limit of the ventricle’s pumping ability.
pressure for each side of the heart increases, the stroke
stroke work output curve.
as shown in Figures 9–8 and 9–9. Figure
tion curves,
Ventricular Function Curves
tion is much less than that of the Frank-Starling
of blood pumped each minute, although its contribu-
10 to 20 per cent; this, too, helps increase the amount
pumping when its volume is increased. Stretch of the
the heart muscle, still another factor increases heart
6, and is not simply a characteristic of cardiac muscle.
acteristic of all striated muscle, as explained in Chapter
length, to contract with increased work output is char-
This ability of stretched muscle, up to an optimal
pumps the extra blood into the arteries.
because of its increased pumping, automatically
overlap for force generation. Therefore, the ventricle,
length. This in turn causes the muscle to contract with
cles, the cardiac muscle itself is stretched to greater
When an extra amount of blood flows into the ventri-
all the blood that returns to it by the way of the veins.
Within physiologic limits, the heart pumps
the quantity of blood pumped into the aorta. Or, stated
greater the heart muscle is stretched during filling,
cally, the Frank-Starling mechanism means that the
Starling, two great physiologists of a century ago. Basi-
112
Unit III
The Heart
the greater is the force of contraction and the greater
another way:
What Is the Explanation of the Frank-Starling Mechanism?
increased force because the actin and myosin filaments
are brought to a more nearly optimal degree of
In addition to the important effect of lengthening
right atrial wall directly increases the heart rate by
mechanism.
One of the best ways to express the functional ability
of the ventricles to pump blood is by ventricular func-
9–8 shows a type of ventricular function curve called
the
Note that as the atrial
work output for that side increases until it reaches the
tion curve called the
two ventricles of the human heart based on data
ventricular function curves are another way of
heart to pump increased quantities of blood into the
trolled by the sympathetic and parasympathetic
(vagus)
often can be increased more than 100
output can be decreased to as low as zero or almost
zero by vagal (parasympathetic) stimulation.
Mechanisms of Excitation of the Heart by the Sympathetic
Strong sympathetic stimulation can increase
the heart rate in young adult humans from the normal
tion increases the force of heart contraction to as much
10
20
10
20
40
20
30
0
10
Left mean atrial
pressure
(mm Hg)
0
Left ventricular
stroke work
(gram meters)
4
2
3
0
1
Right mean atrial
pressure
(mm Hg)
0
Right ventricular
stroke work
(gram meters)
Sarnoff SJ: Myocardial contractility as described by ventricular
right mean atrial pressures. (Curves reconstructed from data in
ventricular stroke work output
Left and right ventricular function curves recorded from dogs,
Figure 9–8
depicting
as a function of left and
function curves. Physiol Rev 35:107, 1955.)
+ 4
+12
+16
4
+ 8
Ventricular output (L
/min)
Atrial pressure (mm Hg)
0
–
10
5
0
15
Left ventricle
Right ventricle
data obtained in dogs and data from human beings.
for the normal resting human heart as extrapolated from
Approximate normal right and left
Figure 9–9
ventricular volume output
curves
pumping.
process. Therefore, it is to be expected that the con-
marked effect on membrane potentials, and in Chapter
5, it was pointed out that potassium ions have a
Effect of Potassium and Calcium Ions
changes in contractile strength of the heart
changes in heart rate
tion. These changes in output caused by nerve stimu-
given right atrial pressure, the cardiac output increases
The curves of Figure 9–11 demonstrate that at any
tricle; they show the relation between right atrial pres-
function curves of Figure 9–9. However, they represent
function curves. They are similar to the ventricular
Figure 9–11 shows four cardiac
Cardiac Function Curve.
or more.
tion. Nevertheless, the great decrease in heart rate
traction of the heart occurs. This explains the effect of
and not much to the ventricles, where the power con-
The vagal fibers are distributed mainly to the atria
addition, strong vagal stimulation can decrease the
as the parasympathetic stimulation continues. In
few seconds, but then the heart usually “escapes” and
Parasympathetic (Vagal) Stimulation of the Heart.
muscle contraction, thereby decreasing the level of
nervous system is depressed below normal, this
lation. Therefore, when the activity of the sympathetic
extent in the following way: Under normal conditions,
Conversely,
Frank-Starling mechanism already discussed.
fold, in addition to the increased output caused by the
Thus, sympathetic stimulation often can increase the
Heart Muscle; The Heart as a Pump and Function of the Heart Valves
Chapter 9
113
maximum cardiac output as much as twofold to three-
inhibition of the sympathetic nerves to
the heart can decrease cardiac pumping to a moderate
the sympathetic nerve fibers to the heart discharge
continuously at a slow rate that maintains pumping at
about 30 per cent above that with no sympathetic stimu-
decreases both heart rate and strength of ventricular
cardiac pumping as much as 30 per cent below normal.
Strong
stimulation of the parasympathetic nerve fibers in the
vagus nerves to the heart can stop the heartbeat for a
beats at a rate of 20 to 40 beats per minute as long
strength of heart muscle contraction by 20 to 30
per cent.
vagal stimulation mainly to decrease heart rate rather
than to decrease greatly the strength of heart contrac-
combined with a slight decrease in heart contraction
strength can decrease ventricular pumping 50 per cent
Effect of Sympathetic or Parasympathetic Stimulation on the
function of the entire heart rather than of a single ven-
sure at the input of the right heart and cardiac output
from the left ventricle into the aorta.
during increased sympathetic stimulation and
decreases during increased parasympathetic stimula-
lation result both from
and from
because
both change in response to the nerve stimulation.
on Heart Function
In the discussion of membrane potentials in Chapter
6 it was noted that calcium ions play an especially
important role in activating the muscle contractile
centration of each of these two ions in the extracellu-
lar fluids should also have important effects on cardiac
Effect of Potassium Ions.
Excess potassium in the extra-
cellular fluids causes the heart to become dilated and
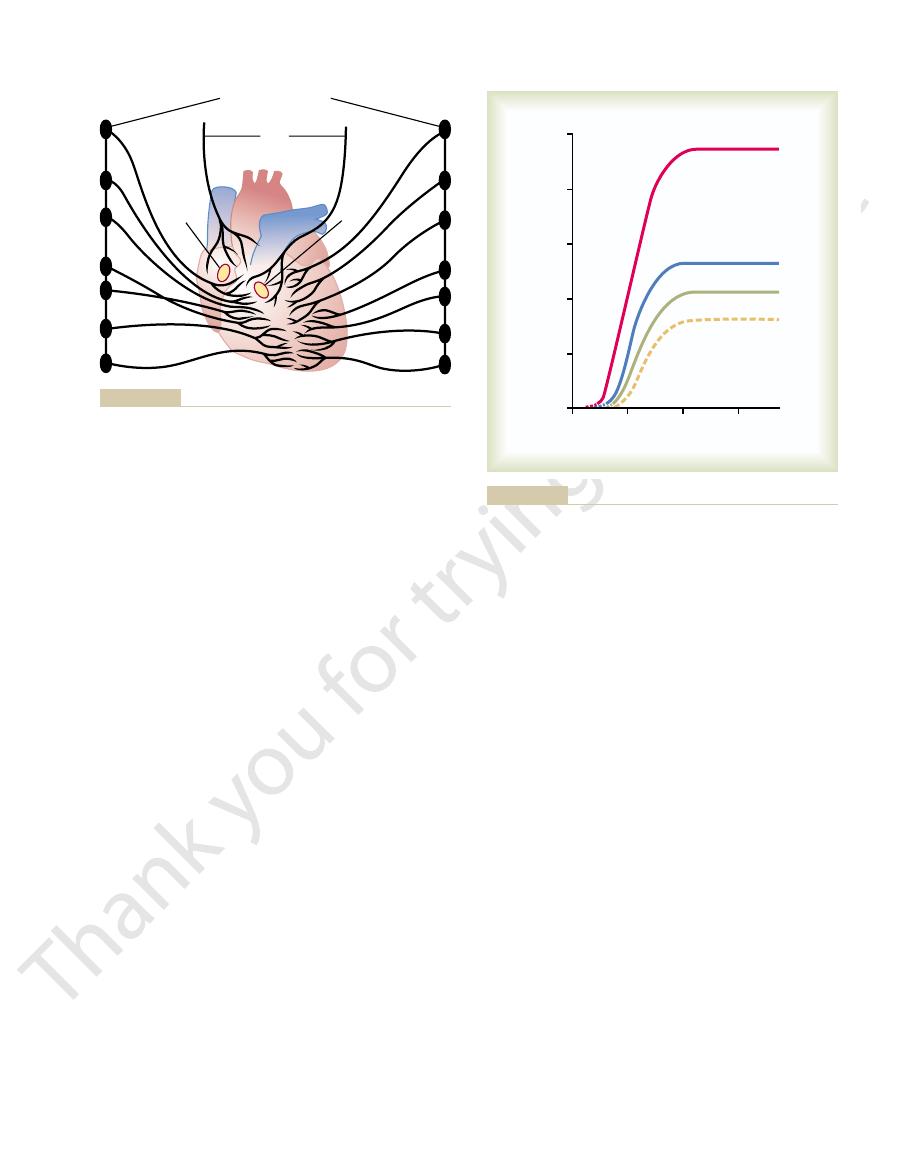
Sympathetic
nerves
Sympathetic
nerves
Vagi
S-A
node
A-V
node
Sympathetic chains
nerves to the heart are parasympathetic nerves.)
Cardiac
Figure 9–10
sympathetic and parasympathetic nerves. (The vagus
4
+ 8
Cardiac output (L
/min)
Right atrial pressure (mm Hg)
0
–
+ 4
10
5
0
20
15
25
Maximum sympathetic
stimulation
Normal sympathetic
stimulation
Zero sympathetic
stimulation
(Parasympathetic
stimulation)
Effect on the cardiac output curve of different degrees of sympa-
Figure 9–11
thetic or parasympathetic stimulation.
York: Oxford University Press, 2002.
sec 2: The Cardiovascular System, vol 1: The Heart. New
Page E, Fozzard HA, Solaro JR: Handbook of Physiology,
Med 10:467, 2004.
Olson EN: A decade of discoveries in cardiac biology. Nat
coupling: a cellular update. Adv Physiol Educ 27:192, 2003.
Korzick DH: Regulation of cardiac excitation-contraction
17:202, 2002.
heart rate by nitric oxide is site specific. News Physiol Sci
Herring N, Danson EJ, Paterson DJ: Cholinergic control of
WB Saunders, 1973.
Cardiac Output and Its Regulation, 2nd ed. Philadelphia:
Guyton AC, Jones CE, Coleman TG: Circulatory Physiology:
Rev 35:123, 1955.
venous return curves with cardiac response curves. Physiol
Guyton AC: Determination of cardiac output by equating
Starling relationship. News Physiol Sci 16:5, 2001.
Fuchs F, Smith SH: Calcium, cross-bridges, and the Frank-
of excitatory currents. Cardiovasc Res 55:1, 2002.
Fozzard HA: Cardiac sodium and calcium channels: a history
mutations to clinical syndromes. J Clin Invest 110:1075,
Clancy CE, Kass RS: Defective cardiac ion channels: from
micity. Physiol Rev 83:59, 2003.
role in cardiac growth, contractile performance, and rhyth-
Brutsaert DL: Cardiac endothelial-myocardial signaling: its
myocytes. Circ Res 92:1182, 2003.
Brette F, Orchard C: T-tubule function in mammalian cardiac
415:198, 2002.
Bers DM: Cardiac excitation-contraction coupling. Nature
blood to the heart. This is the principal subject of
tissues, which in turn controls
entirely by the ease of blood flow through the body’s
140 mm Hg), the cardiac output is determined almost
160 mm Hg. In other words, during normal function of
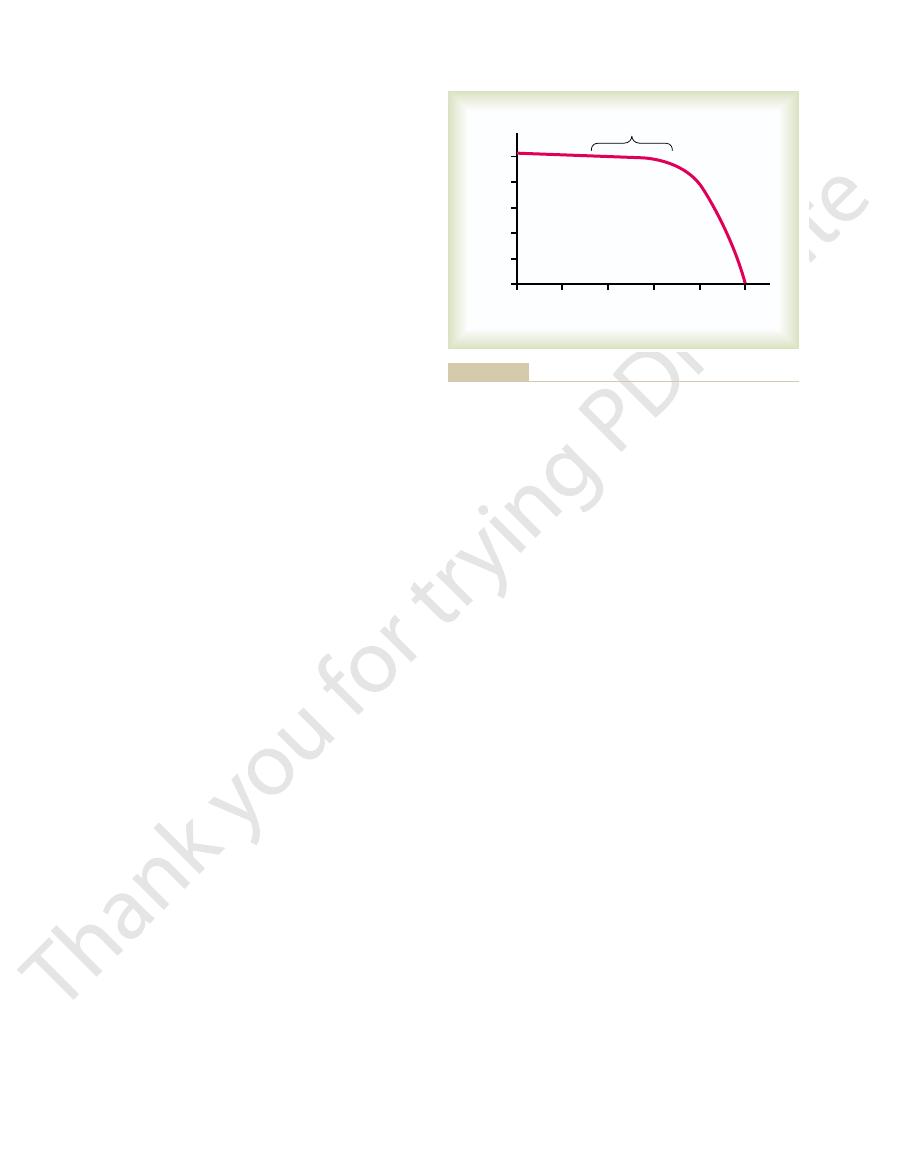
Note in Figure 9–12 that increasing the arterial pres-
(up to a Limit) Does Not Decrease the
Increasing the Arterial Pressure Load
heart and eventually causes weakness. Therefore,
occurs during body exercise, but prolonged elevation
temporarily by a moderate increase in temperature, as
process.
rate, resulting in acceleration of the self-excitation
60° to 70°F. These effects presumably result from
causes a greatly decreased heart rate, falling to as low
to as fast as double normal. Decreased temperature
fever, causes a greatly increased heart rate, sometimes
Increased body temperature, as occurs when one has
Effect of Temperature on
Therefore, cardiac effects of abnormal calcium con-
normally are regulated within a very narrow range.
Fortunately, however, calcium ion levels in the blood
, similar to the effect of high potassium.
Conversely, deficiency of calcium ions causes cardiac
earlier in the chapter.
initiate the cardiac contractile process, as explained
tion. This is caused by a direct effect of calcium ions to
ions, causing the heart to go toward spastic contrac-
traction of the heart progressively weaker.
the action potential also decreases, which makes con-
As the membrane potential decreases, the intensity of
the cardiac muscle fibers, as explained in Chapter 5.
These effects result partially from the fact that a
the atria to the ventricles through the A-V bundle.
flaccid and also slows the heart rate. Large quantities
114
Unit III
The Heart
also can block conduction of the cardiac impulse from
Elevation of potassium concentration to only 8 to
12 mEq/L—two to three times the normal value—can
cause such weakness of the heart and abnormal
rhythm that this can cause death.
high potassium concentration in the extracellular
fluids decreases the resting membrane potential in
Effect of Calcium Ions.
An excess of calcium ions causes
effects almost exactly opposite to those of potassium
flaccidity
centrations are seldom of clinical concern.
Heart Function
as a few beats per minute when a person is near death
from hypothermia in the body temperature range of
the fact that heat increases the permeability of the
cardiac muscle membrane to ions that control heart
Contractile strength of the heart often is enhanced
of temperature exhausts the metabolic systems of the
optimal function of the heart depends greatly on
proper control of body temperature by the tempera-
ture control mechanisms explained in Chapter 73.
Cardiac Output
sure in the aorta does not decrease the cardiac output
until the mean arterial pressure rises above about
the heart at normal systolic arterial pressures (80 to
venous return of
Chapter 20.
References
2002.
0
200
250
50
100
Cardiac output (L
/min)
Arterial pressure (mm Hg)
150
3
2
1
0
4
5
Normal range
significantly.
the increasing pressure load cause the cardiac output to fall
Only when the arterial pressure rises above this normal limit does
Constancy of cardiac output up to a pressure level of 160 mm Hg.
Figure 9–12

and nitric oxide. Prog Biophys Mol Biol 84:217, 2004.
thetic outflow in heart failure: the roles of angiotensin II
Zucker IH, Schultz HD, Li YF, et al: The origin of sympa-
where have the stem cells gone? Annu Rev Physiol 66:29,
Sussman MA, Anversa P: Myocardial aging and senescence:
London: Longmans Green, 1918.
Starling EH: The Linacre Lecture on the Law of the Heart.
tricular function curves. Physiol Rev 35:107, 1955.
Sarnoff SJ: Myocardial contractility as described by ven-
cardiac excitation. Ann Biomed Eng 28:945, 2000.
Rudy Y: From genome to physiome: integrative models of
Heart Muscle; The Heart as a Pump and Function of the Heart Valves
Chapter 9
115
2004.