Lecture 11 - The Chi-Square distribution (X2-test)
87
Is the most frequently employed statistical technique for
analysis of count or frequency data to find the
association between two variables or more.
X
2
-test statistic is most appropriate for use with
qualitative (categorical) variables e.g. marital status
(single, married, widowed), or with discrete numerical
variable ➨ Used for the frequencies associated with these
variables (most accurate when the variable is
dichotomous e.g. life or death, disease or not, male or
female….etc.).
X
2
-test is used to whether there is an association between
the raw variable and the column variable.
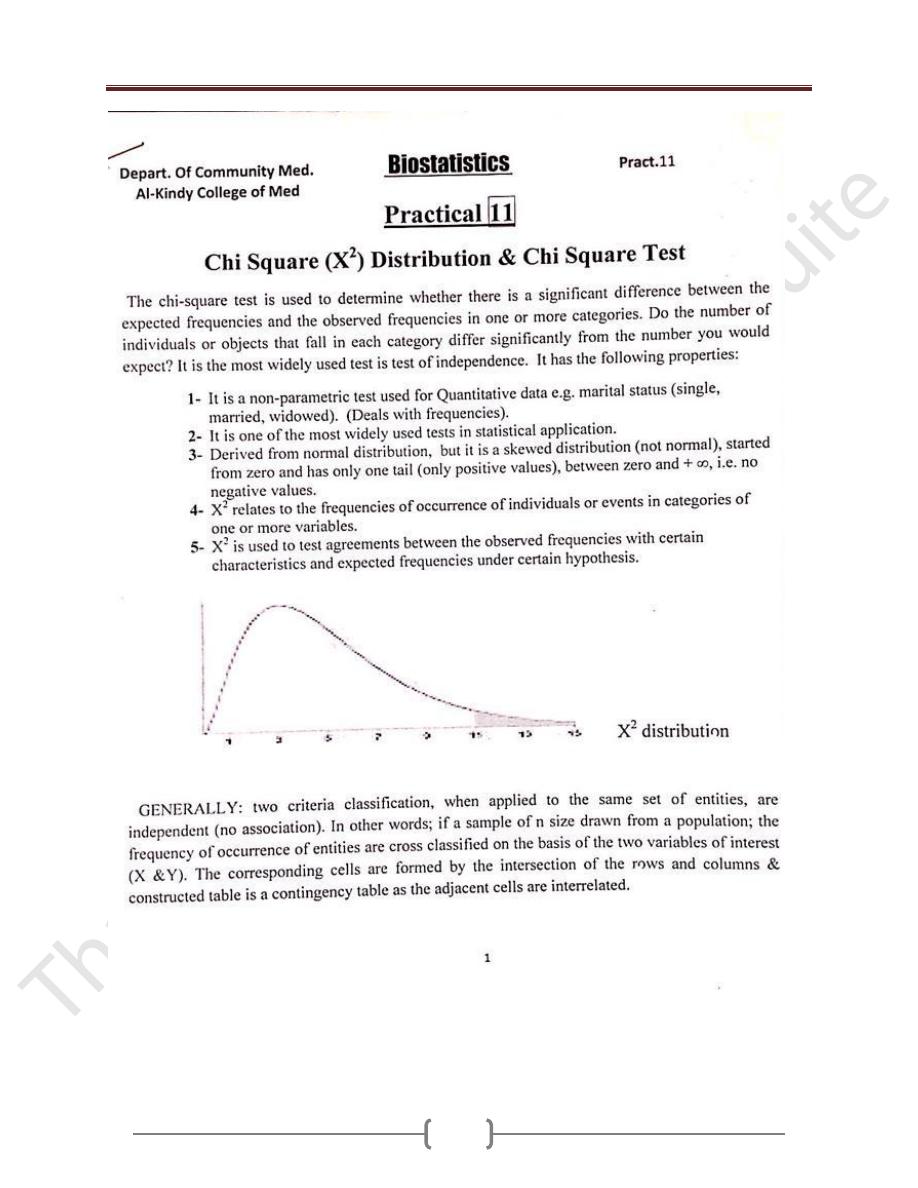
Chi-Square distribution may be derived from the normal
distribution, but it is a skewed distribution (not normal),
started from zero and has only one tail (only positive
values). It depends on:
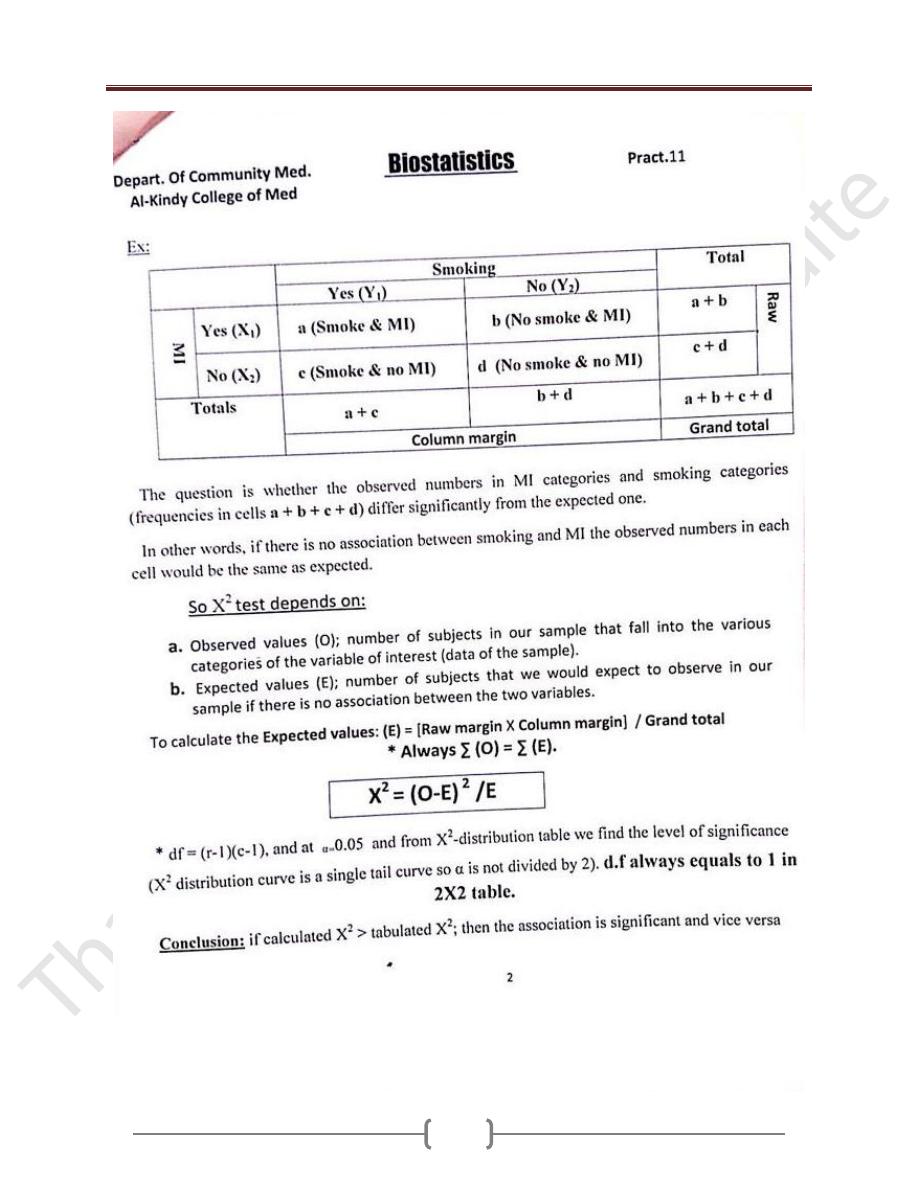
1) Observed values (O); number of subjects in our sample
that fall into the various categories of the variable of
interest (data of the sample).
2) Expected values (E); number of subjects that we would
expect to observe in our sample if the null hypothesis is
true. To calculate the expected values: (E)= [Raw margin
X Column margin] / Grand total
* Always ∑ (O) = ∑ (E).
X
2
= (O-E)
2
/E
* df=(r-1)(c-1)
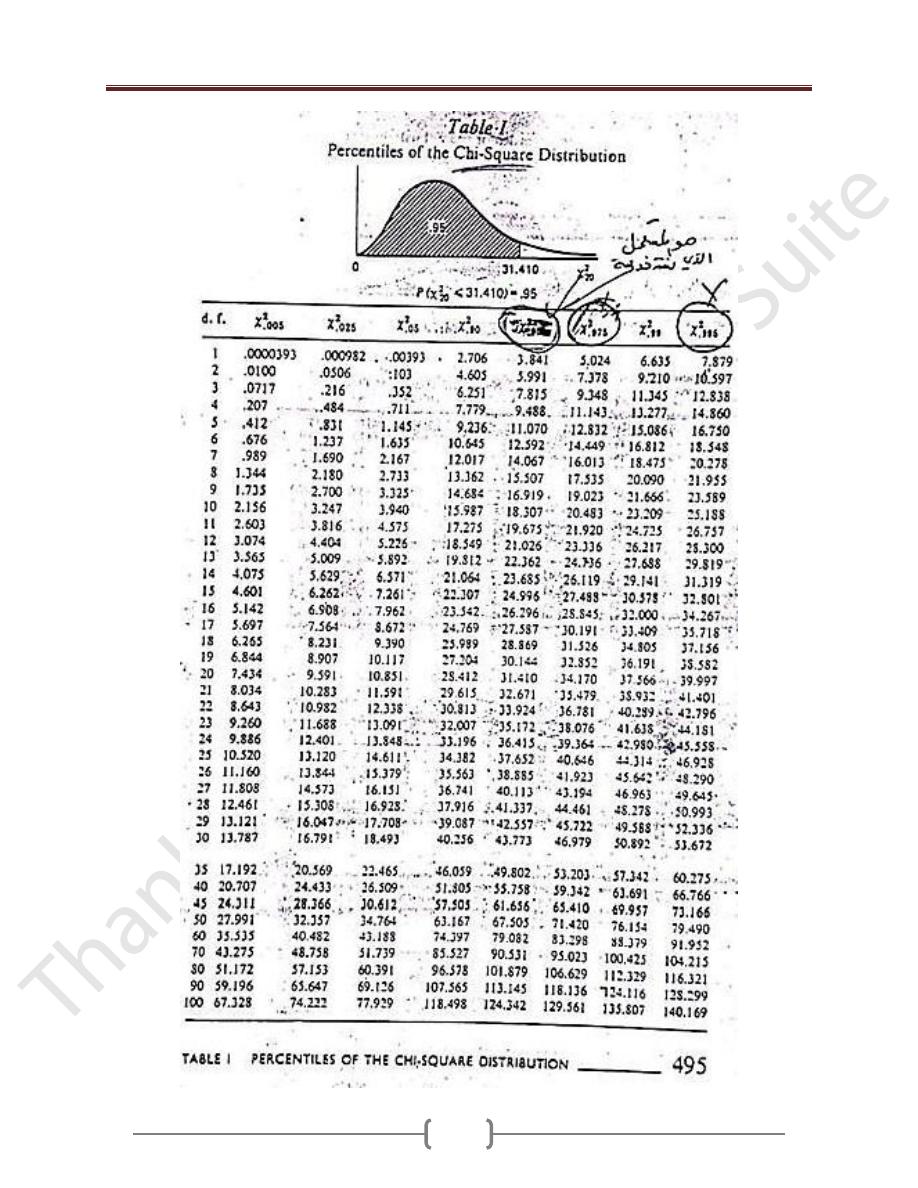
⍺
=
0.05 and from X
2
-distribution table
we find p-value.
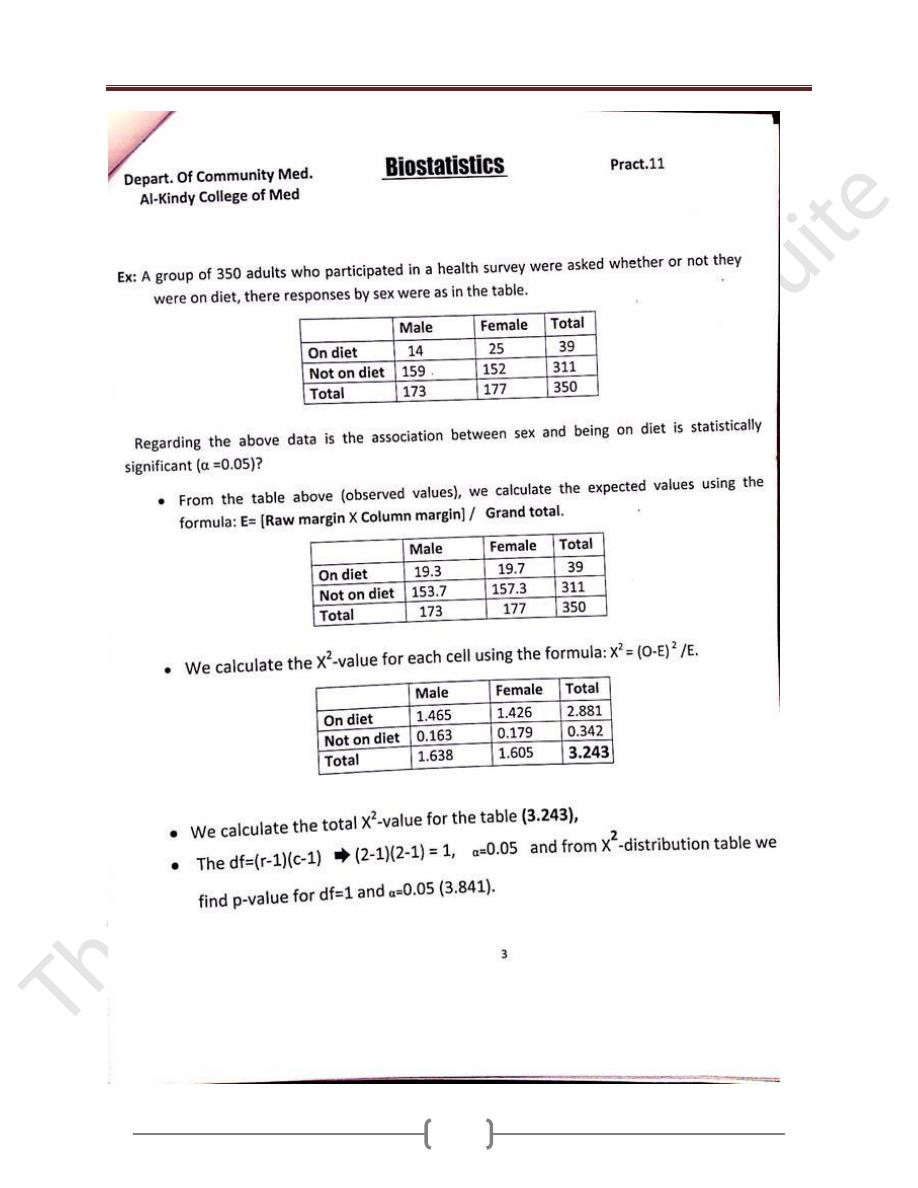
Ex: A group of 350 adults who participated in a health
survey were asked whether or not they were on diet, there
responses by sex were as in the table.
Regarding the above data is the association between sex
and being on diet is statistically significant (
⍺=
0.05)?
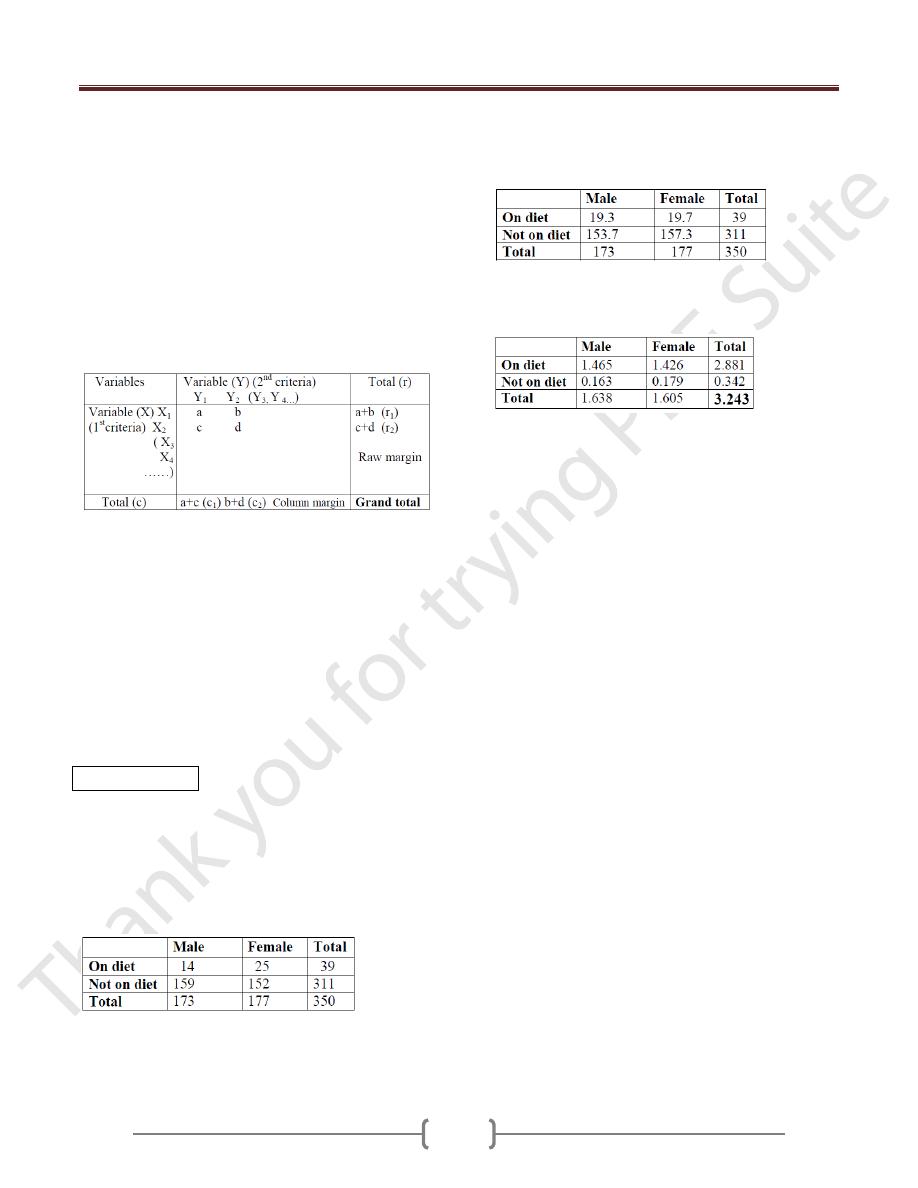
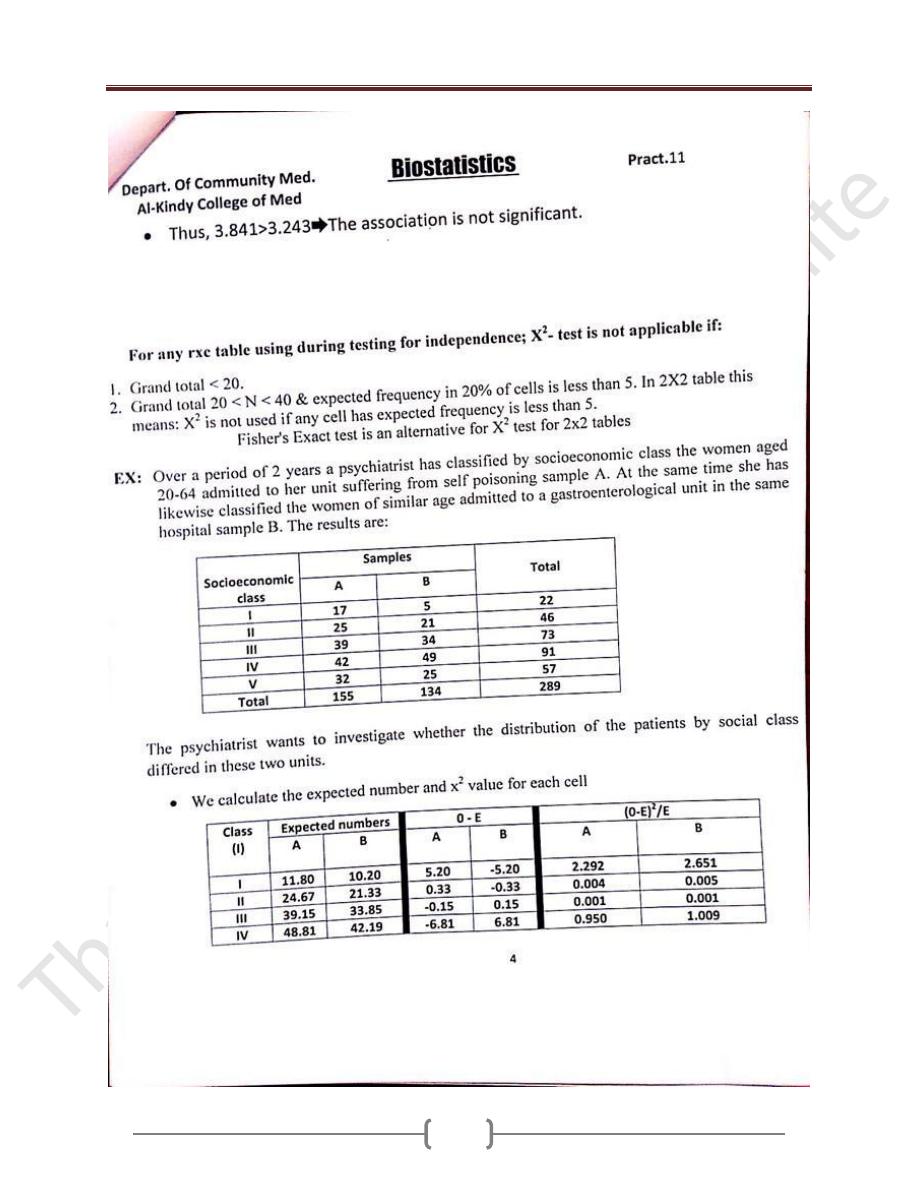
-From the table above (observed values), we calculate the
expected values using the formula: E= [Raw margin X
Column margin] / Grand total.
-we calculate the X
2
-value for each cell using the formula:
X
2
= (O-E)
2
/E.
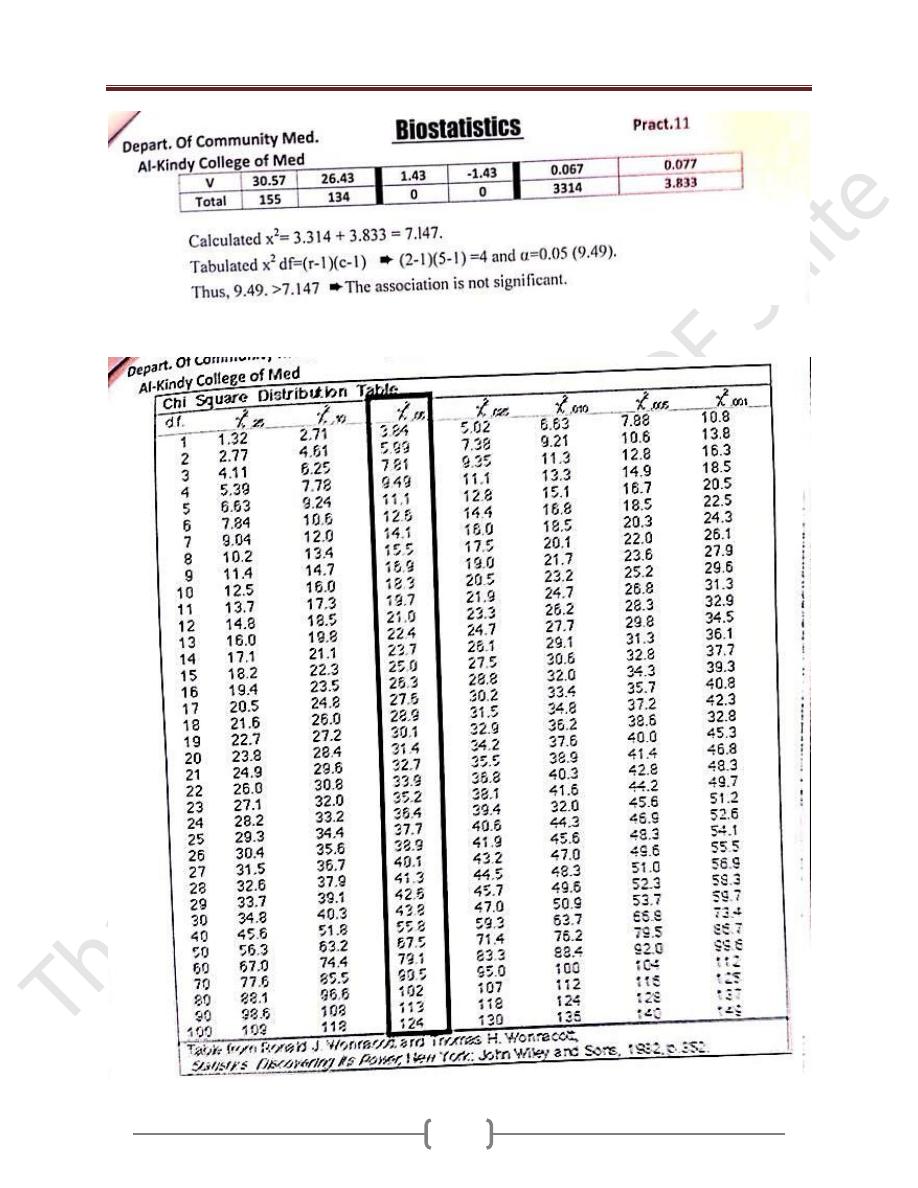
- We calculate the total X
2
-value for the table (3.243),
- The df=(r-1)(c-1) ➨ (2-1)(2-1) = 1,
⍺=
0.05 and from
X
2
-distribution table we find p-value for df=1 and
⍺=
0.05
(3.841). Thus, 3.841>3.243➨The association is not
significant.
Lecture 11 - The Chi-Square distribution (X2-test)
88
Lecture 11 - The Chi-Square distribution (X2-test)
89
Lecture 11 - The Chi-Square distribution (X2-test)
90
Lecture 11 - The Chi-Square distribution (X2-test)
91
Lecture 11 - The Chi-Square distribution (X2-test)
92
Lecture 11 - The Chi-Square distribution (X2-test)
93