Signals & Systems Lecture Seven
Lecturer: Dr.Manal Khadhim.
2
C
C
o
o
n
n
v
v
o
o
l
l
u
u
t
t
i
i
o
o
n
n
Impulse Response :
The impulse response h(t) of an LTI system is defined as the response of the
system when the input signal x(t) is a delta function δ(t). The output y(t) of an LTI
system can be expressed as the convolution of the input signal x(t) and the impulse
response h(t) of the system
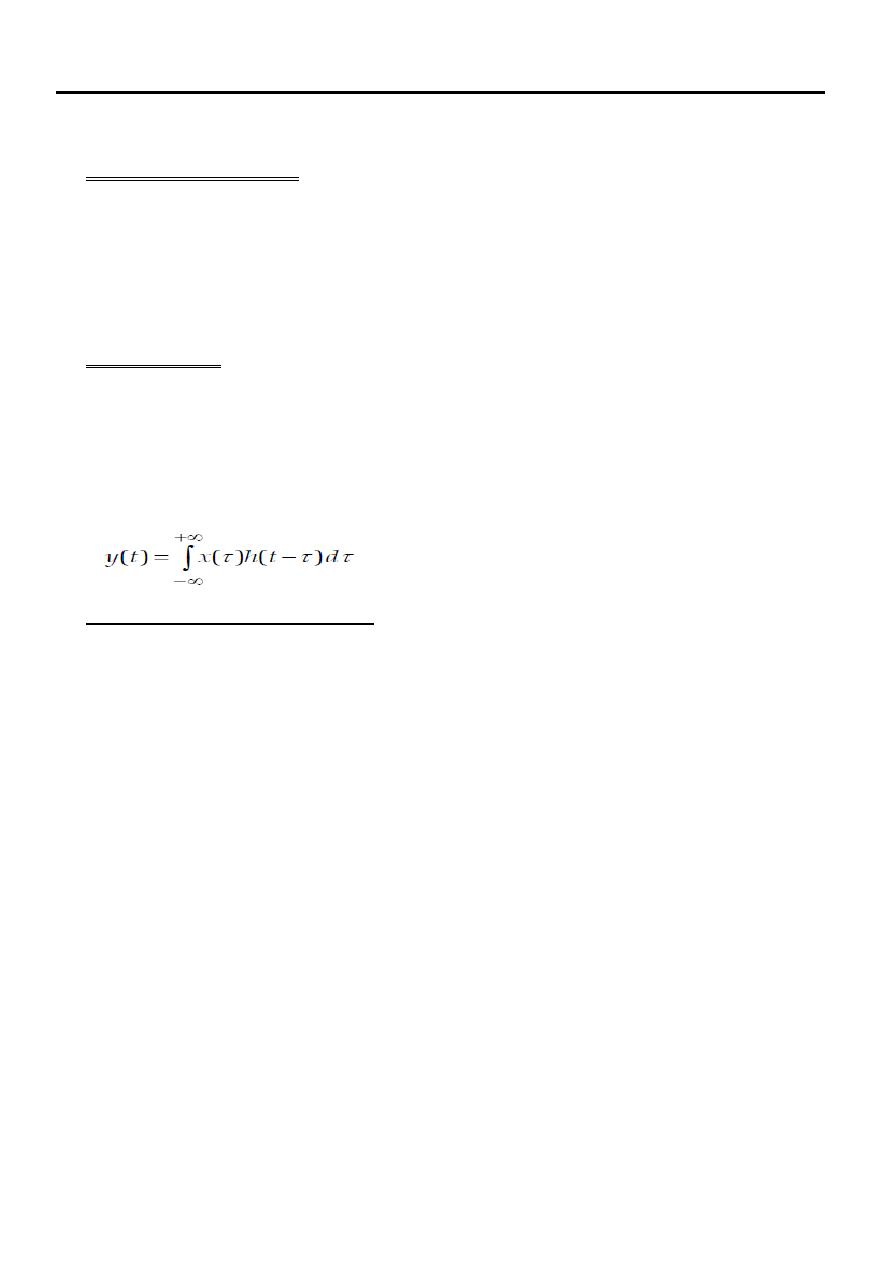
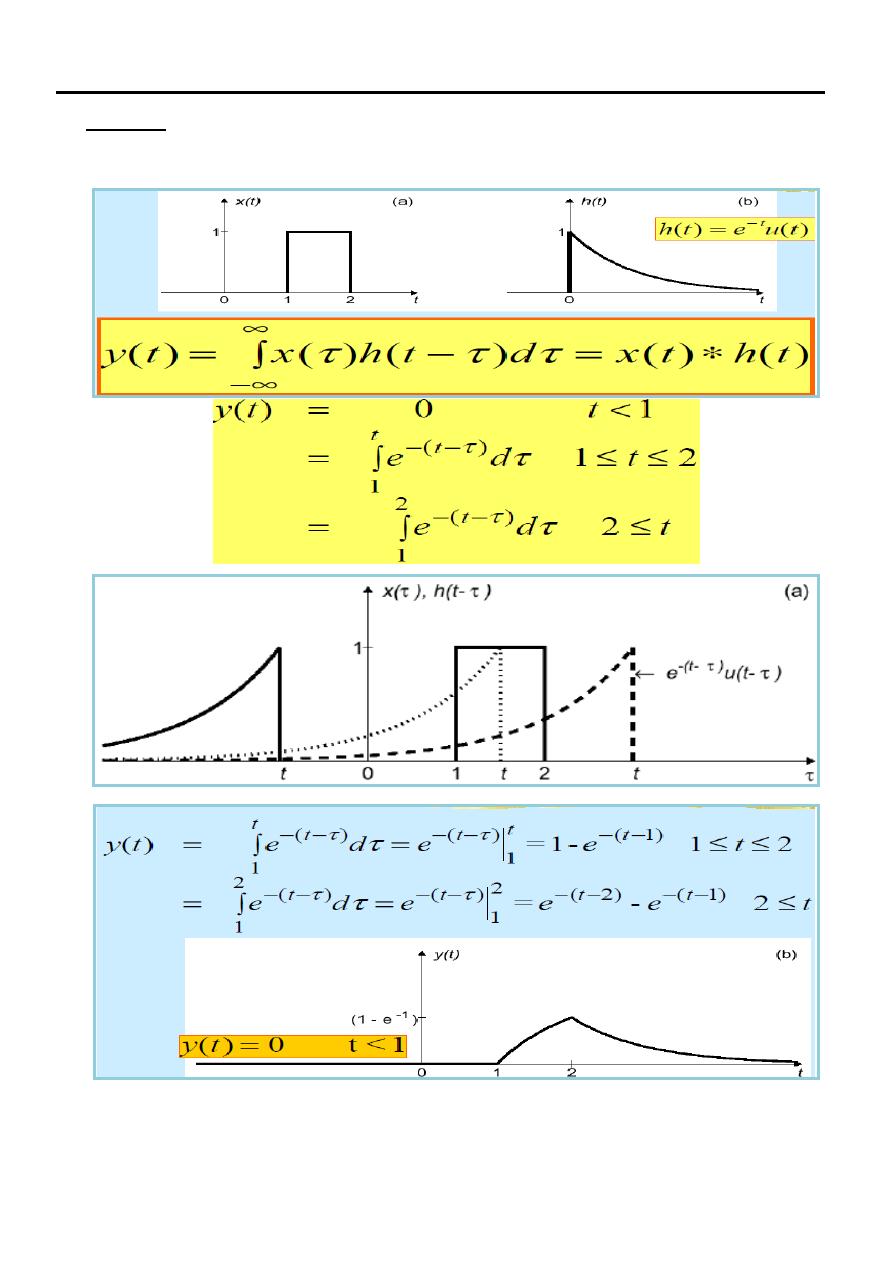
Convolution
The convolution integral is the best mathematical representation of the physical
process that occurs when an input acts on a linear system to produce an output. If x(t)
is the input, y(t) is the output, and h(t) is the unit impulse response of the system,
then continuous
‐time convolution is shown by the following integral.
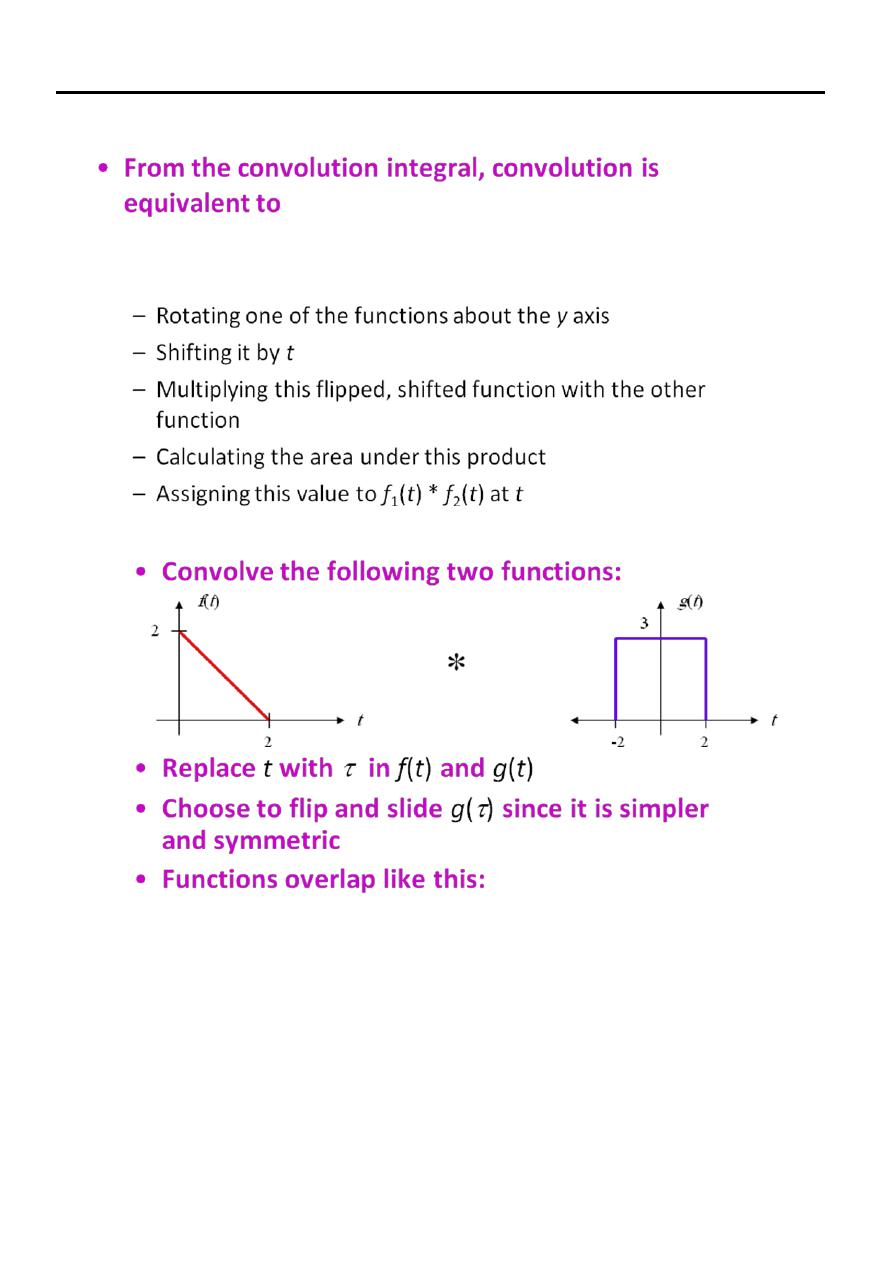
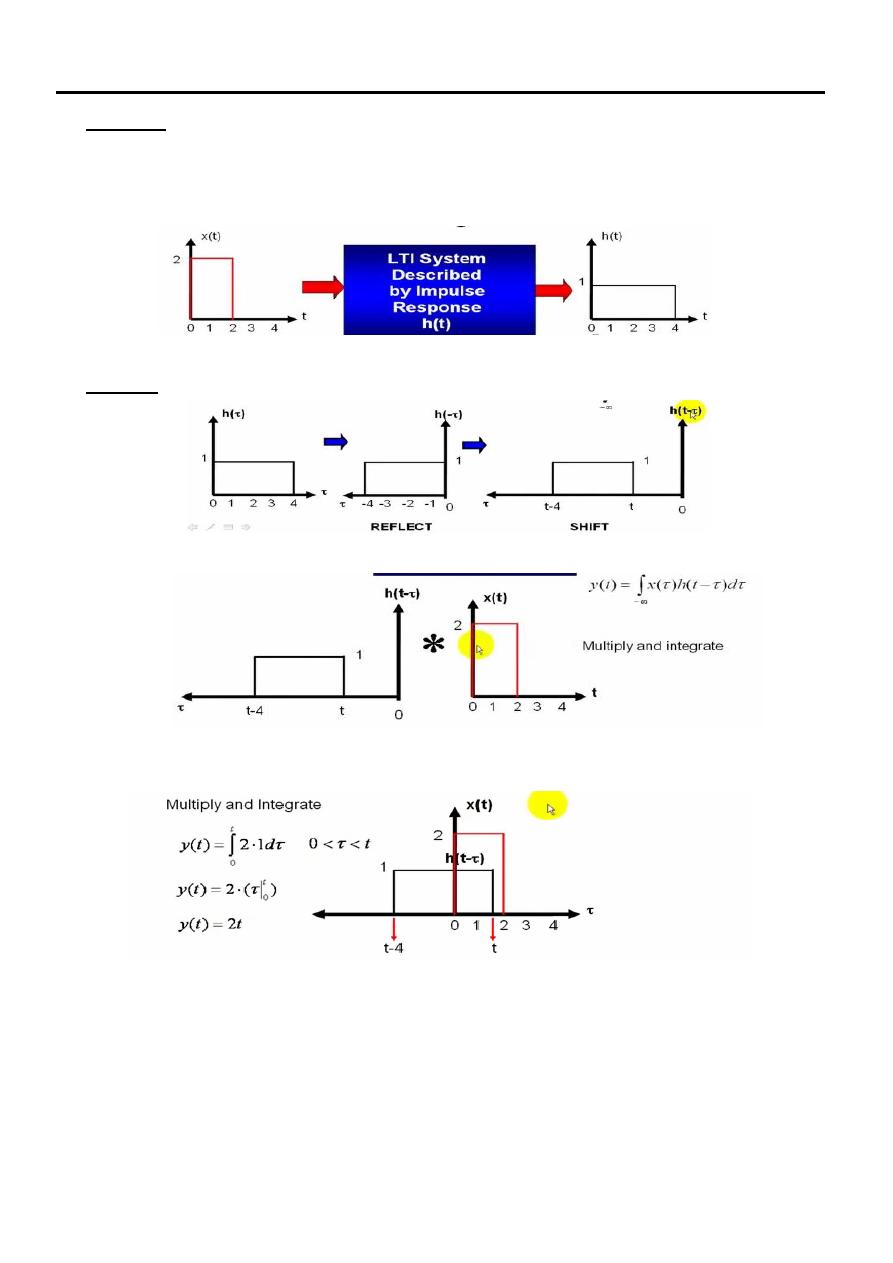
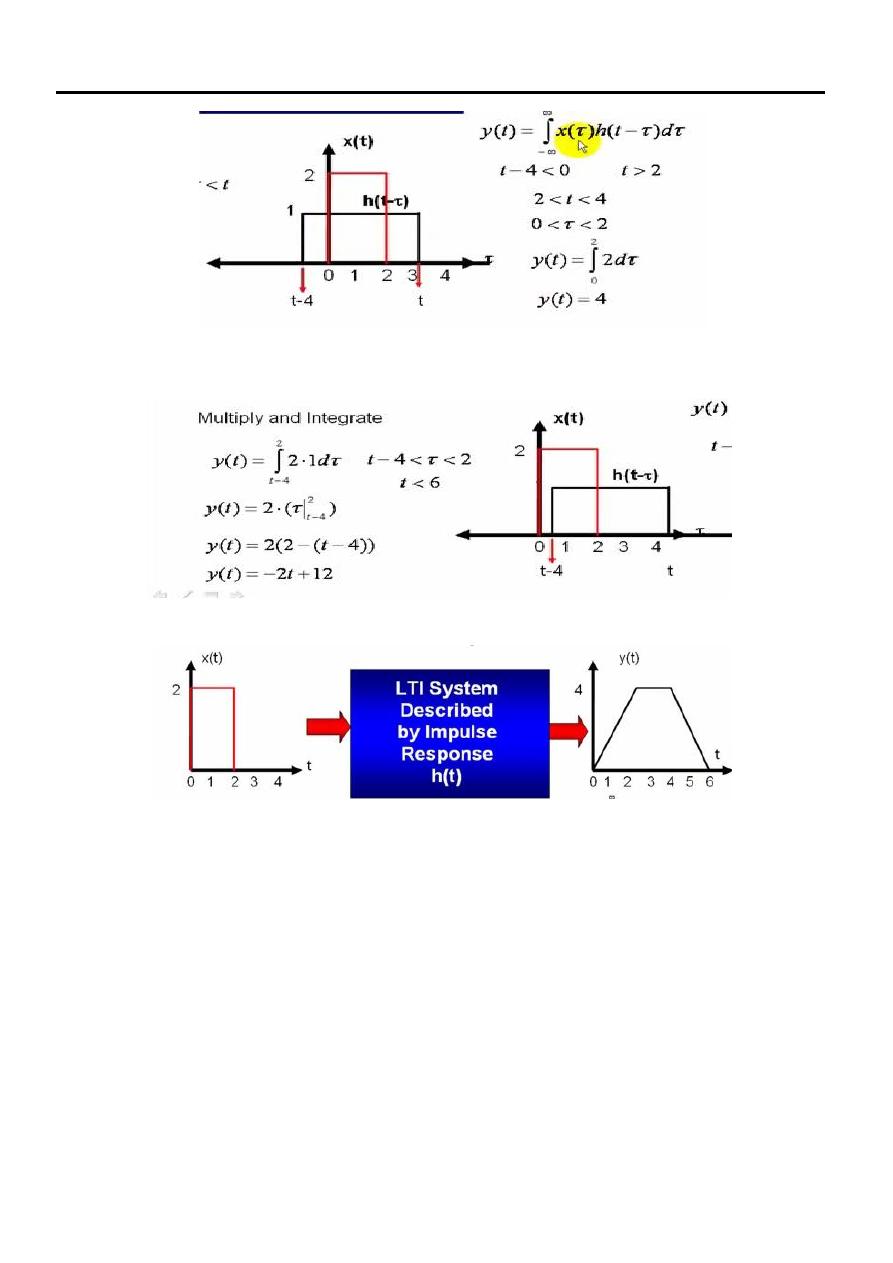
Steps for graphical convolution:
(1) Sketch the waveform for input x(τ ) by changing the independent variable from t
to τ and keep the waveform for x(τ ) fixed during convolution.
(2) Sketch the waveform for the impulse response h(τ ) by changing the independent
variable from t to τ .
(3) Reflect h(τ ) about the vertical axis to obtain the time-inverted impulse response
h(−τ ).
(4) Shift the time-inverted impulse function h(−τ ) by a selected value of “t” . The
resulting function represents h(t − τ ).
(5) Multiply function x(τ) by h(t − τ ) and plot the product function x(τ )h(t − τ ).
(6) Calculate the total area under the product function x(τ )h(t − τ ) by integrating it
over τ = [−∞,∞].
(7) Repeat steps 4−6 for different values of t to obtain y(t ) for all time, −∞ ≤ t ≤∞.
Signals & Systems Lecture Seven
Lecturer: Dr.Manal Khadhim.
3
d
t
f
f
t
f
t
f
2
1
2
1
Signals & Systems Lecture Seven
Lecturer: Dr.Manal Khadhim.
4
6
2
3
2
6
2
2
3
2
2
3
)
2
(
3
2
2
2
0
2
2
0
t
t
t
d
t
t
6
2
2
3
2
3
2
0
2
2
0
d
Signals & Systems Lecture Seven
Lecturer: Dr.Manal Khadhim.
5
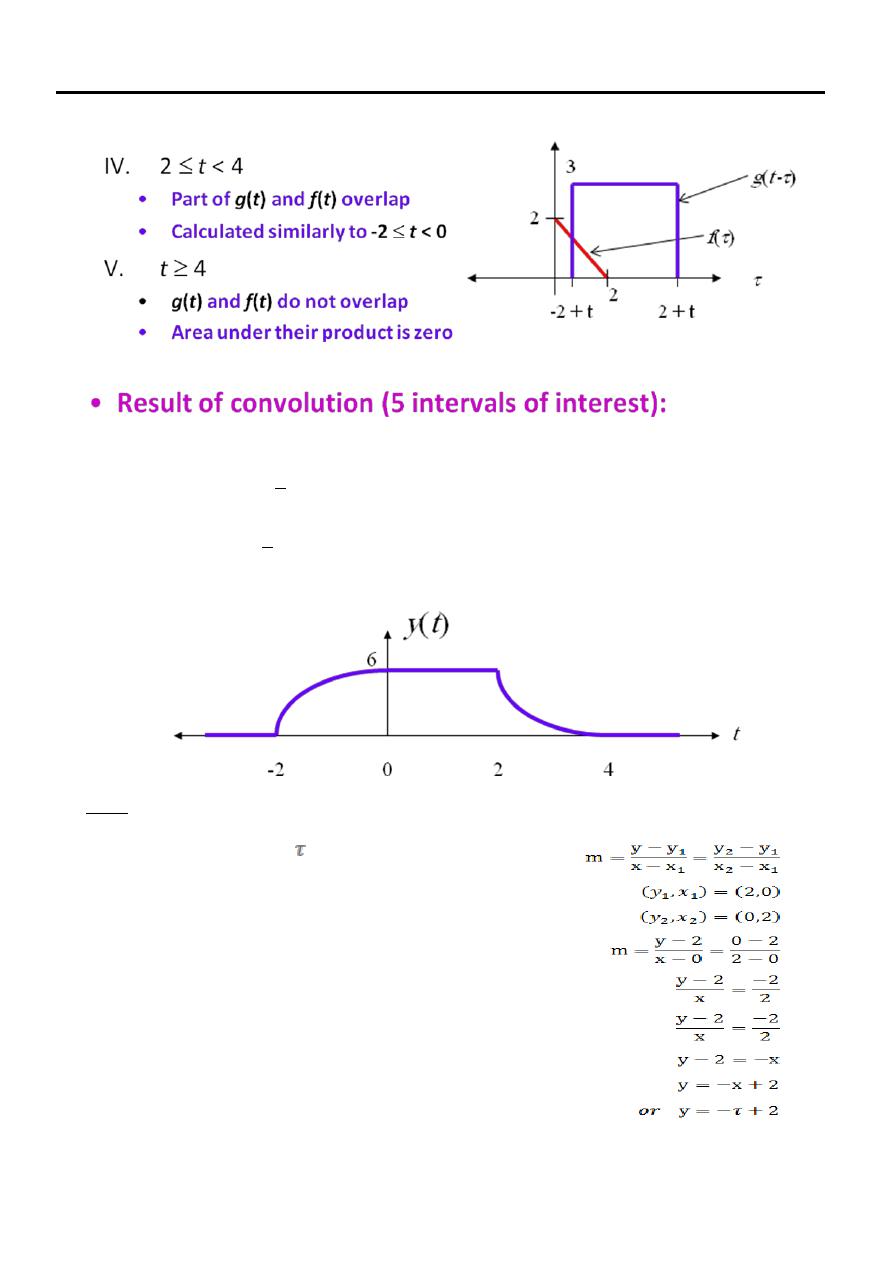
Note:
We found the function f( ) by calculate the slop as
shown in these equations.
4
for
0
4
2
for
24
12
2
3
2
0
for
6
0
2
for
6
2
3
2
for
0
)
(
*
)
(
)
(
2
2
t
t
t
t
t
t
t
t
t
g
t
f
t
y
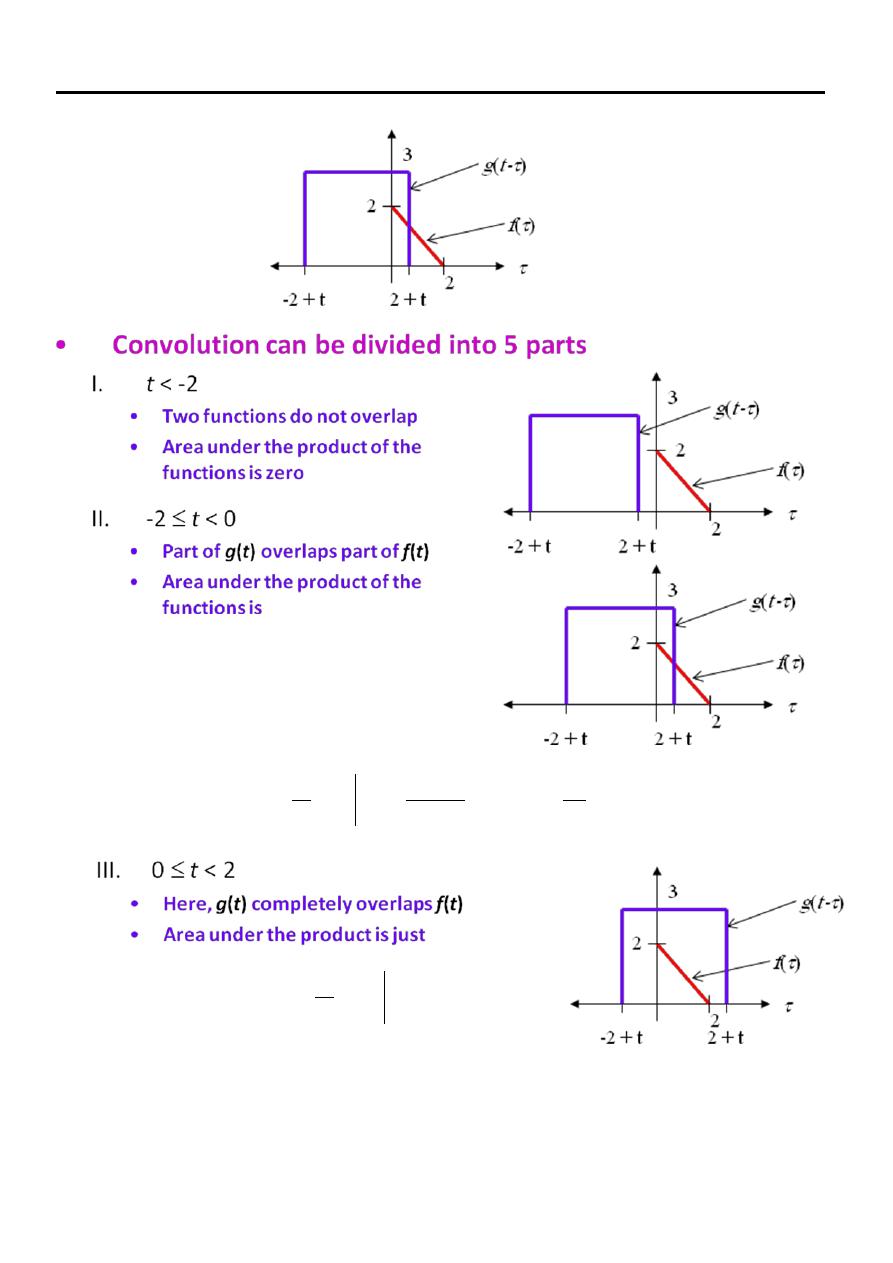
No Overlap
Partial Overlap
Complete Overlap
Partial Overlap
No Overlap
Signals & Systems Lecture Seven
Lecturer: Dr.Manal Khadhim.
6
Example
Signals & Systems Lecture Seven
Lecturer: Dr.Manal Khadhim.
7
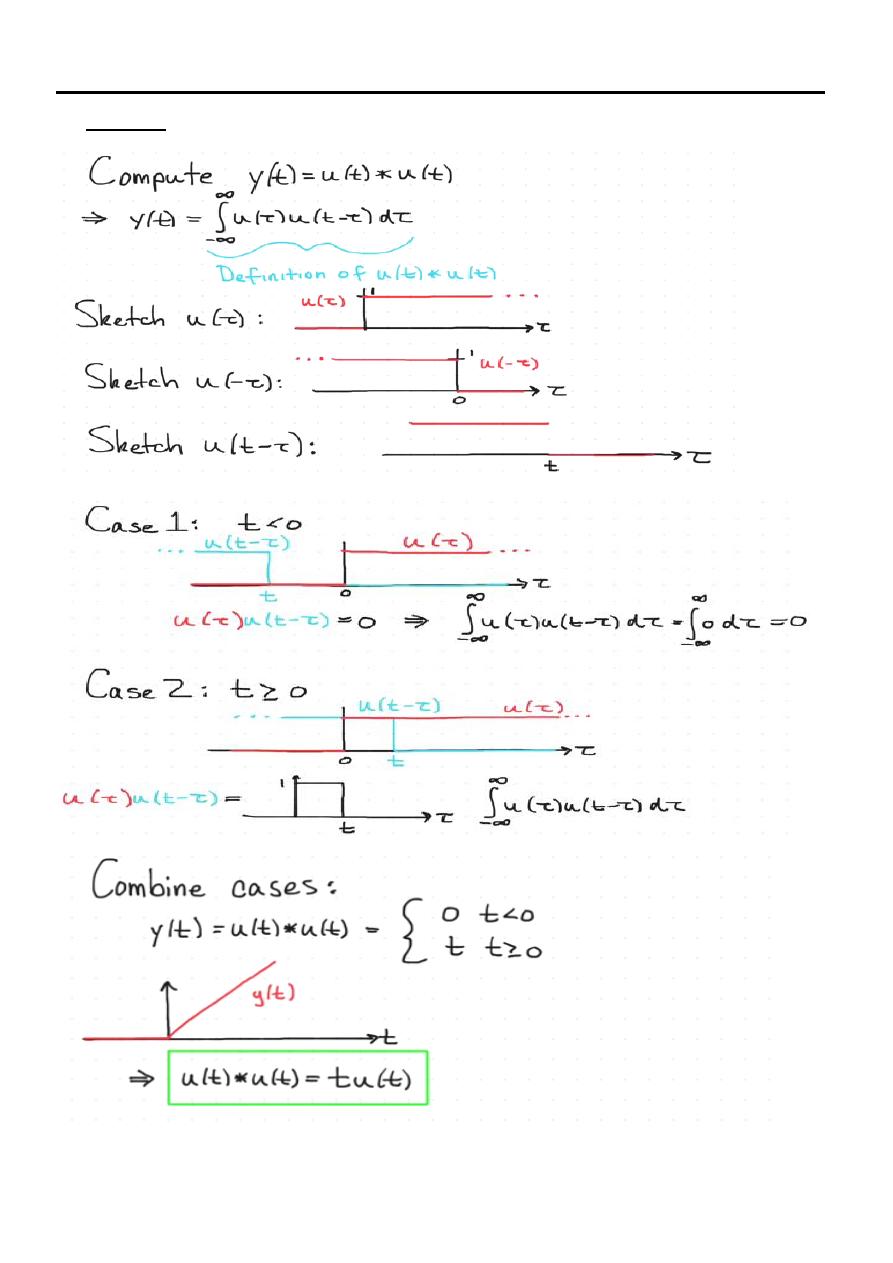
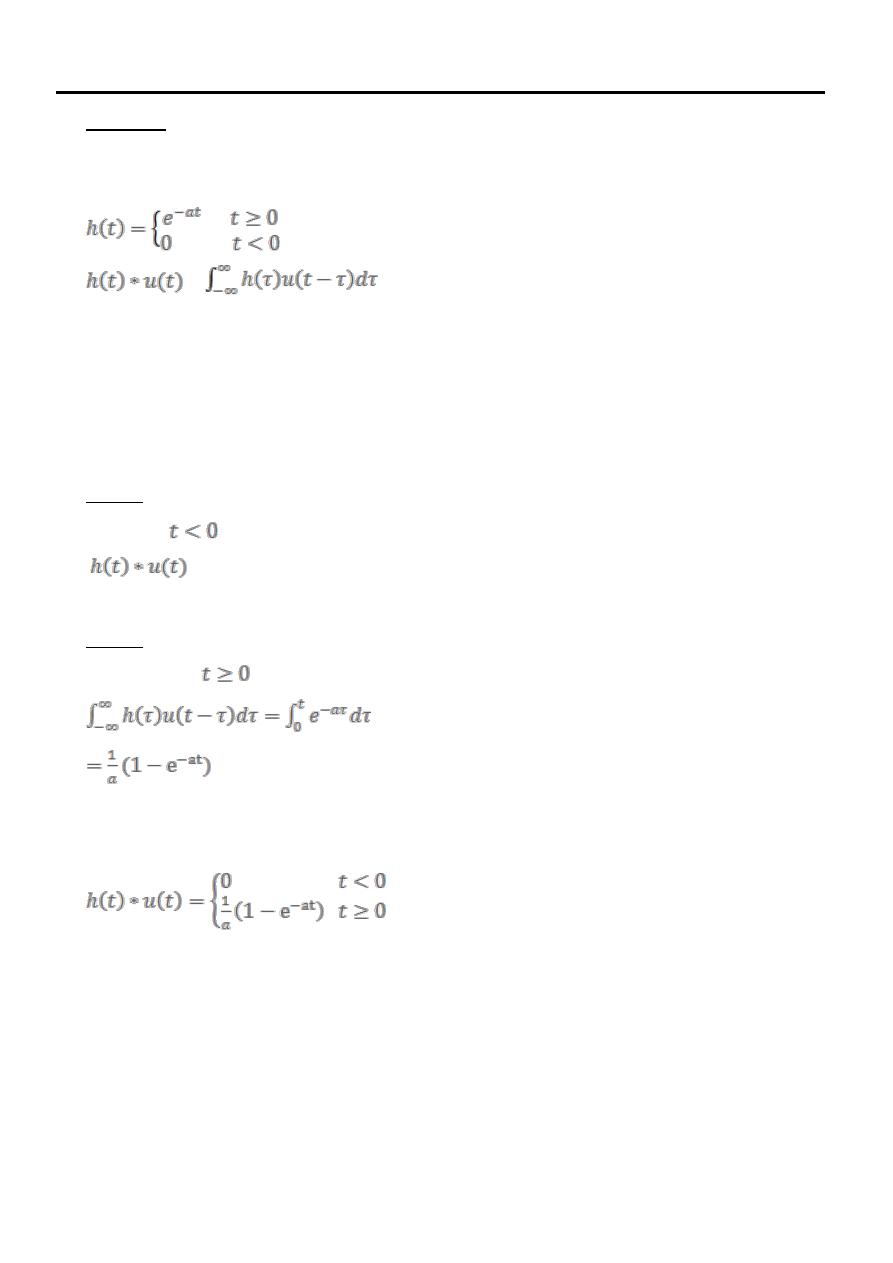
Example
Compute convolution between u(t) and h(t)
=
Case 1
When
= 0
Case 2
When
Signals & Systems Lecture Seven
Lecturer: Dr.Manal Khadhim.
8
Example
Find the convolution
Signals & Systems Lecture Seven
Lecturer: Dr.Manal Khadhim.
9
Example
Determiner and sketch the output y (t) of a LTI system with the impulse response
h (t) and the input signal x (t) are given in Figure below.
solution
Signals & Systems Lecture Seven
Lecturer: Dr.Manal Khadhim.
01