Subjec: Signals and Systems
Lecture 6
Lecture: Dr.Manal Kadhim
Electromechanical Eng.Department
Electromechanical Systems Branch
Fourth Year.
1
C
C
o
o
r
r
r
r
e
e
l
l
a
a
t
t
i
i
o
o
n
n
o
o
f
f
C
C
o
o
n
n
t
t
i
i
n
n
u
u
o
o
u
u
s
s
S
S
i
i
g
g
n
n
a
a
l
l
s
s
Correlation
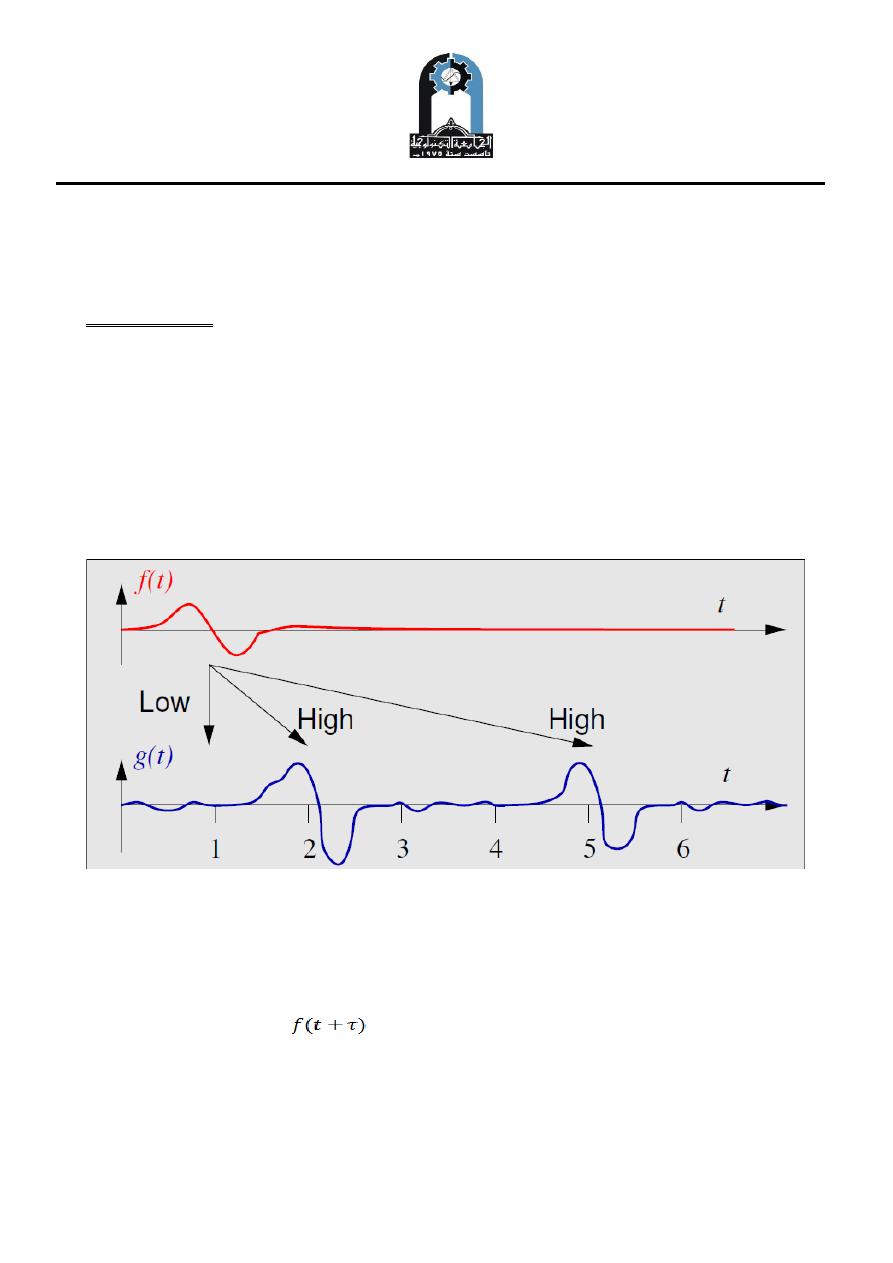
Correlation is a tool for analysing whether processes considered random a priori are
in fact related. In signal processing, cross-correlation Rfg is used to assess how
similar two different signals f (t) and g(t) are. Rfg is found by multiplying one
signal, f (t) say, with time-shifted values of the other g(t), then summing up the
products.
Figure (1): The signal f (t) would have a higher cross-correlation with parts of g(t)
One can also ask how similar a signal is to itself. Self-similarity is described by the
auto-correlation Rff , again a sum of products of the signal f (t) and a copy of the
signal at a shifted time
.
Subjec: Signals and Systems
Lecture 6
Lecture: Dr.Manal Kadhim
Electromechanical Eng.Department
Electromechanical Systems Branch
Fourth Year.
2
Definition
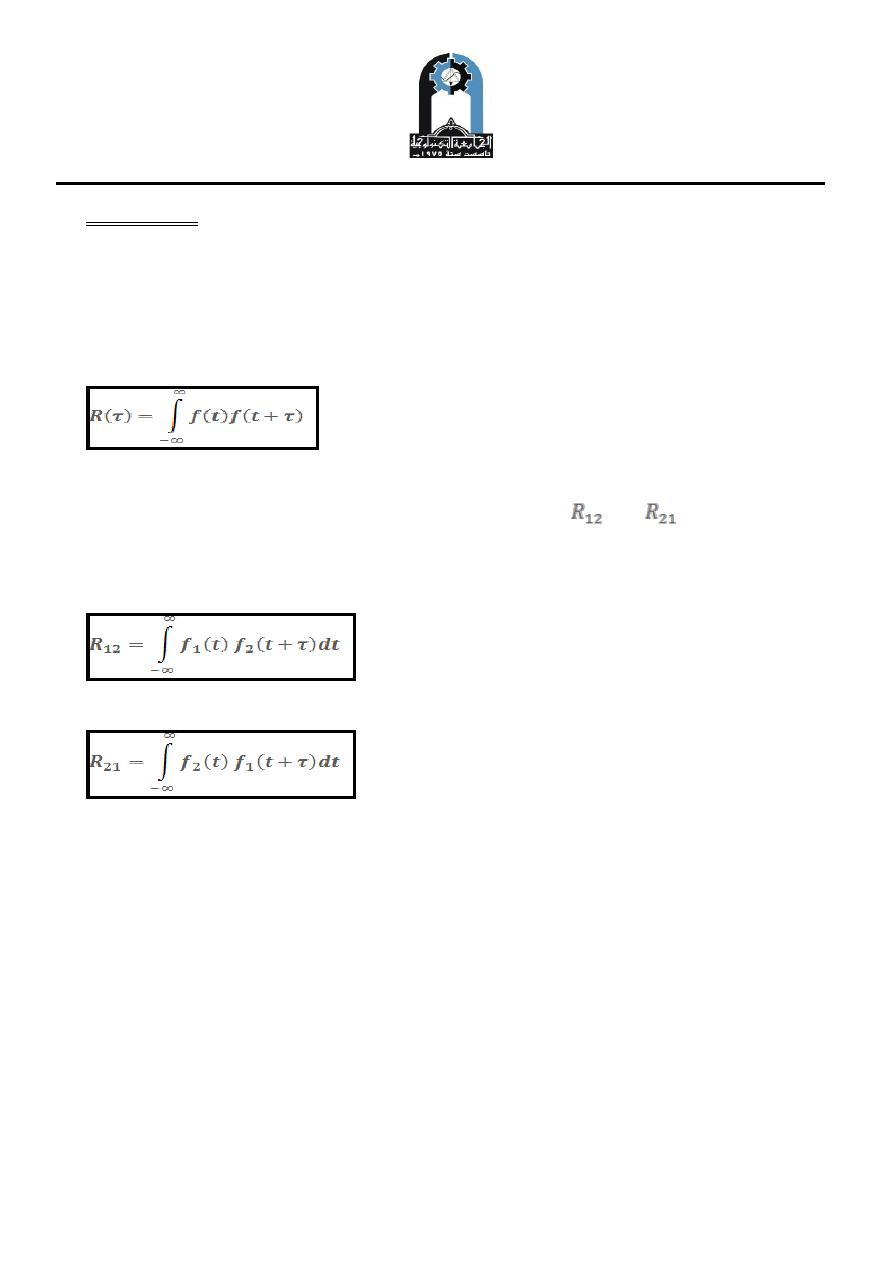
Correlation: the general form of the correlation function between two signal
f1(t)& f2(t).
Auto Correlation: it is the correlation of a function with itself. It provides a
measure of the degree to which a future value of the function can be predicted.
Cross Correlation: the Cross Correlation function
or
measures the
similarity between two signals f1(t)&f2(t).
This means that f2 (t) will be shifted.
This means that f1 (t) will be shifted.
The process of correlation is useful in comparing two deterministic signals and it
provides a measure of similarity between the first signal and a time delayed version
of the second signal
Correlation techniques are widely used in signal processing with many applications
in telecommunications, radar, medical electronics, physics, astronomy, geophysics
etc ......
Correlation has many useful properties, giving for example the ability to:
Subjec: Signals and Systems
Lecture 6
Lecture: Dr.Manal Kadhim
Electromechanical Eng.Department
Electromechanical Systems Branch
Fourth Year.
3
Detect a wanted signal in the presence of noise or other unwanted signals.
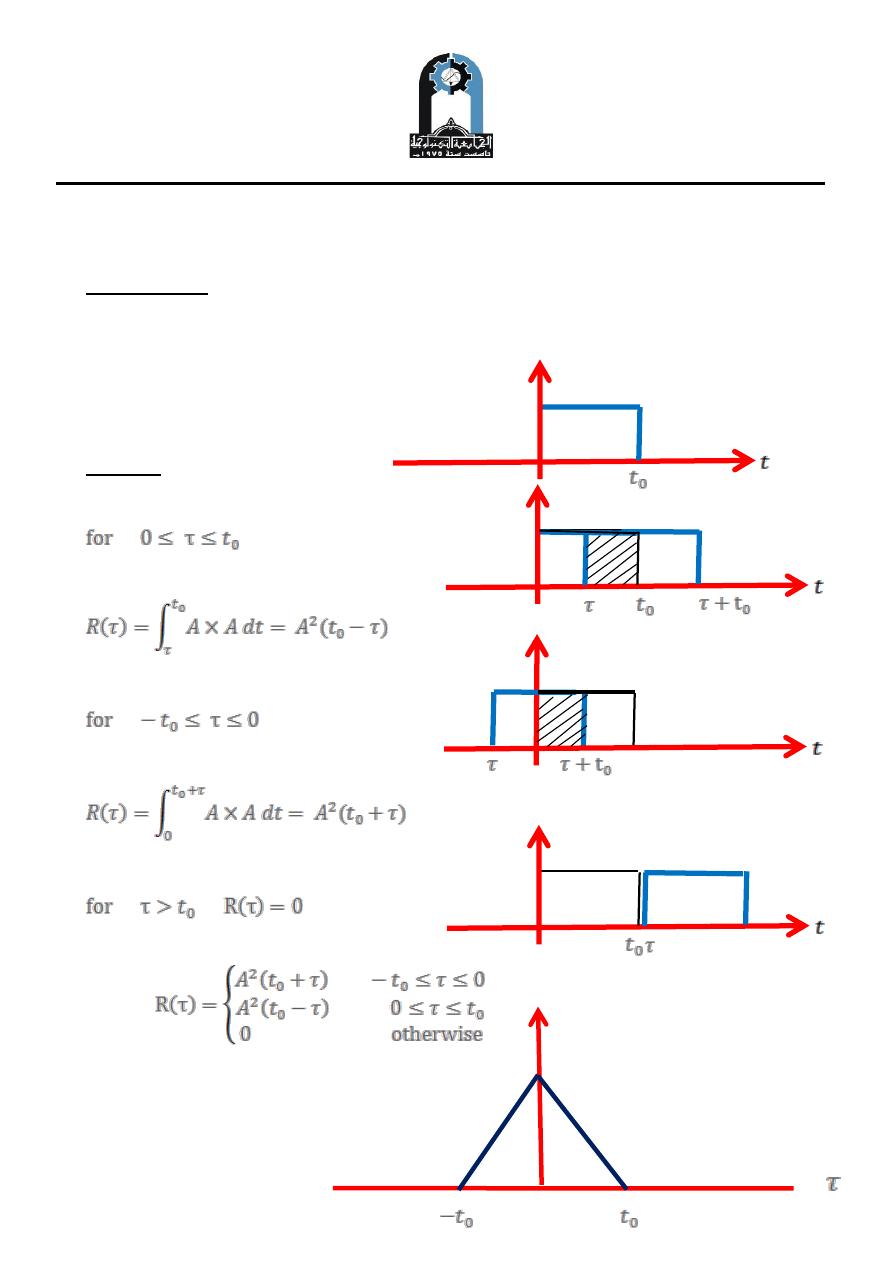
Example One
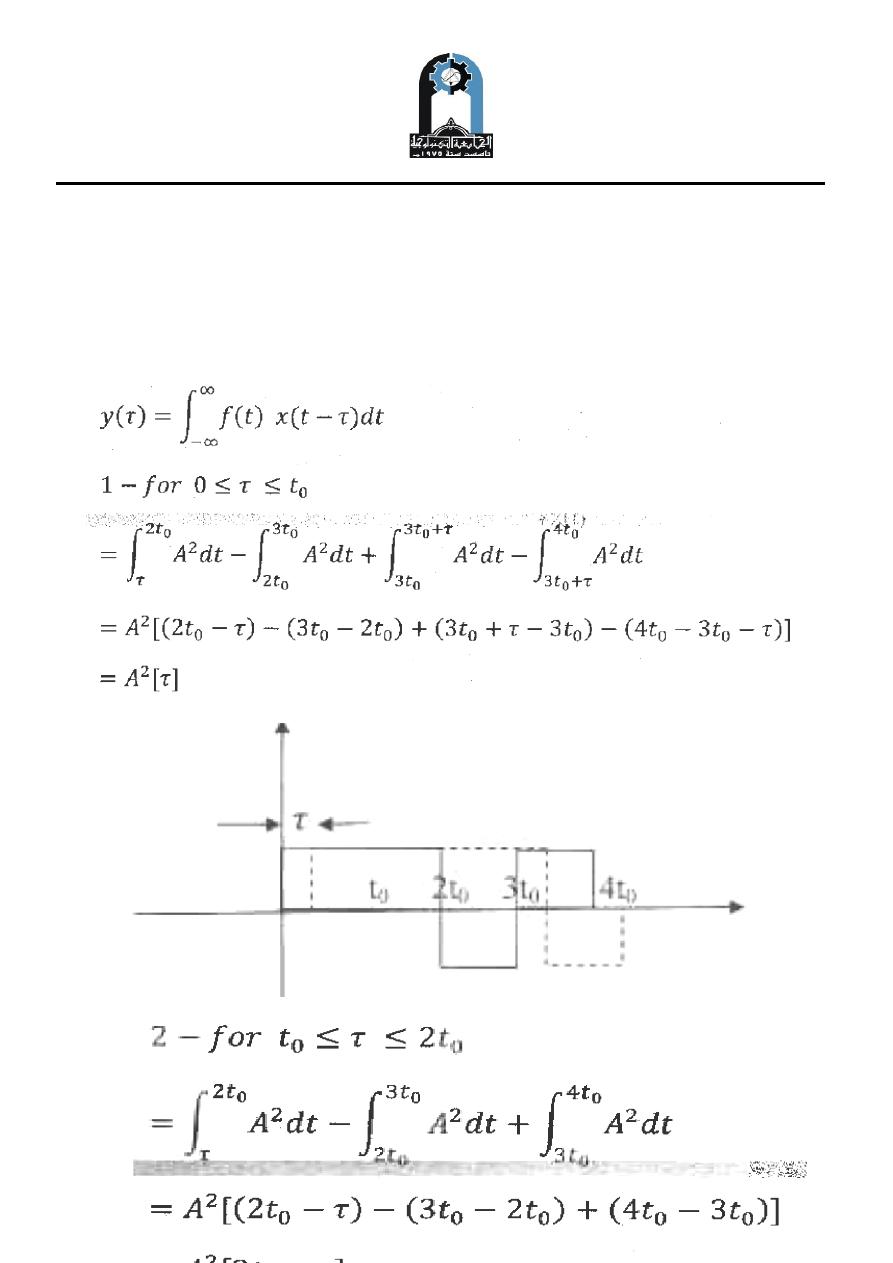
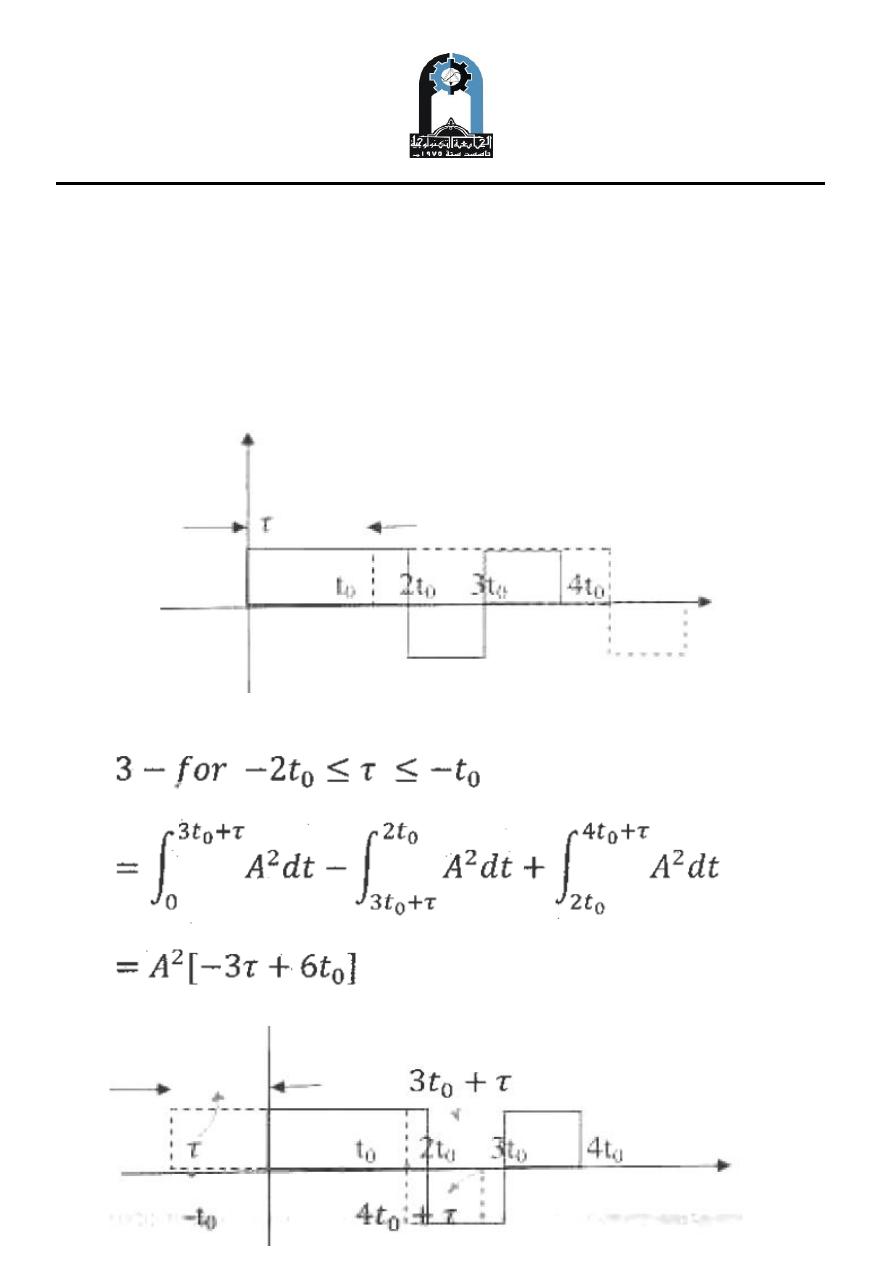
Find the auto correlation of the signal shown in Figure below:
Solution
Hence
A
f(t)
A
A
A
Subjec: Signals and Systems
Lecture 6
Lecture: Dr.Manal Kadhim
Electromechanical Eng.Department
Electromechanical Systems Branch
Fourth Year.
4
Basic properties of auto-correlation
1. Symmetry: The auto-correlation function is an even function of .
Rff ( ) = Rff (- ):
2. For a non-zero signal, Rff (0) > 0.
3. The value at ( ) = 0 is largest: Rff (0) Rff ( ).
Rff (0) = E for energy signal
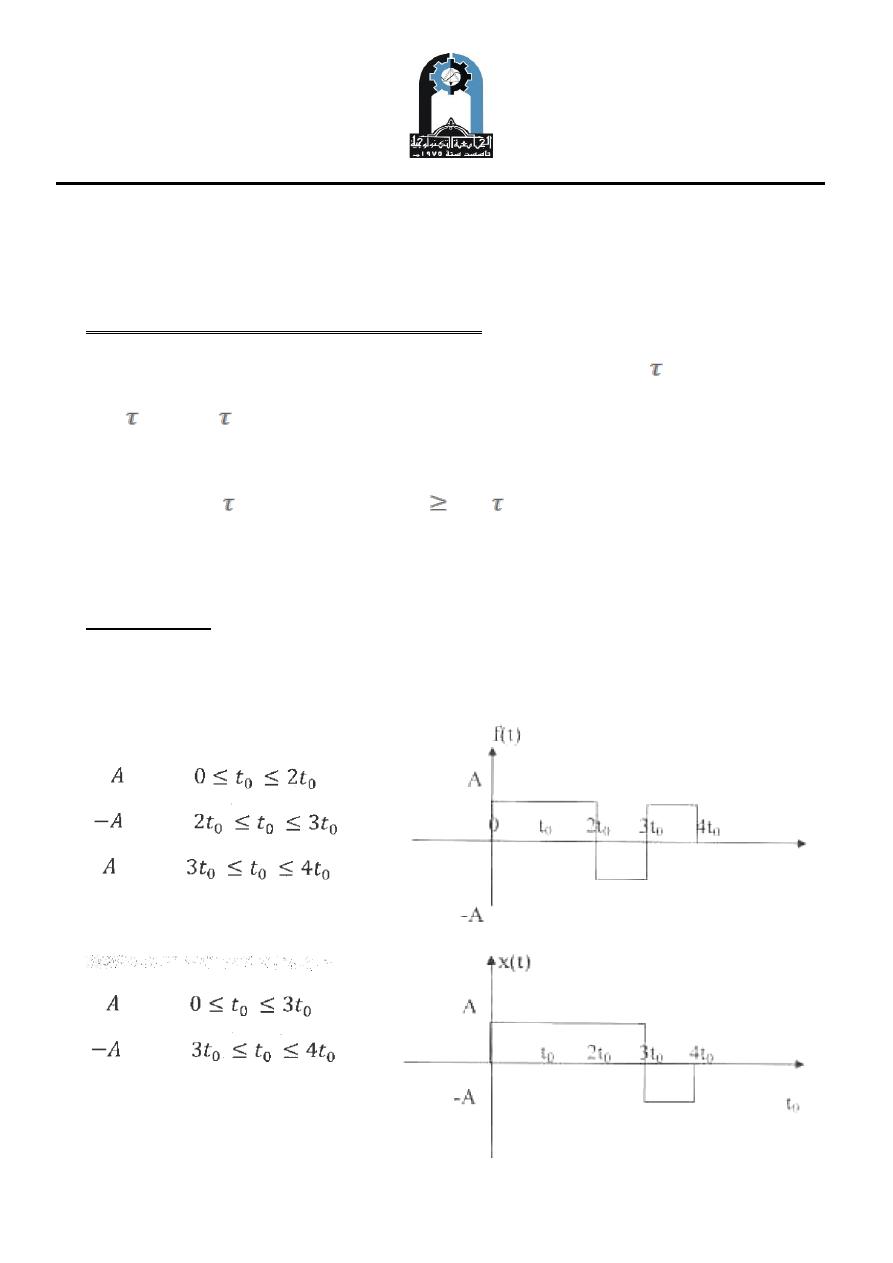
Example Two
Find the cross correlation between f(t) & x(t)
Subjec: Signals and Systems
Lecture 6
Lecture: Dr.Manal Kadhim
Electromechanical Eng.Department
Electromechanical Systems Branch
Fourth Year.
5
Subjec: Signals and Systems
Lecture 6
Lecture: Dr.Manal Kadhim
Electromechanical Eng.Department
Electromechanical Systems Branch
Fourth Year.
6
Subjec: Signals and Systems
Lecture 6
Lecture: Dr.Manal Kadhim
Electromechanical Eng.Department
Electromechanical Systems Branch
Fourth Year.
7
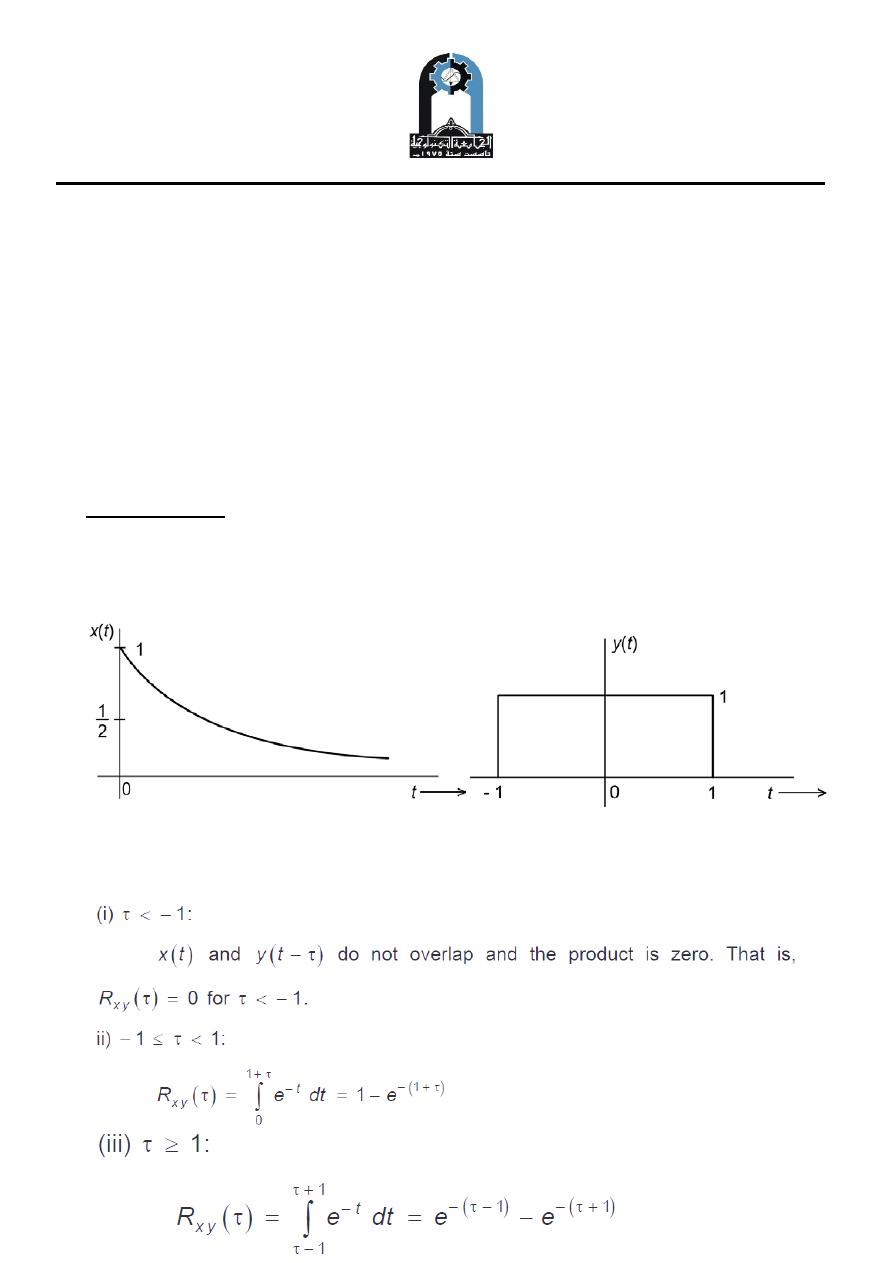
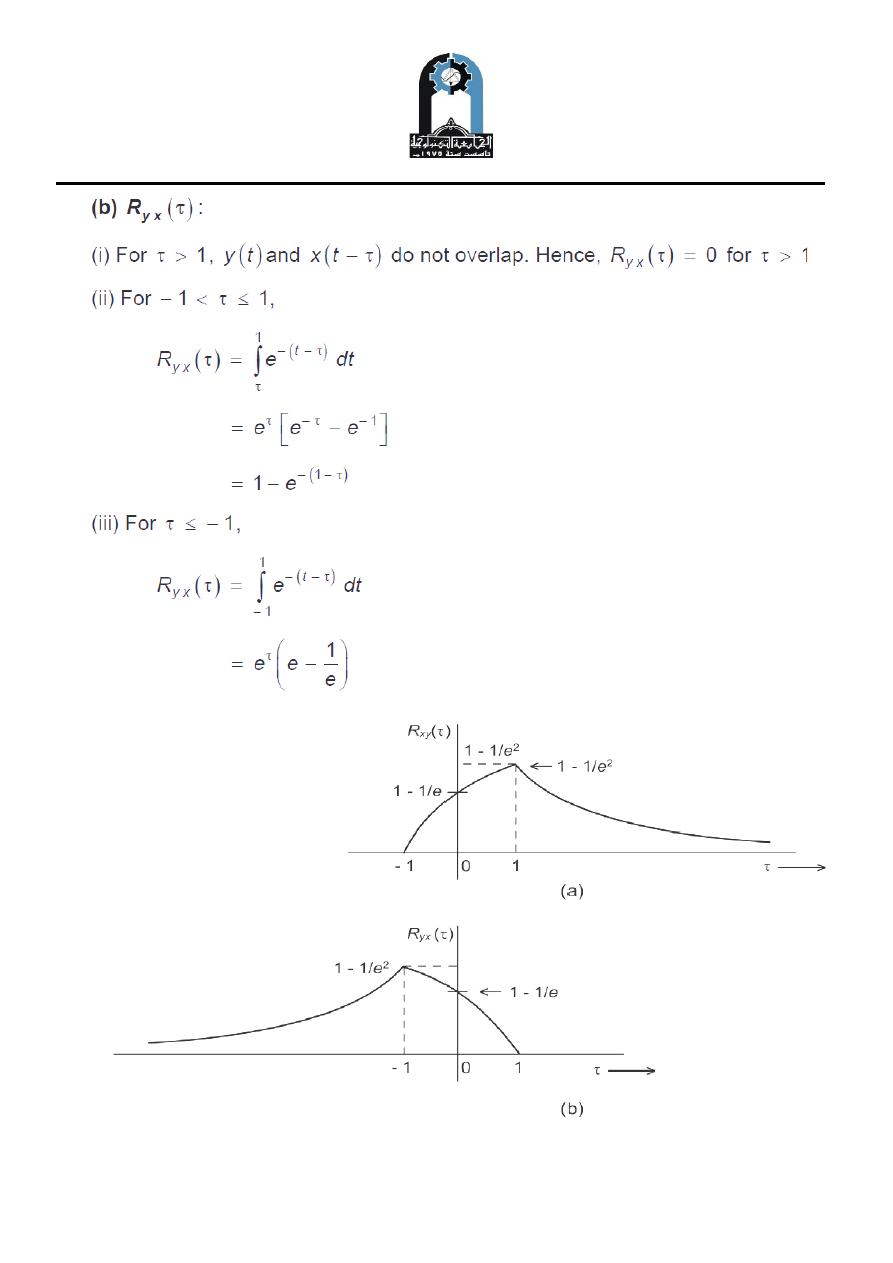
Example Three
Find the cross correlation between two signals shown in Figure below:

Subjec: Signals and Systems
Lecture 6
Lecture: Dr.Manal Kadhim
Electromechanical Eng.Department
Electromechanical Systems Branch
Fourth Year.
8
Subjec: Signals and Systems
Lecture 6
Lecture: Dr.Manal Kadhim
Electromechanical Eng.Department
Electromechanical Systems Branch
Fourth Year.
9