
1
Lect. 1
Cardiovascular system
Introduction to the CVS
(Physiologic anatomy, Heart valves and sounds).
Objectives:
1. Explain the functions of the heart.
2. Describe the flow of blood through the heart.
3. Explain the functions of the heart valves.
4. Explain the mechanism of the heart sounds.
The heart
The heart is a muscular organ enclosed in a fibrous sac (the pericardium).The
pericardial sac contains watery fluid that acts as a lubricant as the heart moves within
the sac. The wall of the heart is composed of cardiac muscle cells, termed the
myocardium. The inner surface of the wall is lined by a thin layer of endothelial cell;
the endothelium. The heart is actually two separate pumps; a right heart which pumps
blood through the pulmonary artery into the lung, and a left heart which pumps blood
through the aorta into the peripheral organ. Each of these two pumps is consists of
two chambers, an atrium and a ventricle, separated by atrioventricular valve (left;
mitral valve and right; tricuspid valve). Blood exists from the right ventricle through
the pulmonary valve to the pulmonary trunk, and from the left ventricle through the
aortic valve into the aorta.
Pulmonary and Systemic Circulations
Blood whose oxygen content has become partially depleted and carbon dioxide
content has increased as a result of tissue metabolism returns to the right atrium. This
blood then enters the ventricle, which pumps it into the pulmonary trunk and
pulmonary arteries. The pulmonary arteries branch to transport blood to the lungs,
where gas exchange occurs between the lung capillaries and the alveoli of the lungs.
Oxygen diffuses from the air to the capillary blood; while carbon dioxide diffuses in
the opposite direction. The blood that returns to the left atrium by way of the pul-
monary veins is therefore enriched in oxygen and partially depleted of carbon
dioxide. The blood that is ejected from the right ventricle to the lungs and back to the
left atrium completes one circuit: called the pulmonary circulation.
Oxygen-rich blood in the left atrium enters the left ventricle and is pumped into a
very large, elastic artery; the aorta. The aorta ascends for a short distance, makes a U-
turn, and then descends through the thoracic and abdominal cavities. Arterial
branches from the aorta supply oxygen-rich blood to all of the organ systems and are
thus part of the systemic circulation. As a result of cellular respiration, the oxygen
concentration is lower and the carbon dioxide concentration is higher in the tissues
than in the capillary blood. Blood that drains into the systemic veins is thus partially
depleted of oxygen and increased in carbon dioxide content. These veins empty into
two large veins; the superior and inferior venae cavae that return the oxygen-poor
blood to the right atrium. This completes the systemic circulation; from the heart
(left ventricle), through the organ systems, and back to the heart (right atrium).

2
Physiology of cardiac muscle
The heart is composed of three major types of cardiac muscle.
1- The atrial muscle.
2- The ventricular muscle.
3- Specialized excitatory and conductive muscle fibers; an excitatory system of the
heart that helps spread of the impulse (action potential) rapidly throughout the
heart.
Physiologic anatomy of cardiac muscle
Cardiac muscle cells (myocytes) are striated as they have typical myofibrils
containing thin actin and thick myosin filaments, similar to those found in skeletal
muscle, which slide along each other during the process of contraction.
Unlike skeletal muscle (no gap junction), adjacent myocardial cells are joined end to
end at structures called intercalated discs, which are cell membranes that have very
low electrical resistance. Within the intercalated discs, there are electrical synapses or
gap junctions, these gap junctions are protein channels that allow ions to flow from
the cytoplasm of one cell directly into the next cell and, therefore action potentials to
move with ease from one cardiac myocyte to another. That is, when one of these cells
becomes excited, the action potential spreads rapidly throughout the intercalated discs
and gap junctions to stimulate the neighbor cell, so the myocardium act almost as if it
is a single cell; a syncytium, i.e., the cardiac muscle contracts or behaves as a single
functional unit (syncytium property).
Innervations of the heart
The heart receives a rich supply of sympathetic and parasympathetic nerve fibers.
The parasympathetic contained in the vagus nerves release acetylcholine which acts
on the muscarinic receptors. The sympathetic postganglionic fibers release
norepinephrine (noradrenaline) which acts on beta one (β
1
) adrenergic receptors
distributed on cardiac muscle. The circulating epinephrine hormone from adrenal
medulla also combines with the same receptors (β
1
receptors).
Blood supply of the heart
The myocardial cells receive their blood supply through arteries that branch from the
aorta, named coronary arteries.
Coronary veins drain into a single large vein, the coronary sinus, which drain into the
right atrium.

3
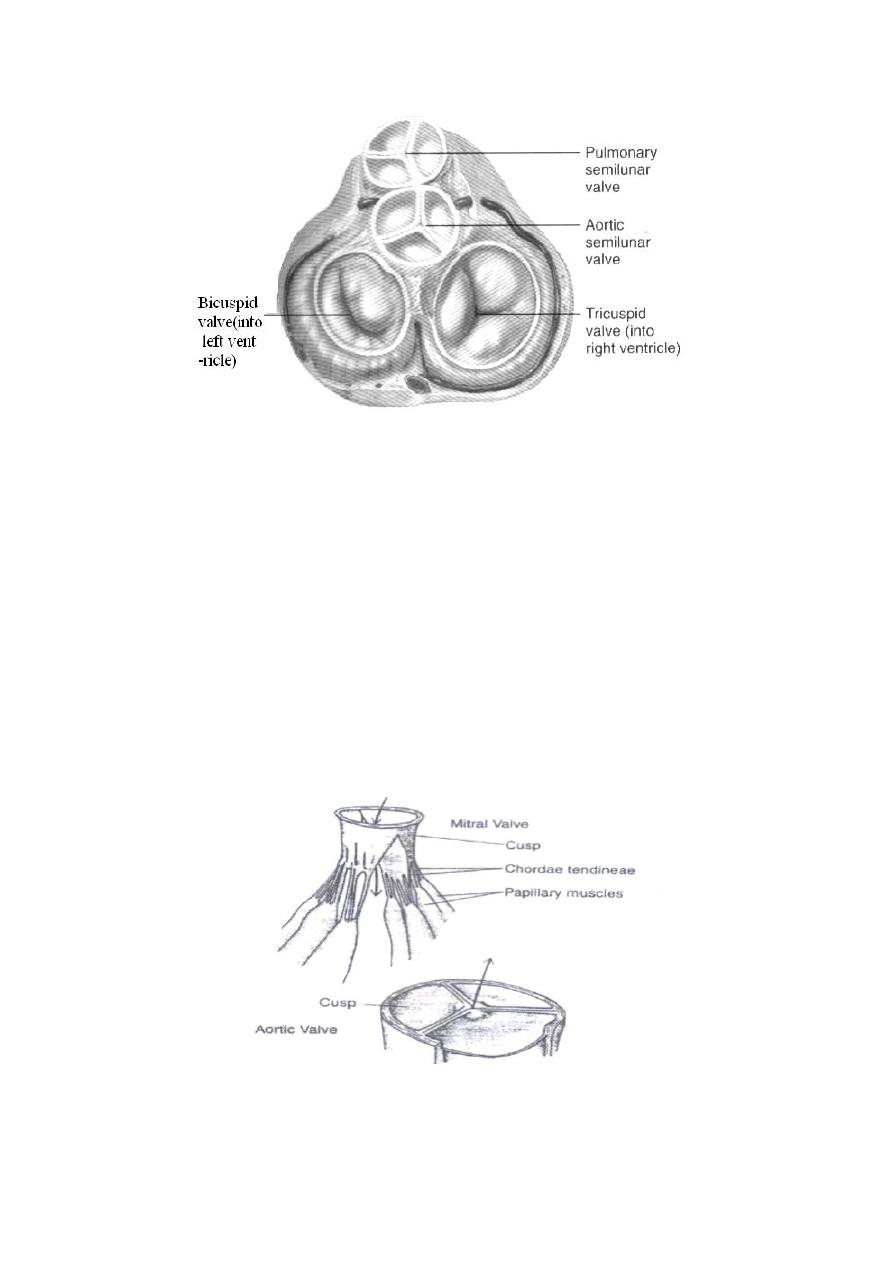
The function of the heart valves
The atrioventricular valves (AV valves) are composed of thin membranous cusps
(fibrous flaps of tissue covered with endothelium), which hangdown in the
ventricular cavities during diastole. After atrial contraction and just before ventricular
contraction, the AV valves begin to close and the leaflets (cusps) come together by
mean of backflow of the blood in the ventricles towards the atria.
The AV valves include:
The mitral valve; the left AV valve; bicuspid valve, which consists of two
cusps (anterior and posterior), located between left atrium and left ventricle.
The tricuspid valve; the right AV valve, which consists of three cusps, located
between right atrium and right ventricle.
The function of AV valves is to prevent backflow (prevent regurgitation; leakage) of
blood into the atria during ventricular contraction. Normally they allow blood to flow
from the atrium to the ventricle but prevent backward flow from the ventricle to the
atria. The atrioventricular valves contain and supported by papillary muscles.
The aortic and pulmonary valves each consist of three semilunar cusps that resemble
pockets projecting into the lumen of aorta and pulmonary trunk. They contain no
papillary muscle. During diastole the cusps of these valves become closely
approximated to prevent regurgitation of blood from aorta and pulmonary arteries
into the ventricles. During systole the cusps are open towards arterial wall, leaving a
wide opening for ejection of blood from the ventricles. In other words, the pulmonary
and aortic valves allow blood to flow into the arteries during ventricular contraction
(systole) but prevent blood from moving in the opposite direction during ventricular
relaxation (diastole).
*All valves close and open passively. That is, they close when a backward pressure
gradient pushes blood backward, and they open when a forward pressure gradient
forces blood in the forward direction.
*There are no valves at entrance of superior, inferior vena cava and pulmonary veins
into the atria. What prevents the backflow of blood from the atria toward the veins is
the compression of these veins by the atrial contraction. However little blood is
ejected back into veins, this represents the venous pulse seen in the neck veins
(jugular veins) when the atria contracting.
4
Function of papillary muscles
The AV valves (mitral and tricuspid) are supported by papillary muscles that attach to
the flaps of these valves by the chordae tendineae.The papillary muscles originated
from the ventricular walls and contract at the same time when the ventricular walls
contract, but these muscles do not help the valves to close or open. Instead, they pull
the flaps of the valves inward, toward the ventricles to prevent too much further
bulging of the flaps (cusps) backward toward the atria during ventricular contraction,
to prevent leakage of blood into the atria (keep the valve flaps tightly closed). In
other words, contractions of papillary muscles prevent evertion of the flaps of the AV
valves into the atria which could be induced by high pressure produced by
contraction of the ventricles.
Figure: Mitral (two cusps) and Aortic (three cusps) valves.

5
Heart Sounds
When the stethoscope is placed on the chest wall over the heart, two sounds are
normally heard during each cardiac cycle (1st & 2nd heart sounds). Heart sounds are
associated with closure of the valves with their associated vibration of the flaps of the
valves and the surrounding blood under the influence of the sudden pressure changes
that develop across the valve. That is, heart sound does not produced by the opening
of the valve because this opening is a slow developing process that makes no noise.
1-The first heart sound (S
1
): is caused by closure of the AV valves when ventricles
contract at systole. The vibration is soft, low-pitched lub.
2-The second heart sound (S
2
): is caused by closure of the aortic and pulmonary
valves when the ventricles relax at the beginning of diastole. The vibration is loud,
high-pitched dup. It is rapid sound because these valves close rapidly and continue
for only a short period i.e., rapid, short and of higher pitch dup.
3-The third heart sound (S
3
): is caused by rapid filling of the ventricles, by blood that
flow with a rumbling motion into the almost filled ventricles; at the middle one
third (1/3) of diastole i.e., it is caused by the vibrations of the ventricular walls
during the period of rapid ventricular filling that follows the opening of AV valves.
It is a low-pitched sound and can be heard after the S
2
. It is heard in normal heart;
in children and in adult during exercise. It is also heard in anemia, and AV valve
regurgitation.
4-The fourth heart sound (S
4
): it is an atrial sound when the atria contract (at late
diastole). It is a vibration sound (similar to that of S
3
) associated with the flow of
blood into the ventricle. It is not heard in normal hearts but occurs during
ventricular overload as in severe anemia, Thyroitoxicosis (hyperthyroidism) or in
reduced ventricular compliance and in hypertension. If present, it is heard before
S
1
. (S
4
, S
1
, S
2
, S
3
).
Heart murmurs
They are abnormal sounds, can be produced by blood flowing rapidly in the usual
direction but through an abnormally narrowed valve (stenosis), by blood flowing
backward through a damaged, leaky valve (incompetent, regurgitant valve) or by
blood flowing between the two atria or two ventricles through a small hole: ASD
(atrial septal defect), VSD (ventricular septal defect).
…………………………………………………………………………………………
*Pitch = the audible range of frequencies (cycles/sec).
6
Lect.2
Properties of the cardiac muscle
In addition, to the syncytium property, the cardiac muscle has the property of:
Automaticity and rhythmicity (Autorhythmicity).
Excitability and conductivity.
Contractility
Autorhythmicity, Excitability and conductivity:
Electrical activity of the heart (action potential):
Objectives:
1. Describe action potentials in cardiac muscle cells.
2. Explain how the SA node functions as the pacemaker.
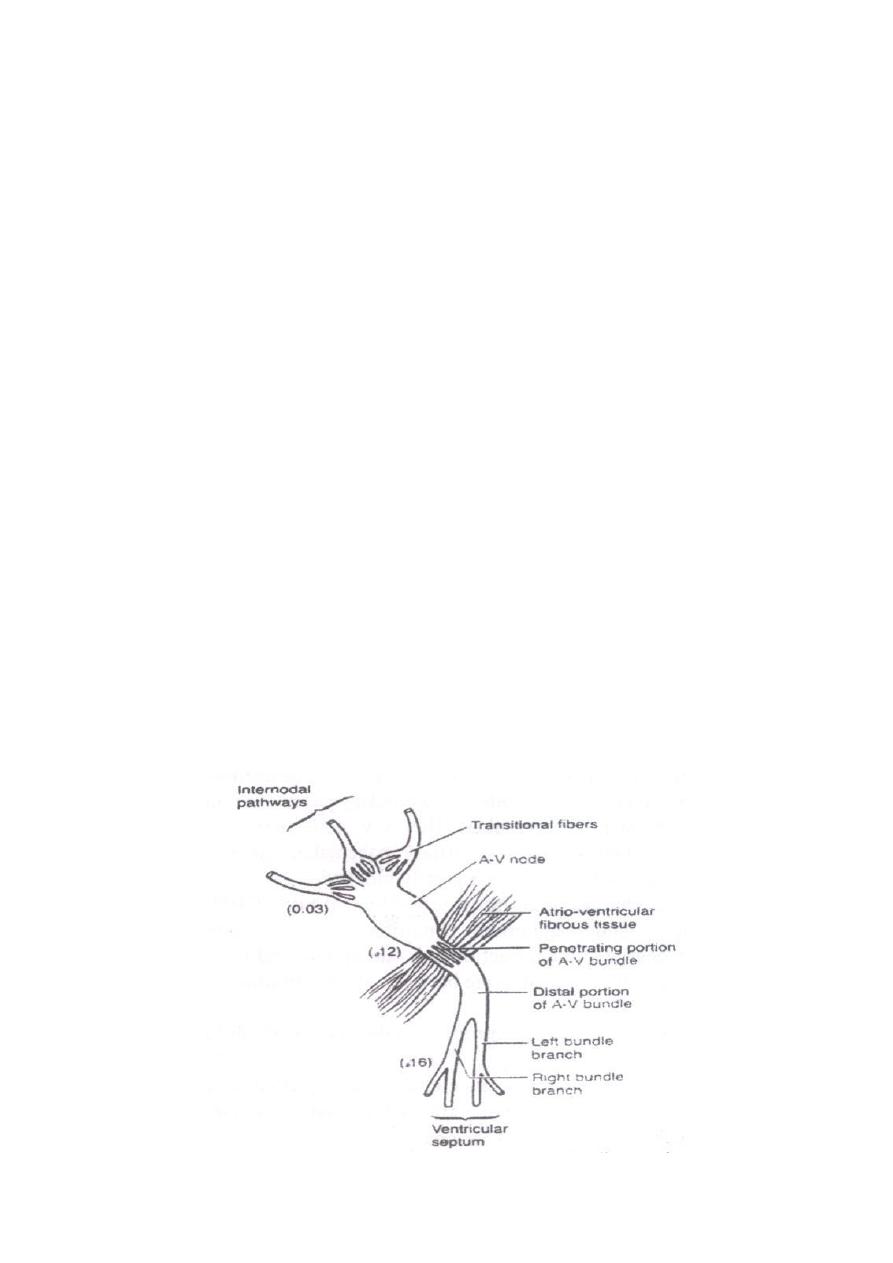
Specialized excitatory and conductive system of the heart: consists of:
1. Sinus node "SA" node: also called sinoatrial node, located in the right atrium. It is
concerned with the generation of rhythmical impulse; it is the pacemaker of the
heart that initiates each heart beat. This automatic nature of the heart beat is
referred to as automaticity.
2. Internodal pathways conduct the impulse generated in SA node to the AV node.
3. The AV node (atrioventricular node), located near the right AV valve at the lower
end of the interatrial septum, in the posterior septal wall of the right atrium. At
which impulse from the atria is delayed before passing into the ventricles.
4. The AV bundle (bundle of His) conducts the impulse from the atria into ventricles.
5. The left and right bundles of purkinje fibers, which conduct the cardiac impulse to
all parts of the ventricles. The purkinje fibers distribute the electrical excitation to
the myocytes of the ventricles.
Figure: organization of the AV node.
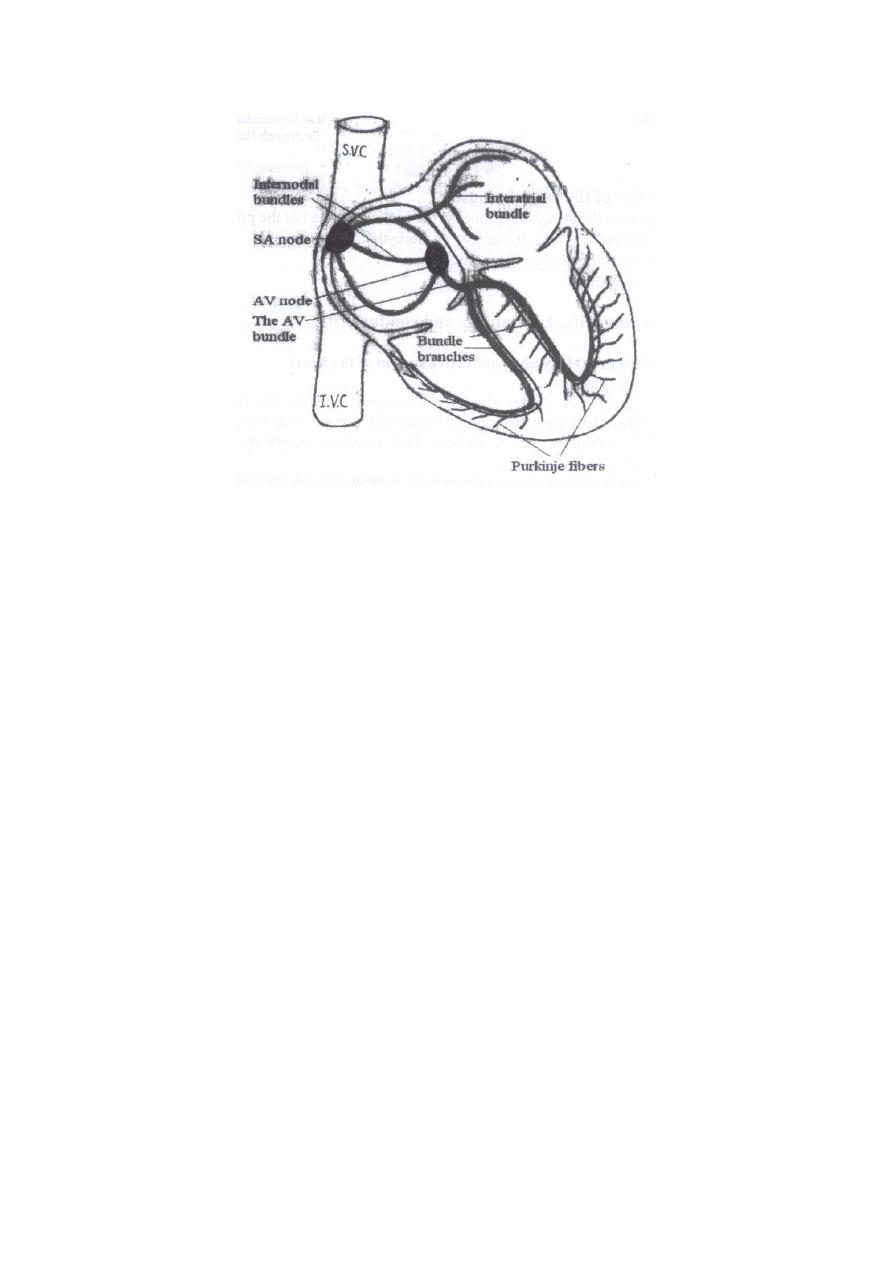
7
Figure: The cardiac conduction system.
The SA node as the pacemaker of the heart: (
Automaticity & rhythmicity)
Automaticity is the property of self-excitation (i.e. the ability of spontaneously
generating action potentials independent of any extrinsic stimuli) while rhythmicity is
the regular generation of these action potentials. In other words, the cardiac impulse
normally arises in the SA node, which has the capability of originating action
potentials and functioning as pacemaker. This action potential then spreads from the
SA node throughout the atria and then into and throughout the ventricles.
The contractile cardiac muscle cells don't normally generate action potentials but they
can do in certain pathological conditions. This mean that all parts of the conduction
system are able to generate a cardiac impulse; (autorhythmicity), but the normal
primary pacemaker is the SA node, while the AV node is a secondary pacemaker and
the Purkinje system is a tertiary (or latent) pacemaker. The AV node acts only if the
SA node is damaged or blocked, while the tertiary pacemaker takes over only if
impulse conduction via the AV node is completely blocked.
The SA node discharges at an intrinsic rhythmical rate of 100-110 times per minute
(sinus rhythm). Under abnormal condition; the AV nodal fibers can exhibit
rhythmical discharge and contraction at a rate of 40 to 60 times/minute. While those
of purkinje fibers discharge at a rate between 15 and 40 times/minute.
Autorhythmicity is a myogenic property independent of cardiac innervation. This is
evidenced by the following:
Completely denervated heart continues beating rhythmically.
Hearts removed from the body and placed in suitable solutions continue
beating for relatively long periods.
The transplanted heart (denervated heart) has no nerve supply but they beat
regularly.
Self-excitation of SA node:
8
What causes the SA node to fire spontaneously?
Although the SA node discharges at an intrinsic rhythmical rate of 100-110 times per
minute but the pulse rate averages 70 or 80 times per minute, this is because of the
effect of vagal tone. SA node does not have a stable resting membrane potential
which starts at about – 60 mV. This is due to the inherent leakiness of the SA nodal
fibers to Na
+
ions that causes this self-excitation (Na
+
influx). in other words, because
of the high Na
+
ions concentration in the ECF as well as the negative electrical charge
inside the resting sinus nodal fibers, the positive Na
+
ions outside the fibers tend to
leak to the inside, rising the membrane potential up to a threshed to fire an action
potential.
Atrioventricular node (AV node):
The conductive system is organized, so that cardiac impulse will not travel from the
atria into ventricles too rapidly. There is a delay of transmission of the cardiac
impulse in the AV node to allow time for the atria to empty their blood into the
ventricles before ventricular contraction begins.
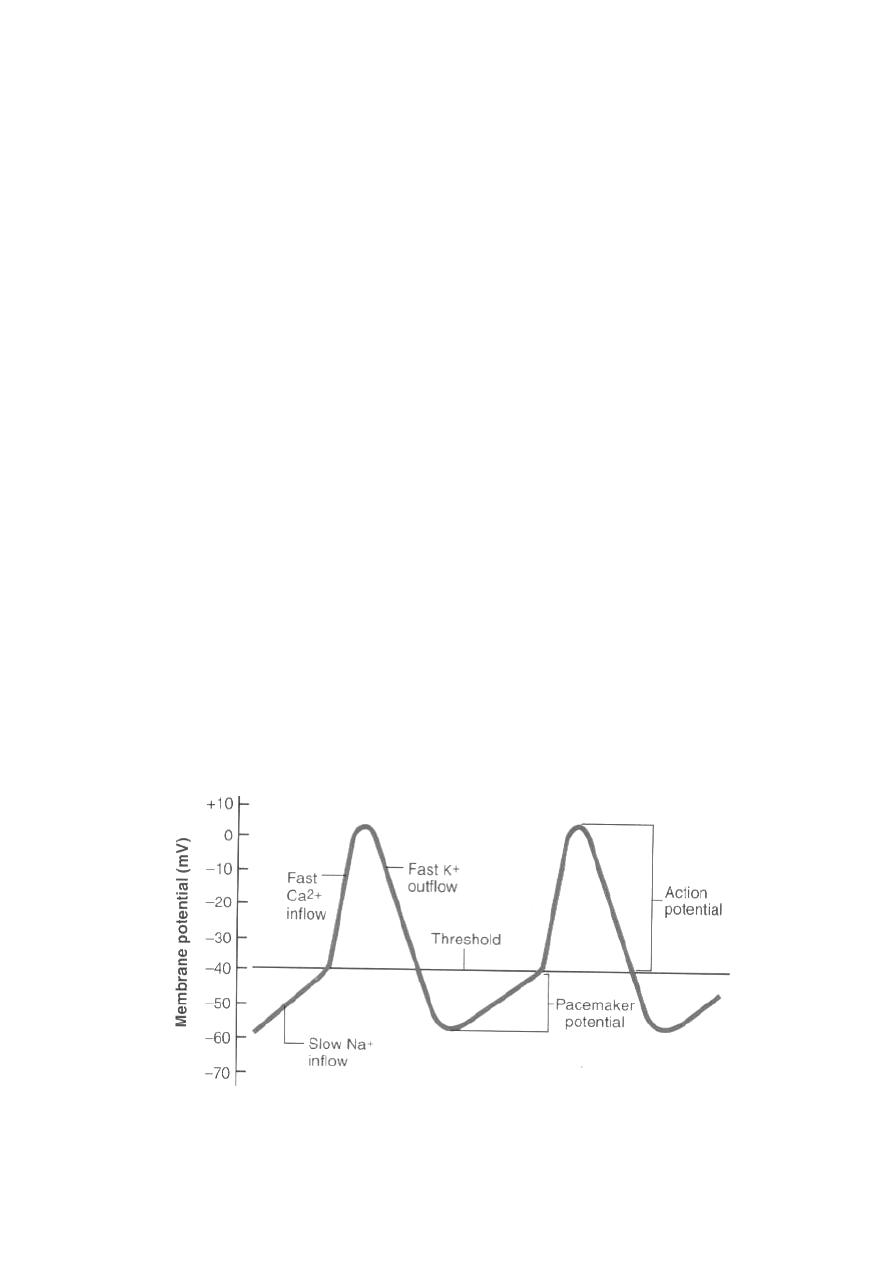
Cardiac action potentials:
Action potential of SA node
The resting membrane potential of SA node is of -55 to -60 mV (millivolts). The
cause of this reduced negativity "less negative" is that the cell membrane of the sinus
fibers are naturally leaky to sodium ions "Na
+
influx". Therefore; Na
+
influx causes
a rising membrane potential "gradual depolarization" which when reaches a threshold
voltage at about - 40 mV, the fast calcium and sodium channels opened, leading to
a rapid entry of both Ca
+2
and Na
+
ions causing the action potential to about 0 mV
(zero), to be followed by repolarization which is induced by K
+
efflux out of the fiber
because of the opening of K
+
channels. This repolarization carries the resting
membrane potential down to about -55 to -60 mV at the termination of action
potential.
Figure: Action potentials of the SA node.

9
Action potential of ventricular cardiac muscle fiber
The membrane potential of cardiac ventricular muscle fiber cells is about -90 mV; the
interior of the cell is electrically negative with respect to the exterior due to
disposition; distribution of ions mainly Na
+
, K
+
and Ca
+2
ions across its membrane.
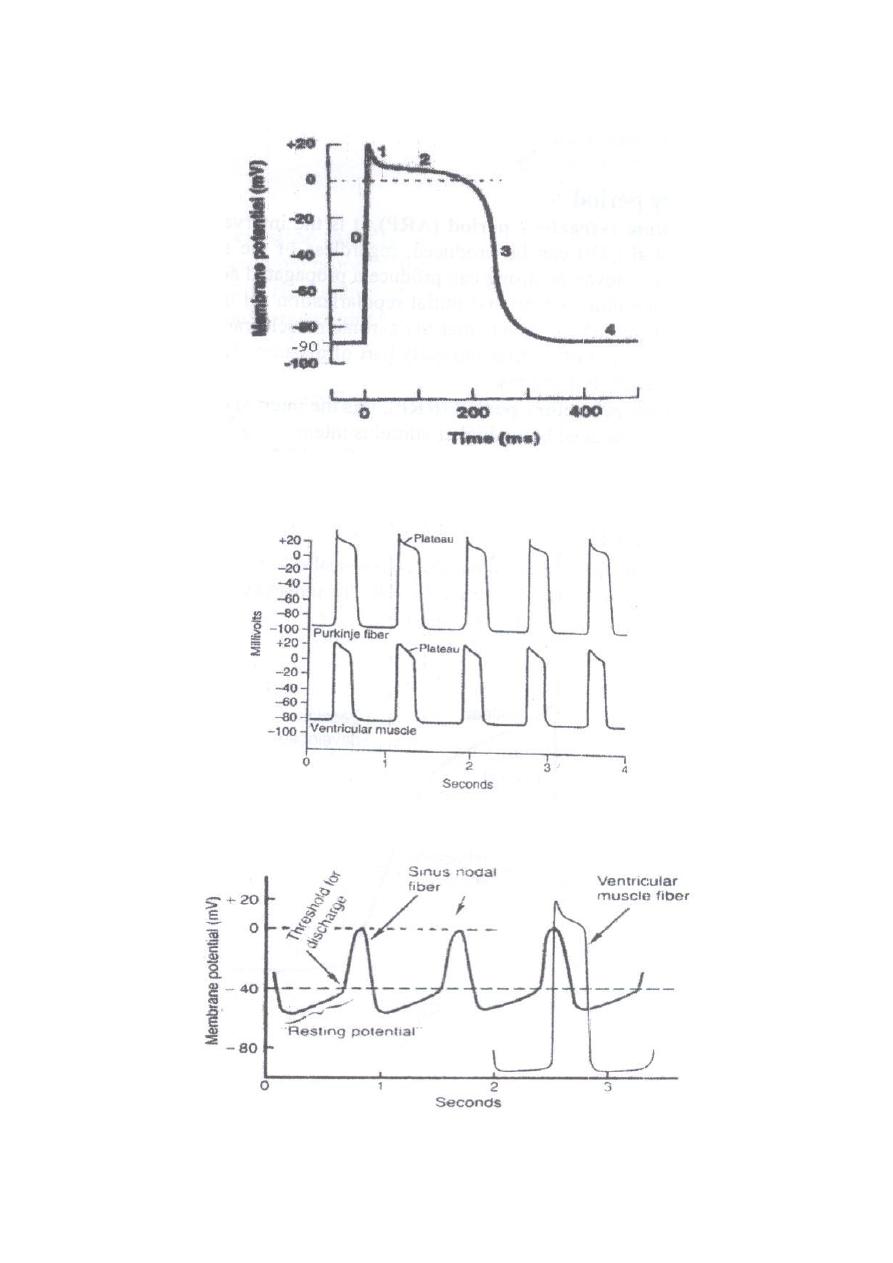
The action potential (AP) is an electrical signal or impulse produced by ionic
redistribution that the potential changes into positive inside the cell (depolarization),
to be followed by restoration of the ions; returning back to the resting potential
(repolarization). Stimulation of cardiac muscle cells by SA produces a propagated
action potential, that is responsible for muscle contraction i.e., excitation-contraction
coupling. In other words, stimulation of cardiac muscle cells specifically those of the
ventricles is performed by the propagated AP of the SA node from which the
electrical impulses originating and propagated over the heart. According to the figure
(a), the propagated AP of the SA node depolarized the ventricular muscle fiber cells
rapidly with an overshoot (phase 0), followed by a plateau at around zero potential
level (phase 2). This plateau is unique for the heart muscle; and is followed by phase
3 and 4; as final repolarization i.e., for the potential to return to baseline.
Ionic basis of the action potential of the cardiac ventricular muscle fiber cell:
The action potential of cardiac ventricular muscle fiber cell includes the following
phases (a):
Phase 0 (upstroke): initial rapid depolarization with an overshoot to about
+20 mV are due to opening of the voltage-gated Na
+
channels with rapid Na
+
influx.
Phase 1 (partial repolarization): initial rapid repolarization is due to K
+
efflux
(K
+
outflow) followed the closure of Na
+
channels when the voltage reaches at
nearly +20 mV.
Phase 2 (plateau): subsequent prolonged plateau is due to slower and
prolonged opening of the voltage-gated Ca
+2
channels with Ca
+2
influx, Ca
+2
enter through these channels prolong depolarization of the membrane.
Phase 3 (rapid repolarization): final repolarization is due to opening of the
voltage-gated K
+
channels at zero voltage with rapid K
+
outflow (K
+
efflux)
followed the closure of Ca
+2
channels and, this restores the membrane to its
resting potential.
Phase 4 (complete repolarization): The membrane potential goes back to the
resting level (-90 mV) i.e., restoration of the resting potential. This is achieved
by the Na
+
-K
+
pump that works to move the excess K
+
in and the excess Na
+
out.
10
Figure (a): The action potential of the ventricular muscle fiber.
Figure: Rhythmical action potentials from a purkinje and ventricular muscle fibers.
Figure: Rhythmical discharge of SA nodal fiber, compared with action potential of
ventricular muscle fiber.
11
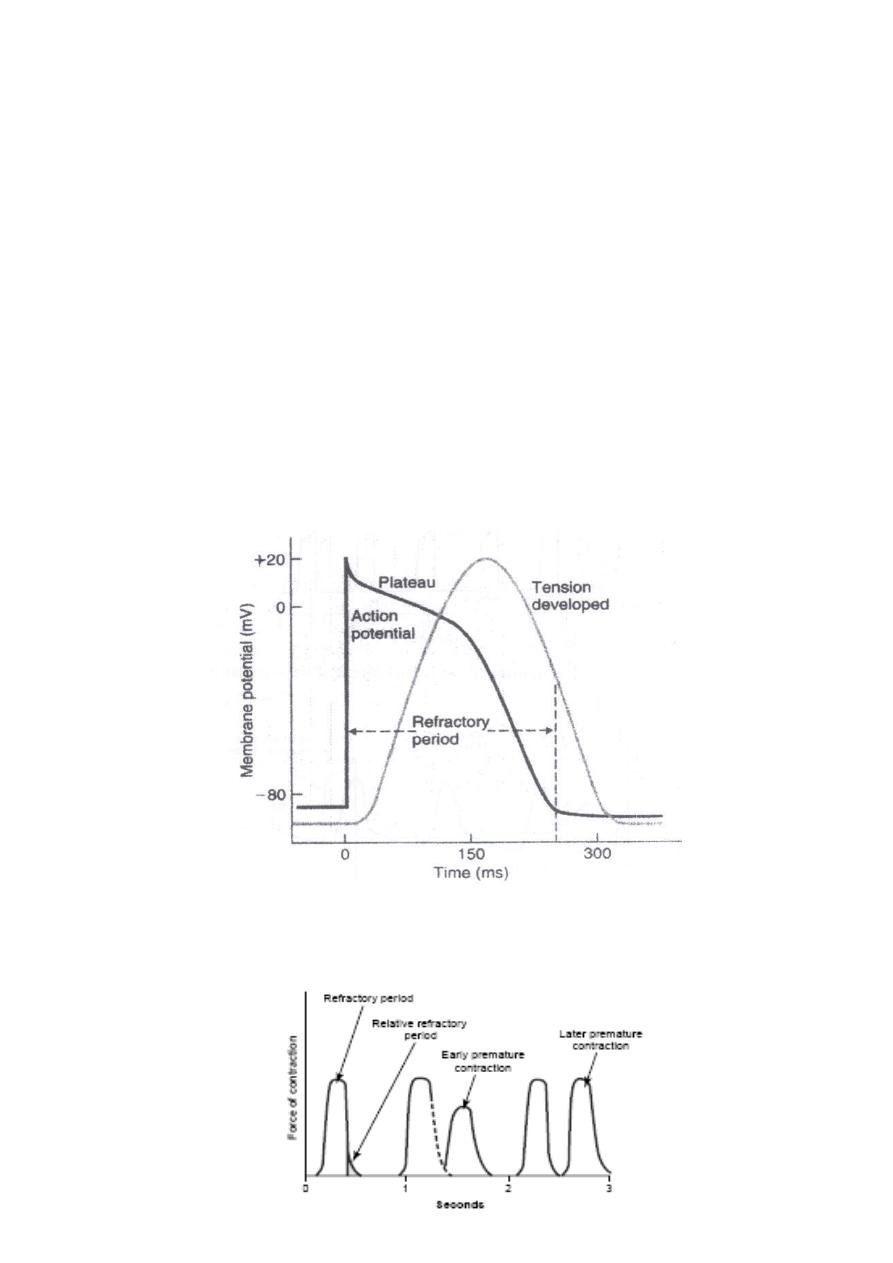
Refractory period:
Absolute refractory period (ARP), it is the interval during which no action
potential can be produced, regardless of the stimulus intensity i.e., no stimulus
however strong, can produce a propagated action potential. It lasts the upstroke
plus plateau and initial repolarization till mid-repolarization at about -50 to -60
mV. It means that the cardiac muscle can not be exited during the whole period
of systole and early part of diastole. This period prevents waves summation
and tetanus.
Relative refractory period (RRP), it is the interval during which a second
action potential can be produced but at higher stimulus intensity i.e., the heart
responds only to stronger stimuli. It lasts from the end of ARP
(midrepolarization) and ends shortly before complete repolarization i.e., it lasts
for a short period during diastole.
Figure: Relationship between membrane potential changes and contraction in
a ventricular muscle cell. The refractory period lasts almost as long as the
contraction.

12
Lect. 3
Con. on Properties of the cardiac muscle:
Contractility
Objectives:
1. Describe the major properties of cardiac muscle.
2. Discuss Frank-Starling law.
3. Describe how an action potential causes contraction (cardiac excitation-
contraction coupling).
Contractility is the ability of the cardiac muscle to contract.
The effect of various factors on contractility is called inotropism; a positive (+ve)
inotropic effect means an increase in myocardial contractility, whereas a negative
(-ve) inotropic effect means a decrease in myocardial contractility.
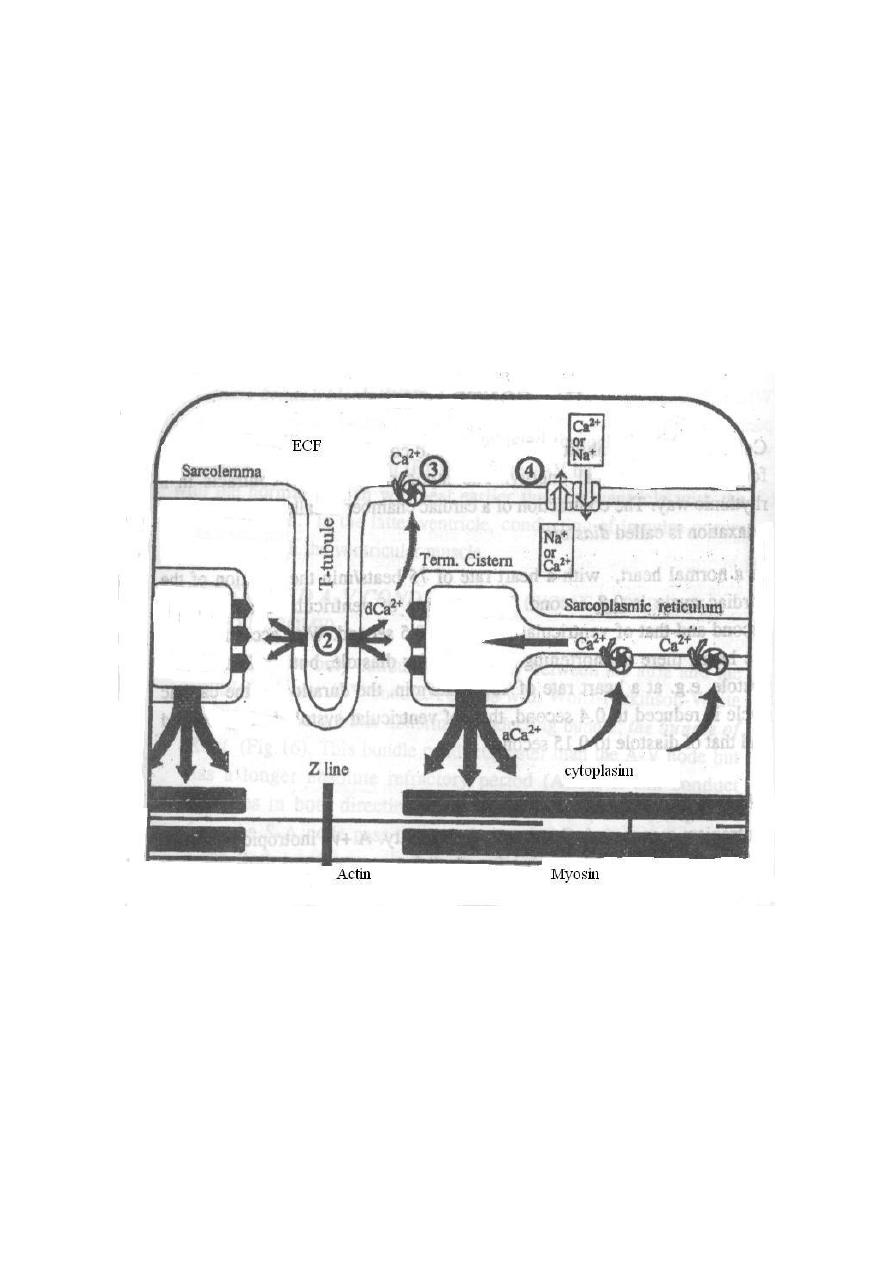
Excitation-Contraction coupling in the heart muscle:
As in skeletal muscles, the depolarization wave reaching via the T tubules causes the
opening of Ca
+2
channels in the sarcoplasmic reticulum adjacent to the T-tubules. The
released Ca
+2
from the cisternae of the sarcoplasmic reticulum (activator Ca
+2
; aCa
+2
)
binds to troponin C, leading to cross bridge formation between actin and myosin,
which results in contraction.
In cardiac muscle, the amount of this activator Ca
+2
is often insufficient to initiate
contraction, but it can be increased indirectly by the following mechanism:
The depolarization wave in the T-tubules opens the long-lasting Ca
+2
channels in the
T-tubule membrane, and sarcolemma, Ca
+2
diffuses from the ECF through these
channels into the cardiac muscle fibre cell causing a small increase in the cytosolic
(fluid of the cytoplasm) calcium concentration in the region of the T-tubules and
adjacent sarcoplasmic reticulum. This Ca
+2
is called depolarizing Ca
+2
, and although
its amount is normally very small, yet it is important because it acts as a signal for the
release of large amount of activator Ca
+2
from the cisternae of sarcoplasmic
reticulum, it is mainly this cytosolic Ca
+2
that causes the contraction, i.e. once Ca
+2
is
in the cytoplasm, it binds to troponin and stimulates contraction. As a result,
myocardial cells contract when they are depolarized. The force of contraction is
directly proportional to the amount of cytosolic Ca
+2
.
Contraction ends when the cytosolic Ca
+2
concentration restored to its original level.
In other words, relaxation of the cardiac muscle occurs as a result of release of the
actin-myosin combination, this is achieved by decreasing the intracellular Ca
+2
to its
pre- contraction level, which occurs by:
1- Active re uptake of Ca
+2
into the sarcoplasmic reticulum by Ca
+2
pump (primary
active transport of Ca
+2
).
13
2- Active pumping of excess Ca
+2
outside the fibres by Na
+
- Ca
+2
exchanger carrier
protein (secondary active transport ; counter transport).
The heart normally cannot be stimulated again until after it has relaxed from its
previous contraction because myocardial cells have long refractory periods that
correspond the long duration of their action potentials. Summation of contractions
and tetanus are thus prevented, and the myocardium must relax at each contraction to
ensure the rhythmic pumping action of the heart.
Figure: (2) = slow calcium channel, dCa
+2
= depolarizing calcium, (3) = Ca
+2
-pump
(active transport), (4) = Na
+
-Ca
+2
Exchanger, aCa
+2
= activator calcium.
Factors that affect cardiac contractility:
Mechanical
Cardiac
Extra cardiac
Mechanical factors:
Preload (venous return)
Afterload

2
The preload:
The preload is the load that determines the initial length of the resting muscle before
contraction. The level of the preload is represented by the end-diastolic volume
(EDV) i.e., by the venous return (VR). It affects the tension developed in the muscle.
When the venous return (EDV), increases, the strength of ventricular contraction
increases too, leading to an increase in the stroke volume (Frank-Starling law).
Frank-Starling's law of the heart
This law describes the length-tension relationship in muscles; it states that the force
of contraction of the ventricles depends on the initial length of ventricular muscle
fibers. In such a way, that the force of myocardial contraction is directly proportional
to the initial length of the cardiac muscle fibres (i.e. to the preload (VR) or EDV).
This means that the greater the degree of stretching of the myocardium before
contraction, the greater the force of contraction. In other words, Frank-Starling law
reflects the relationship between ventricular end-diastolic volume (EDV) and stroke
volume; when the blood returns to the heart during the filling phase, this blood will
distend the ventricles so the ventricles will produce more powerful contraction to
pump the increased volume of the blood.
The Significance of Frank-Starling's law
The Starling's law allows autoregulation of myocardial contractility (regulation of the
contractility by changing the length of the muscle fibers), in the following conditions:
(1) In normal hearts. Starling's law allows changes in the right ventricular
output to match changes in the venous return (VR), and maintains equal
outputs from both ventricles. For example, if the systemic VR increases,
the EDV of the right ventricle increases, leading to a forceful contraction
that increases its output to match the increased VR. At the same time, the
increased right ventricular output increases the pulmonary VR to the left
ventricle, which also increases its EDV, resulting in an increase of its output,
which balances the increased right ventricular output.
(2) In denervated hearts (e.g. transplanted hearts); autoregulation of myocardial
contractility becomes the main mechanism.
(3) In cases of rise of the arterial blood pressure: the stroke volume of the left
ventricle would decrease. However, the retained blood in the left ventricle plus
blood returning to it from the left atrium during the next diastole increase the
EDV. This leads to a forceful contraction, thus the accumulated blood in the left
ventricle will be ejected in spite of the increased arterial blood pressure.
The Afterload:
The afterload is the load that the muscle faces when it begins to contract. In the intact
heart, the afterload is produced by the aortic impedance which is determined by:

3
The aortic pressure (arterial systolic blood pressure).
The arterial wall rigidity (arteriosclerosis).
Blood viscosity (polycythemia).
Cardiac factors:
The myocardial mass.
The heart rate.
The myocardial mass:
A significant injury or loss of the functioning ventricular muscle (e.g. due to
ischemia or necrosis) decreases the force of myocardial contractility. This also occurs
in cases of heart failure.
The heart rate:
The force of cardiac contractility is affected by the frequency of stimulation. An
increase in the frequency of stimulation (i.e. shortening the intervals between the
stimuli) causes a proportional increase in the force of contraction.
Accordingly, tachycardia causes a +ve inotropic effect while bradycardia exerts a -ve
inotropic action. The +ve inotropic effect in tachycardia is due to the increase in the
number of depolarization (which increases the intracellular Ca
+2
content and its
availability to the contractile proteins (troponin C)).
Extra cardiac factors:
These factors affect the cardiac inotropic state and they include the following:
Neural
Physical
Chemical

1
Neural factors:
Sympathetic stimulation and noradrenaline exert a +ve inotropic effect by increasing;
Cyclic-AMP in the cardiac muscle fibres (which leads to activation of the Ca
+2
channels and more Ca
+2
influx from the ECF).
The heart rate.
Conversely, parasympathetic stimulation and acetylcholine exert a -ve inotropic
effect (by opposite mechanism) but on the atrial muscle only (since the vagi nerves
don't supply the ventricles).
Physical factors:
A moderate rise of the body temperature strengthens cardiac contractility (by
increasing the Ca
+2
influx and ATP formation in the muscle) while an excessive rise
of the body temperature (e.g. in fever) exhausts the metabolic substrates in the
cardiac muscle and decreases its contractility. Hypothermia also decreases cardiac
contractility.
Chemical factors:
(A) Hormones:
Catecholamines (epinephrine, norepinephrine and dopamine), glucagon and the
thyroid hormones; all exert a +ve inotropic effect.
(B) Blood gases:
Moderate hypoxia (O
2
lack) and hypercapnia (CO
2
excess) increase the cardiac
contractility, whereas severe hypoxia and hypercapnia directly depress the cardiac
muscle and decrease its contractility.
(C) H
+
ion concentration (pH):
An increase of the blood [H
+
] i.e. drop of the blood pH (acidosis) produces a -ve
inotropic effect, whereas a decrease of the blood [H
+
] i.e. rise of the blood pH
(alkalosis) produces a + ve inotropic effect.
(D) Inorganic ions:
Sodium: Hypernatraemia favors Na
+
influx and Ca
+2
efflux by the
Na
+
-Ca
+2
exchanger carrier, thus it has a -ve inotropic effect. On the other
hand, hyponatraemia exerts a +ve inotropic effect by an opposite mechanism.
Potassium: Hyperkalaemia has a -ve inotropic effect (weakens the myocardial
contractility; flaccidity) and may stop the heart in diastole. This is because the
excess K
+
in the ECF decreases the resting membrane potential (more positive
resting membrane potential; closer to the threshold)) in the cardiac muscle
fibers, so the amplitude of the action potential is reduced leading to less influx
of the depolarizing Ca
+2
and in turn less release of activator Ca
+2
from the
sarcoplasmic reticulum. In addition, Hyperkalaemia increases excitation and
decreases conduction leading to ectopics and dilated, flaccid heart. On the
other hand, hypokalaemia produces a +ve inotropic effect by an opposite
mechanism.
Calcium: Hypercalcaemia exerts a +ve inotropic effect as a result of more
cytosolic Ca
+2
. Whereas hypocalcaemia has a little (or no) -ve inotropic effect,
since lowering of the serum Ca
+2
level causes fatal tetany before affecting the

2
heart. However, hypocalcaemia causes cardiac flaccidity like Hyperkalaemia.
(E) Toxins:
Several toxins (e.g. certain snake venoms and the toxin released by the diphtheria
microorganisms) produce a-ve inotropic effect (mostly by a direct action on the
contractile mechanism of the cardiac muscle).
(F) Drugs:
Cardiac glycosides (e.g. digitalis; Digoxin): These drugs inhibit the Na
+
-K
+
ATPase in the sarcolemma of the cardiac muscle fibres, so the intracellular Na
+
concentration increases. This decrease the Na
+
influx, thus Ca
+2
efflux through
the Na
+
-Ca
+2
exchanger is also decreased. Accordingly, the intracellular Ca
+2
concentration increases, producing a +ve inotropic effect. Digitalis also
increases the slow Ca
+2
influx during the action potential.
Xanthines (e.g., caffeine and theophylline; bronchodilator): They exert a +ve
inotropic effect.
Ouinidine, barbiturates, procainamide (and other anesthetic drugs) as well as
Ca
+2
blocker drugs all have a -ve inotropic effect by decreasing Ca
+2
influx into
the cardiac muscle fibres.

3
Lect. 4
The Cardiac cycle
Objectives:
1. Describe the pressure profiles in the left atrium, left ventricle and the aorta for
a single cardiac cycle.
2.
Explain the origin and indicate the positions of the 1st and 2nd heart sounds
.
3. Draw the profile of pressure changes in the
external jugular vein, labeling the
three component waves.
4. Draw a classical ECG waveform on the time-base schedule.
The cardiac events that occur from the beginning of one heartbeat to the beginning of
the next are called the cardiac cycle. Each cycle is initiated by spontaneous
generation of an action potential in the sinus node which travels rapidly through both
atria and then through the A-V bundle into the ventricles.
Because of this special arrangement of the conducting system from the atria into the
ventricles, there is a delay of more than 0.1 second during passage of the cardiac
impulse from the atria into the ventricles. This allows the atria to contract, pumping
blood into the ventricles before the strong ventricular contraction begins. Thus, the
atria act as primer pumps for the ventricles, and the ventricles in turn provide the
major source of power for moving blood through the body’s vascular system.
In a normal heart, cardiac activity is repeated in a regular cycle. At a normal heart
rate of about 72 beats/minute; for the atria, the cycle lasts for about 0.15 second in
systole and 0.65 second in diastole. For the ventricles, the duration of each cardiac
cycle lasts about 0.8 second. If the heart rate increases, the diastole decreases, which
means that the heart beating very fast may not remain relaxed long enough to allow
complete filling of the ventricles before the next contraction.
For the ventricles, the two major phases of the cardiac cycle are:
The diastole; a period of ventricular relaxation in which the ventricles fill with
blood and it last for about 0.5 second.
The systole; a period of ventricular contraction and blood ejection, lasting
about 0.3 second.
Phases of the cardiac cycle:
The cardiac cycle starts by atrial systole followed by ventricular systole then by
diastole of the whole heart.
Atrial systole (atria as a pump):
It is the first phase of cardiac cycle. Blood normally flows continually (passively)
from the veins into the atria and about 75% of the blood in the atria flow directly into
the ventricles even before the atrial contraction. Then, atrial contraction usually
causes an additional 25% filling of the ventricles. So the heart can continue to operate
satisfactorily under most condition without this extra 25%, yet this 25% is needed in
case of exercise.
4
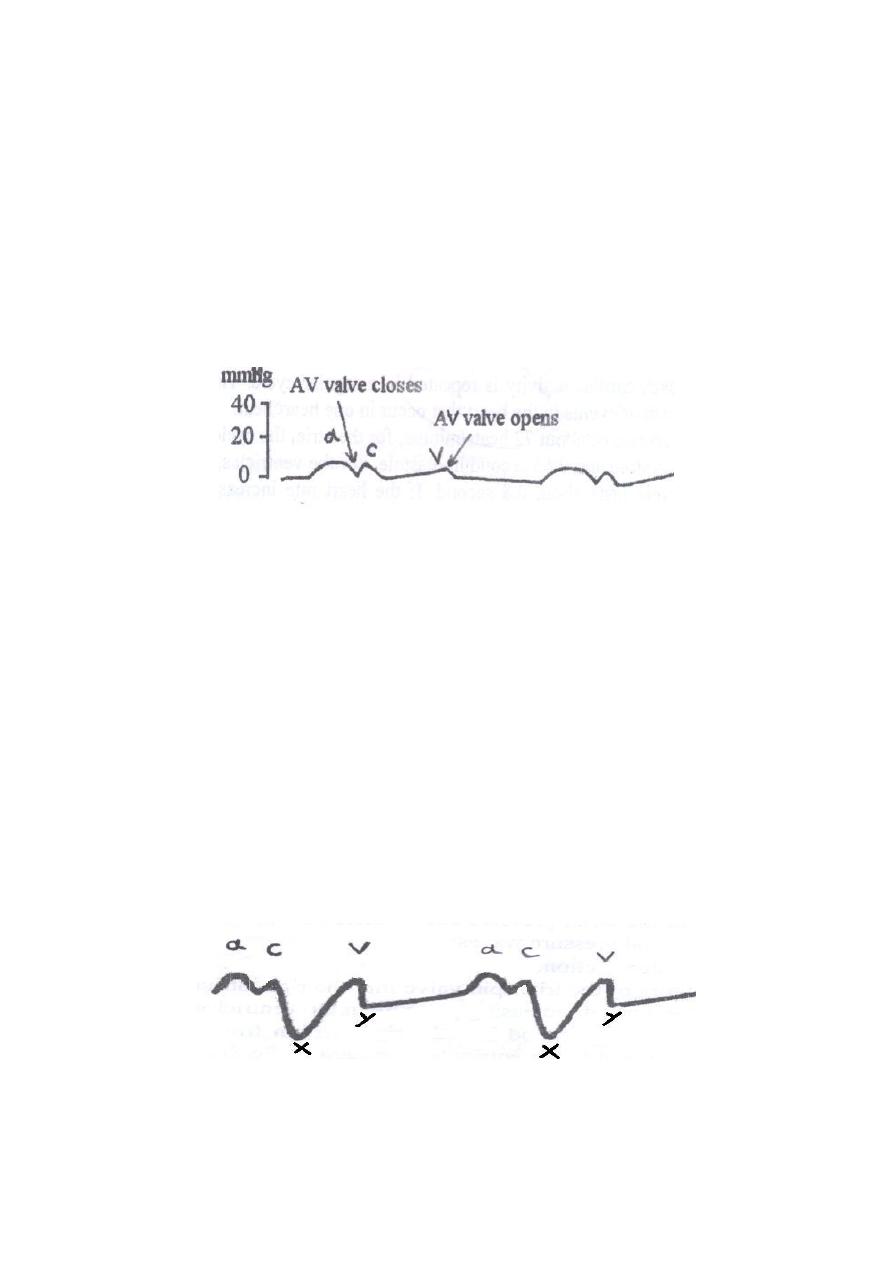
Pressure changes in the atria during cardiac cycle
During atrial contraction; right atrial pressure raises 4 to 6 mmHg, while the left atrial
pressure raises 7 to 8 mmHg. In the atrial pressure curve, there are 3 major pressure
elevations called the
a
,
c
and
v
atrial pressure waves:
a
wave is caused by atrial contraction.
c
wave is caused by bulging of the tricuspid valve into the right atrium during
ventricular contraction because of increasing pressure in the ventricles.
v
wave result from slow flow of blood into the right atrium from the veins
while the AV valve are closed during ventricular contraction. So the
v
wave is
due to atrial filling.
Figure: Atrial pressure curve.
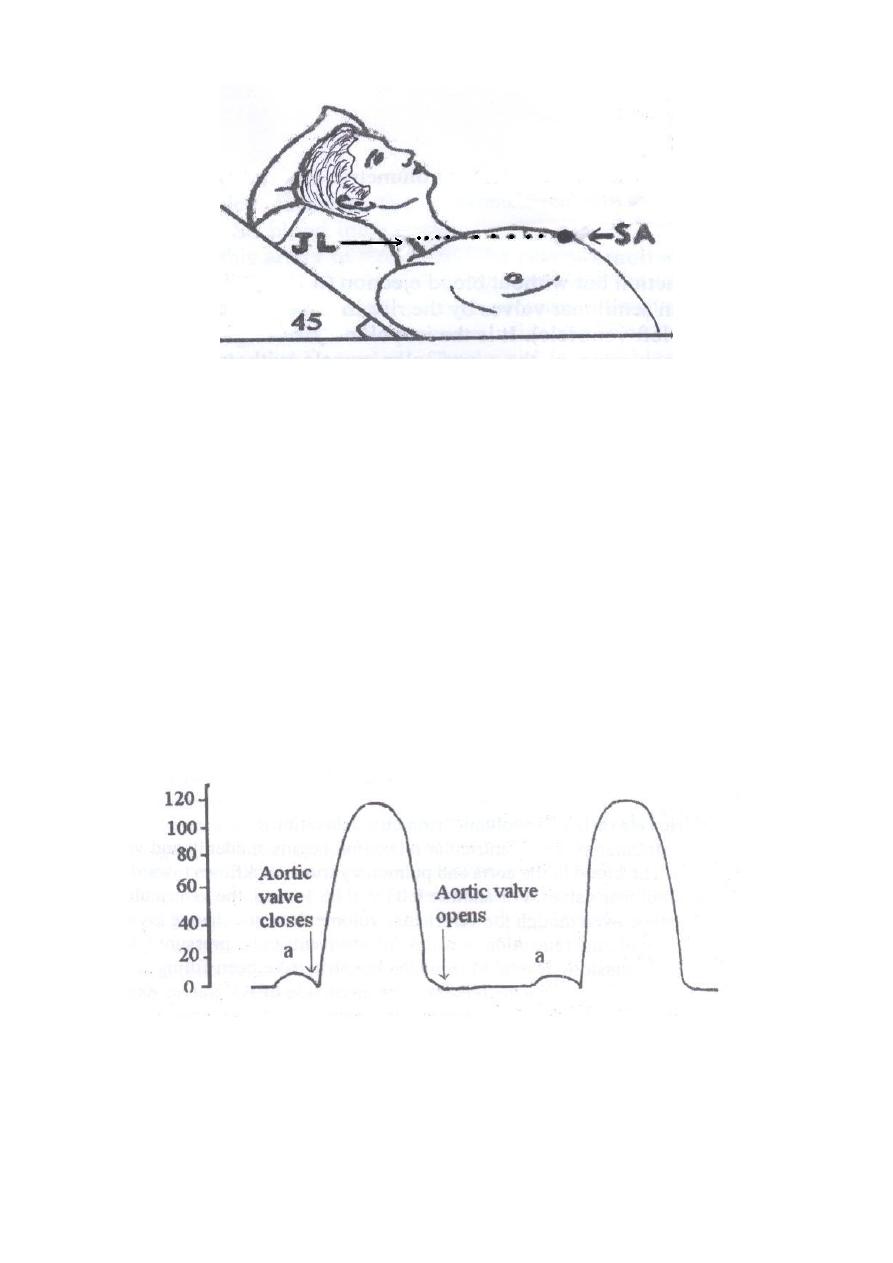
Clinical importance of atrial waves
Venous pulsations occur only in large veins near the heart like the jugular veins in the
neck (the jugular venous pulsations). The jugular venous pulse reflects changes in
right atrial pressure (the central venous pressure), i.e. the pressure changes within the
right atrium are communicated to the neck jugular veins. To make the jugular venous
pulsations visible in the neck, the person has to be supine with his back at a slight
angle to the horizontal (45 degree). In this position, the
a
and
v
waves can be seen in
the jugular veins when the neck is carefully examined. When the venous pressure is
raised as in heart failure disease, the jugular veins become more prominent and the
pulsation can be observed in the neck.
x-descent is caused by pulling the AV ring down during ventricular systole;
drop in right atrial pressure.
y-descent is caused by the opening of the AV valve and the escape of the blood
from the atrium into the ventricle; drop in right atrial pressure.
Figure: Normal jugular venous sphygmogram.
5
Figure: The position to examine normal jugular venous pulsation. JL = upper level
where jugular pulsations appear (jugular level). SA = sternal angle level.
Ventricular cardiac cycle
The ventricular cardiac cycle consists of three phases:
Phase one: Ventricular filling.
Phase two: Ventricular systole.
Phase three: Isovolumic, isometric relaxation.
Ventricular filling
During ventricular systole, the accumulated large amounts of blood in the atria
because of the closed AV valves push the AV valves open and allow blood to flow
rapidly into the ventricles. During atrial contraction, an additional amount of blood
flows into the ventricles represent 25% of the filling of the ventricles.
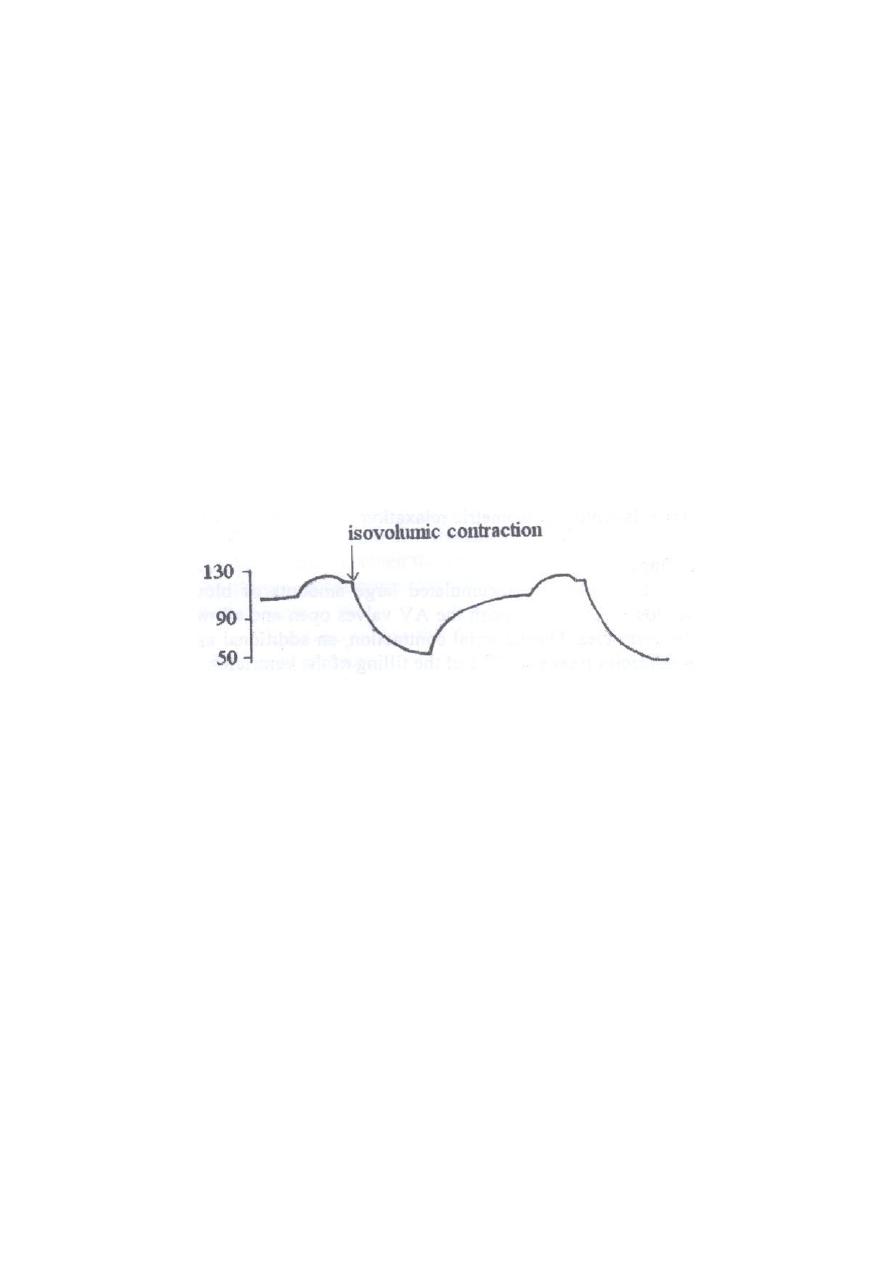
Figure: Ventricular pressure curve.
6
Ventricular systole:
Subdivided into two phases:
Isovolumic, isometric contraction (isovolumetric contraction).
Ventricular ejection.
Isovolumetric contraction
It is ventricular contraction but without blood ejection (no emptying) just to close the
AV valves and to open semilunar valves by the rise in intraventricular pressure (from
0 to 80 mmHg in the left ventricle). It is the isovolumetric contraction, which means
only the tension is increasing in the ventricular muscle without shortening of the
muscle and with no change in blood volume.
Ventricular ejection
The blood ejected from the ventricles into pulmonary trunk and aorta when the
ventricular pressure rises and forces the semilunar valves open.
Left ventricular pressure rises above 80 mmHg.
Right ventricular pressure rises above 8 mmHg.
Figure: Ventricular volume curve.
Isovolumetric relaxation
:
Isovolumic, isometric relaxation; following ventricular systole, ventricular relaxation
begins suddenly and ventricular pressure falls. The blood in the aorta and pulmonary
trunk backflows toward the heart closing the semilunar valves. For another 0.03 to
0.06 second, the ventricular muscle continues to relax, even though the ventricular
volume does not change giving rise to the period of isovolumic relaxation in which
the intraventricular pressure falls rapidly back to their low diastolic levels.
Meanwhile, the atria have been filling with blood. When the pressure exerted by the
blood on the atrial side of AV valves exceeds that in the ventricles, AV valves forced
open and the ventricular filling phase begins again for a new cycle of ventricular
pumping.
7
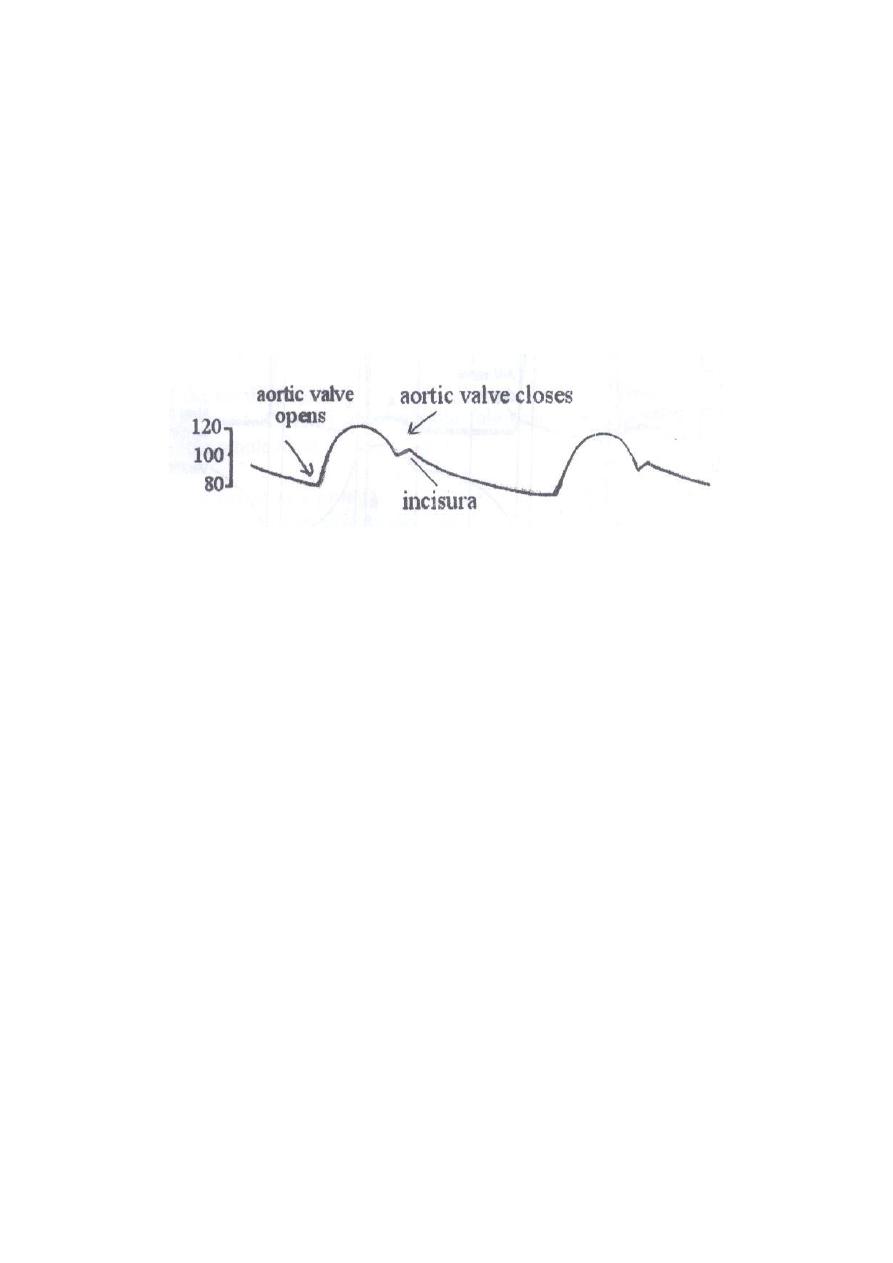
Aortic pressure curve:
When the left ventricle contracts, the intraventricular pressure rises rapidly until the
aortic valve opens. So blood immediately flows out of the ventricle into the aorta,
causes the wall of this artery to stretch and the pressure rise. Then, at the end of the
systole, after the left ventricle stops ejecting blood and the aortic valve closes, the
elastic recoil of the arteries maintains a high pressure even during diastole (diastolic
pressure = 80 mmHg).The systolic pressure inside the aorta is equal to 120 mmHg.
Incisura: is caused by a short period of backward flow of blood from the ventricle
immediately before closure of the valve followed then by sudden cessation of the
backflow.
Figure: Aortic pressure curve.
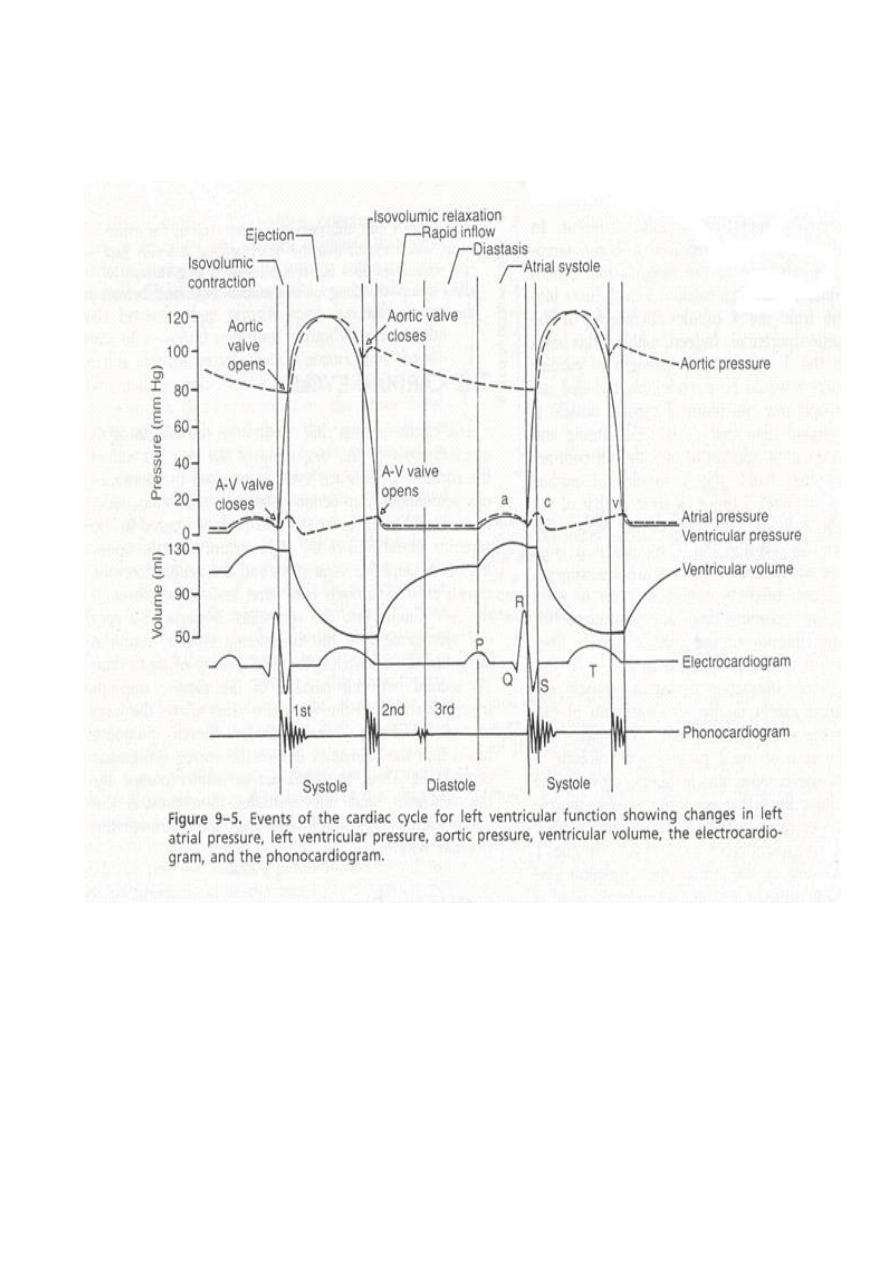
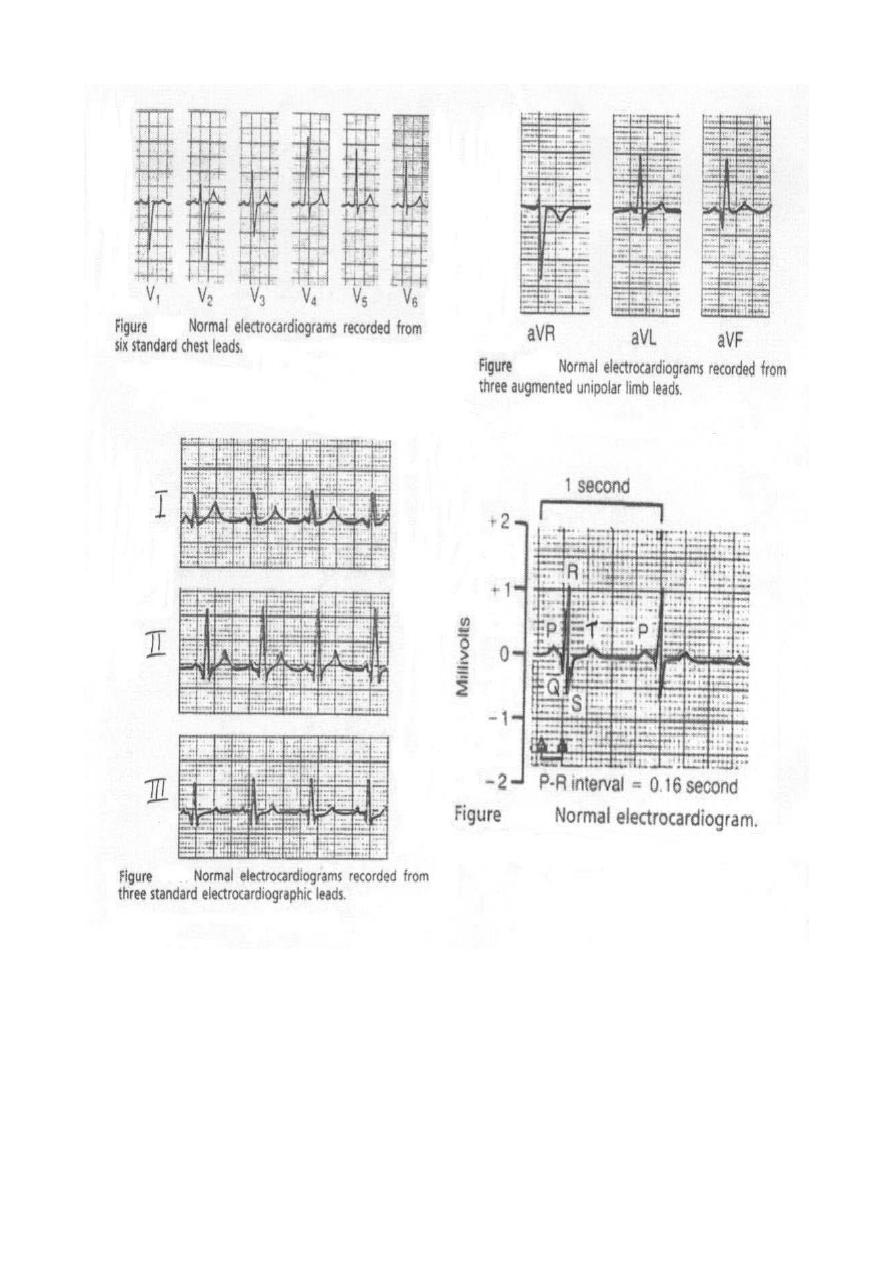
Relationship of the ECG to the cardiac cycle (Timing):
The ECG (electrocardiogram) shows the P, QRS and T waves. They are electrical
voltages generated by the heart and recorded by the ECG:
P-wave is caused by atrial depolarization; this is followed by atrial contraction,
which causes a slight rise in the atrial pressure curve after the P wave.
About 0.16 second after the onset of the P wave, the QRS waves appear as a
result of electrical depolarization of the ventricles, which initiates contraction
of the ventricles and causes the ventricular pressure to begin rising, as shown
in the figure. Therefore, the QRS complex begins slightly before the onset of
ventricular systole.
T-wave represents ventricular repolarization at which the ventricles begin to
relax. Therefore, the T wave occurs slightly before the end of ventricular
contraction.
Relationship of the Heart Sounds to Heart Pumping
When listening to the heart with a stethoscope, one does not hear the opening of the
valves because this is a relatively slow process that normally makes no noise.
However, when the valves close, the cusps of the valves and the surrounding blood
vibrate under the influence of sudden pressure changes, giving off sound that travels
in all directions through the chest. When the ventricles contract, one first hears a
sound caused by closure of the A-V valves. The vibration is low in pitch and
relatively long-lasting and is known as the first heart sound. When the aortic and
pulmonary valves close at the end of systole, one hears a rapid snap because these
valves close rapidly, and the surroundings vibrate for a short period. This sound is
called the second heart sound.
8
9
Lect. 5
Electrical potential of the heart
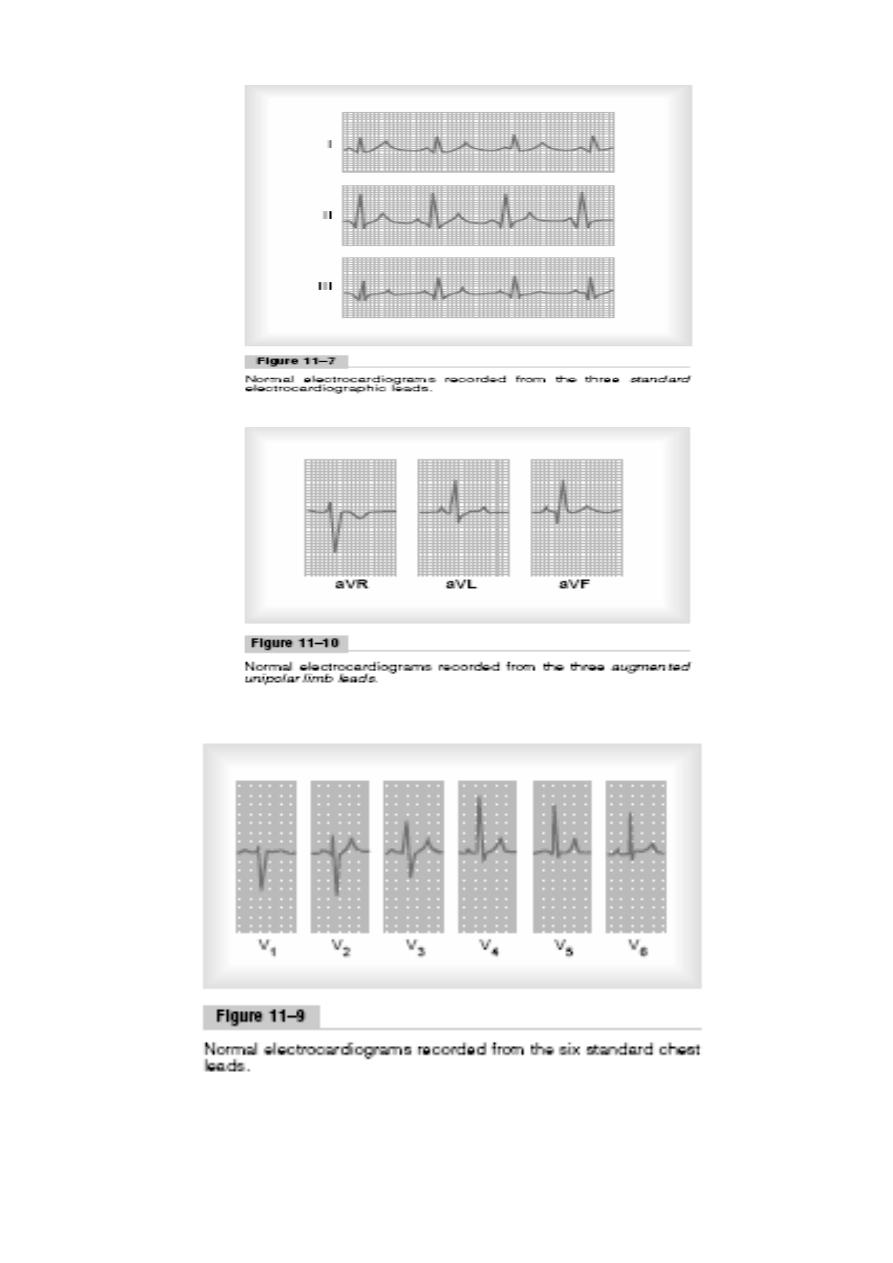
The electrocardiogram (ECG):
Objectives:
1. Draw an ECG classical waveform and label each component (P, QRS, T).
2. Draw diagrams indicating the 6 standarad limb leads (I,II,III,aVR,aVL,aVF).
The ECG is the recording of the electrical potential of the heart that extend to the
body surface. By placing the electrodes of an ECG instrument on the skin surface,
you can record the waves of depolarization and repolarization that are generated by
the cardiac muscle. The apparatus used is called the electrocardiograph; it is formed
basically of a sensitive galvanometer and an amplifier.
A standard ECG consists of 12 leads:
3 Bipolar standard limb leads (I, II, III).
3 unipolar limb leads (aVR, aVL, aVF).
6 unipolar chest leads.
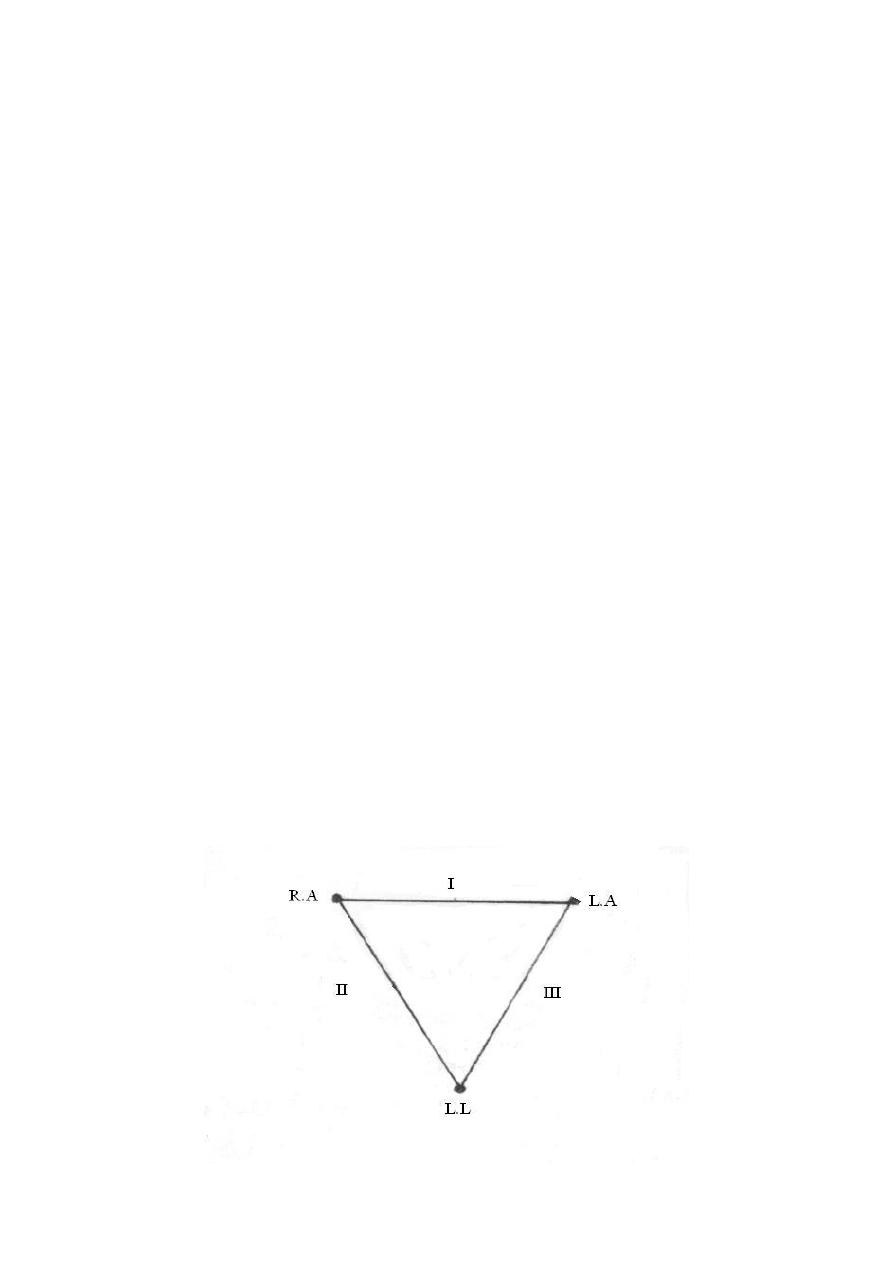
Bipolar standard limb leads (I, II, III):
These leads record the differences between the potentials in 2 limbs, by applying
electrodes usually at the wrist and ankle. The 3 standard bipolar limb leads
include:
Lead I: This records the difference between the potential in the left arm
(LA) and that in the right arm (RA).
Lead 11: This records the difference between the potential in the right arm
(RA) and that in the left leg (LL).
Lead III: This records the difference between the potential in the left
leg (LL) and that in the left arm (LA).
Einthoven's triangle: This is an equilateral triangle, the sides of which represent the 3
bipolar standard limb leads while the heart lies at its centre.
10
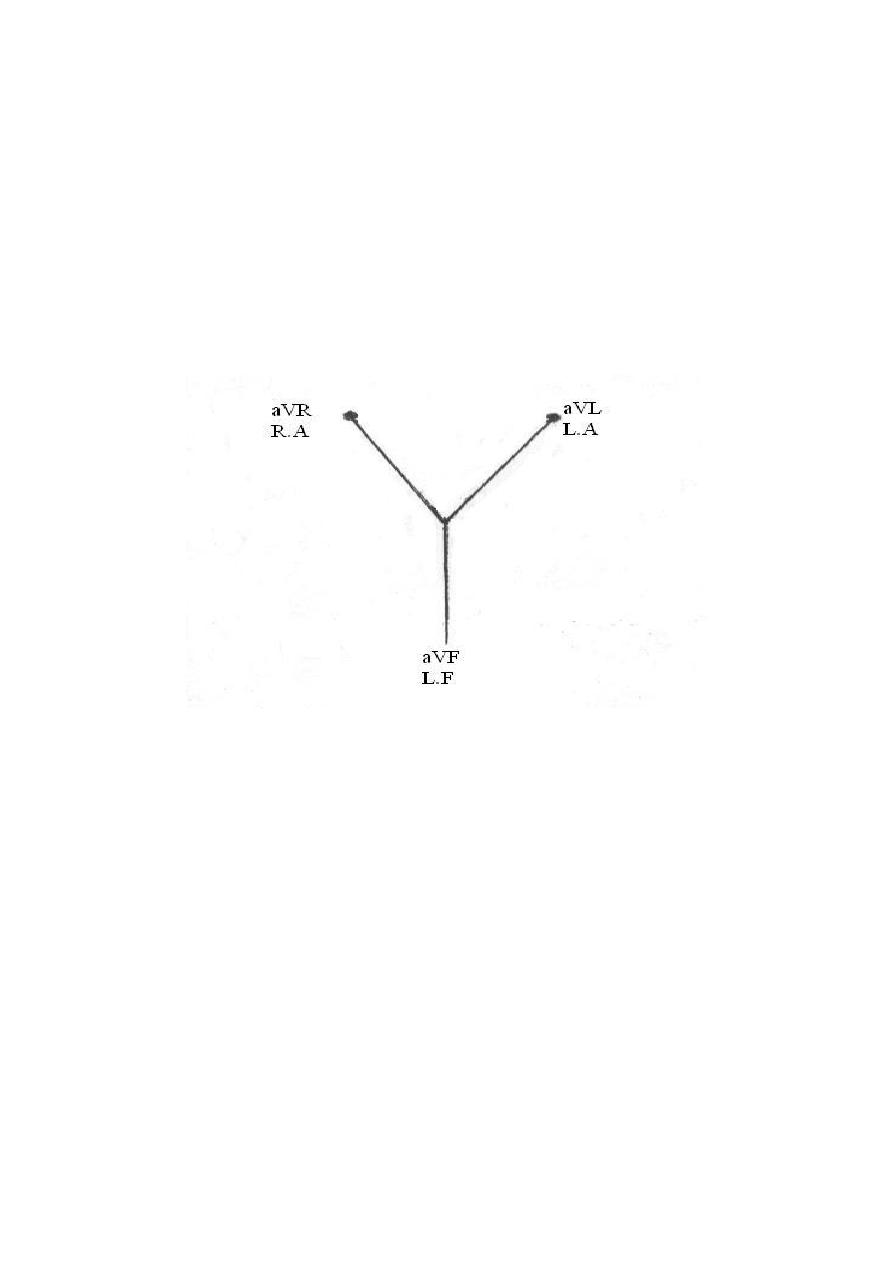
Unipolar limb leads (aVR, aVL, aVF):
These measure the absolute (actual) potential at a certain point. This is carried out by
applying one electrode from the electrocardiograph to the desired point (it is active,
+ve or exploring electrode) while the other electrode represents a common reference
point inside the instrument; it is the -ve electrode (0 potential) i.e. the unipolar leads
measure the potential differences between active electrodes and zero potential.
They are augmented unipolar limb leads that have magnified amplitudes by about 50
% without any change in their configuration, so they are called aVR, aVL and aVF (a
= augmented).
Unipolar chest leads:
Unipolar leads (precordial or chest leads) record the absolute potential at 6 standard
points on the anterior chest wall designated as V1 to V6, the locations of which are as
follows:
V1: At the right margin of the sternum in the 4th right intercostal space.
V2: At the left margin of the sternum in the 4th left intercostal space.
V3: Midway between V2 and V4.
V4: At the left midclavicular line in the 5th intercostal space.
V5: At the left anterior axillary line in the 5th intercostal space.
V6: At the left midaxillary line in the 5th intercostal space.
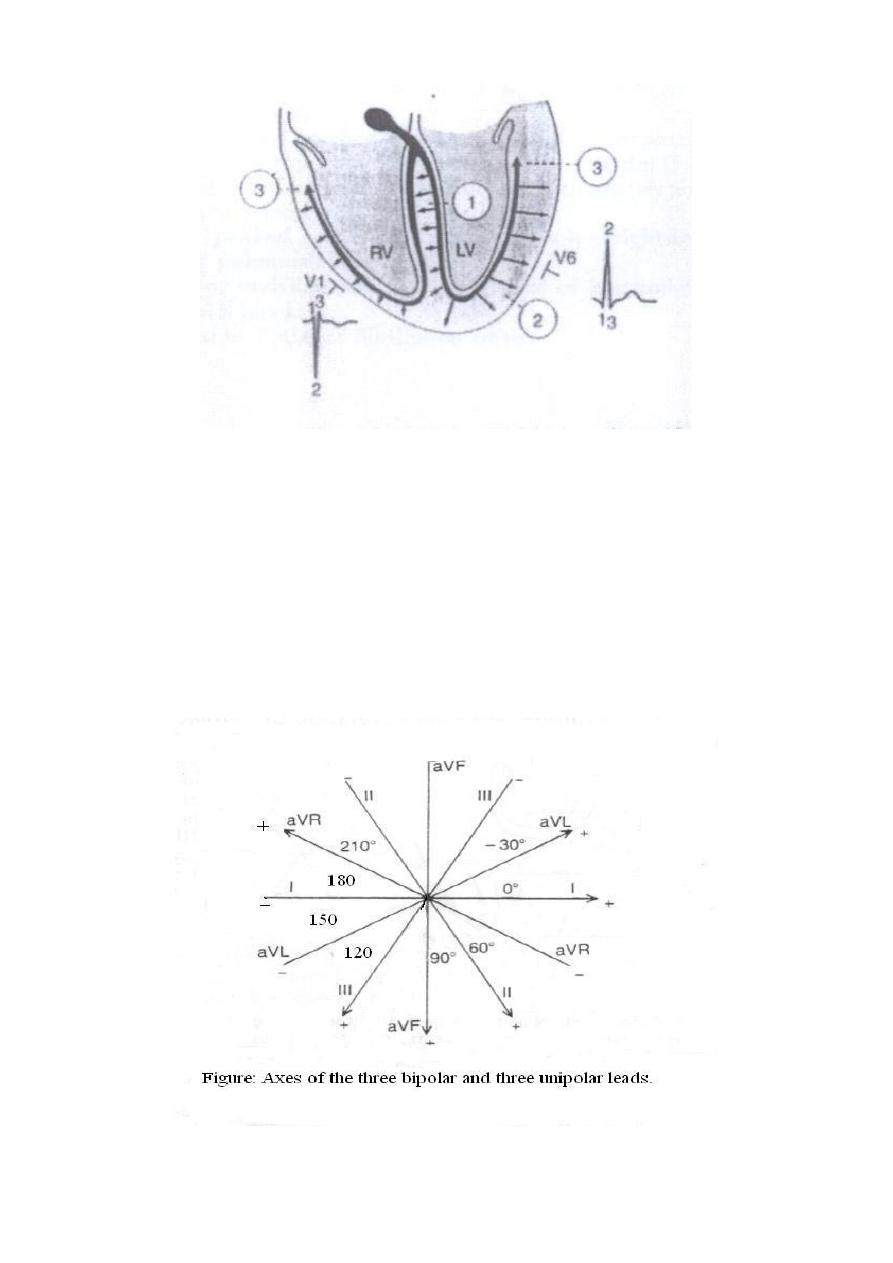
The precordial leads look at the heart in a horizontal plane from the front & left sides.
Leads V1 & V2 look at the right ventricle and reflect its activity, V3 & V4 look at the
interventricular septum and reflect its activity, while leads V5 & V6 look at the left
ventricle and reflect its activity.
Connections of the electrocardiograph:
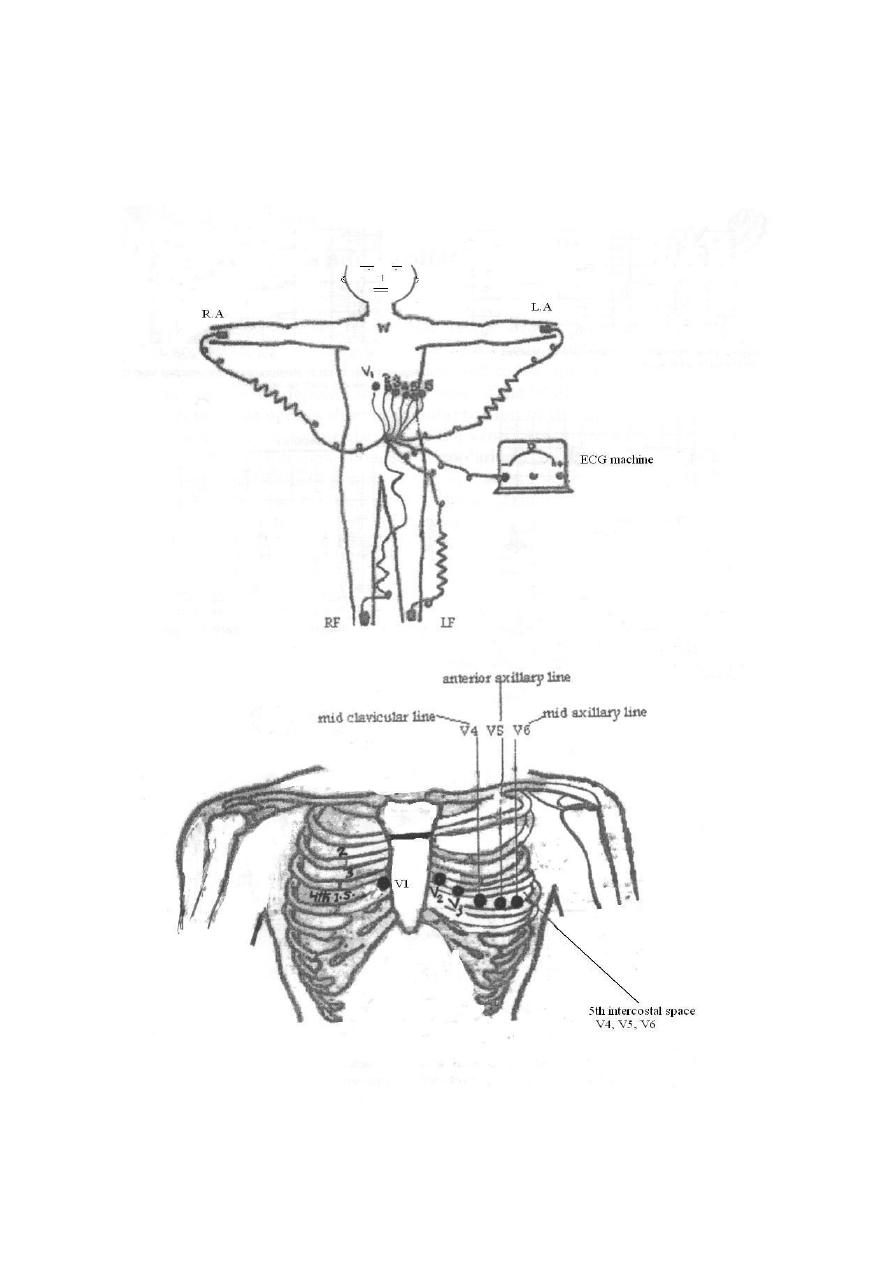
11
By specific electrodes, the electrocardiograph is connected to the 4 limbs and the
chest at the same time. The right leg connection is used to "earth" the subject (to
minimize interference currents). It is arranged so that an upward (+ ve) deflection is
produced when a depolarization wave is moving toward the exploring electrode or
a repolarization wave is moving away from it, and vice versa.

12
Calibration of the electrocardiograph:
The electrocardiograph is calibrated so that a change of 1 mV upward or downward
produces a deflection of 10 mm amplitude (10 small squares; 2 large squares), thus
each mm between the horizontal lines (voltage calibration lines) equals 0.1 mV. In
other words, the thin horizontal lines calibrated at 1 mm interval and the thick
horizontal lines at 5 mm intervals. The vertical lines are time calibration lines in
which duration of each mm (small square) equals 0.04 second, each inch (2.5cm) is 1
second, divided into 5 large squares, each large square (5 small squares) represents
0.20 second.
Calculation of heart rate from ECG paper:
If the heart rhythm is regular, the heart rate (HR) ran be counted by dividing the
number of large squares between two consecutive R waves into 300 or small squares
into 1500. If the rhythm is irregular, one can multiply the number of complexes in 6
seconds by 10.
Speed:
It is the speed at which the chart paper moves. The standard speed is 25 mm/sec. The
importance of another speed (50 mm/sec) is in case of tachycardia (e.g. HR of 180
beat/min), to obtain a proper ECG.
Sensitivity:
It means mm deflection for 1 mV (range; 5-10-20). The higher the sensitivity of the
instrument, the more the deflection and vise versa. The standard sensitivity is
10 mm/mV (2 large squares), in cardiomegally you must reduce the sensitivity.
ECG waves:
ECG (Electrocardiograph) is an indirect recording of electrical potential of the heart.
Normal ECG consists of the following waves:
P wave caused by the depolarization process of the atria; i.e., correspond to
atrial depolarization just before contraction (i.e., not atrial contraction).
QRS complex of waves caused by the depolarization process of the ventricles;
again before ventricular contraction (i.e., not ventricular contraction).
T wave caused by the repolarization of the ventricles; the ventricles recover
from the state of depolarization.
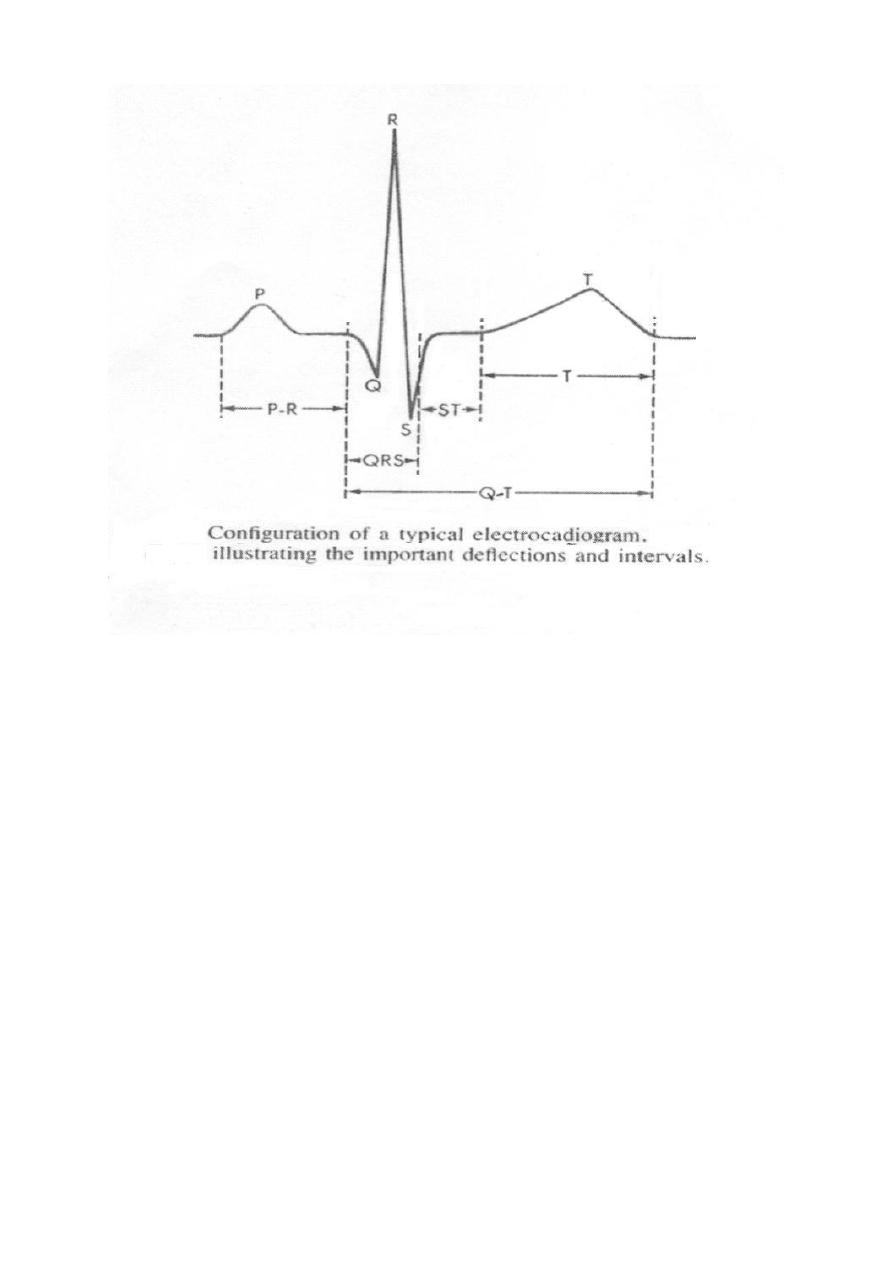
13
Duration and intervals:
P wave, duration; 0.07-0.14 seconds and not higher than 3 mm.
PR interval, This is measured from the beginning of the P wave to the
beginning of the QRS complex; to the onset of the Q wave if there is one and
to the onset of the R wave if there is no Q wave. This interval corresponds to
the time taken for the impulse to travel from the sinus node to the ventricular
muscle. It ranges normally between 0.12- 0.21 seconds. Abnormal PR interval
is either long as in first degree heart block or short as in WPW syndrome.
QRS complex, duration; 0.06 – 0.10 seconds. Abnormal wide QRS indicate
bundle branch block.
T wave, duration; 0.25 -0.35 seconds and not taller than 10 mm in chest leads.
QT interval, it represents the total time from the onset of ventricular
depolarization to the completion of repolarization. It indicates the duration of
ventricular systole i.e. contraction of the ventricle lasts from the beginning of
the Q wave to the end of the T wave. Normally it is about 0.35 seconds; range
0.28 – 0.44 seconds.
14
15
16
Lect.6
Electrical axis and cardiac vector
Objectives:
1. State the relationship between the direction of cardiac vector with the direction
(-ve, +ve) and amplitude of an ECG waves.
2. Draw diagram indicting the axes of limb leads.
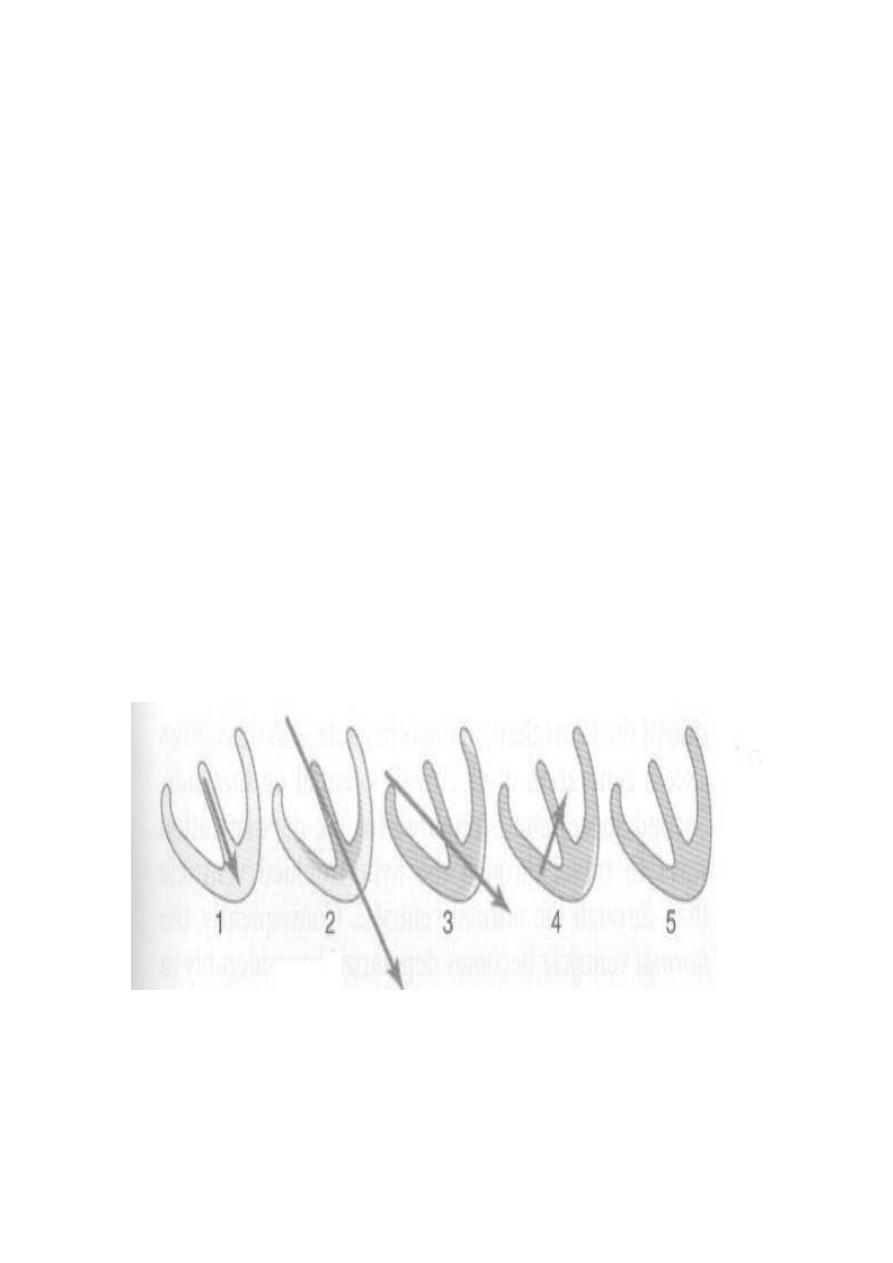
Cardiac vector:
The cardiac vector is the net result of the directions of the spread of depolarization
waves from the SA node through the atria, AV node, interventricular septum,
ventricles, and to the apex of the heart, the last part of the heart to be depolarized is
the base of the heart.
Vector that occurs during depolarization of the ventricles
When the cardiac impulse enters the ventricles through the AV bundle, the first part
of the ventricles to become depolarized is the left endocardial surface of the septum,
then this depolarization spreads rapidly to involve both endocardial surfaces of the
septum, the endocardial surface of the two ventricles and finally it spreads through
the ventricular muscle to the outside of the heart and thereafter, the heart vector
points toward the base of the left ventricle.
Figure: Vectors that occur during depolarization of the ventricles.
17
Figure: Gensis of the QRS complex. The first phase, directed from left to right
across the septum, produce Q wave in V6 and an R wave in V1. The second phase,
due to depolarization of the left ventricle from endocardium to epicardium, results in
a tall R wave in V6 and a deep S wave in V1. Phase 3, depolarization of the basal
parts of ventricles producing a terminal S wave in V6 and a terminal R wave in V1.
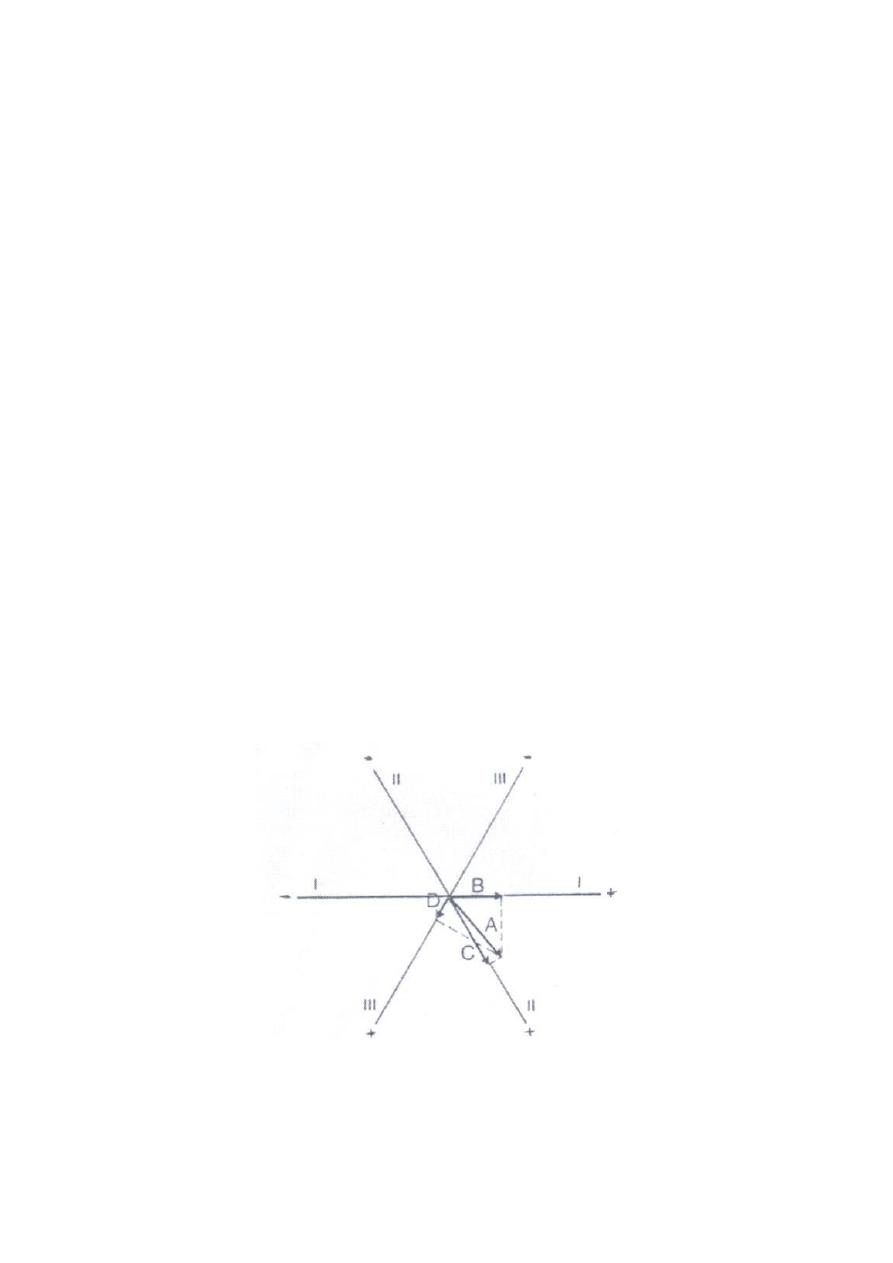
Electrical axis of the ventricular QRS:
In relation to the bipolar limb leads (I, II, III), the cardiac vector or axis can be
calculated. The relationship among the six limbs leads, i.e., the axis of each standard
bipolar and unipolar limb leads can be presented in the following diagram:
18
The mean electrical axis of the ventricular QRS
The average direction of the depolarization waves in all ventricular muscle fibres is
called the mean electric axis of the ventricles or mean ORS axis or vector.
Depolarization in cardiac muscle fibres can be represented by an arrow pointing to
the + ve direction. This arrow is called a vector.
In normal heart, the direction of the cardiac vectors of the ventricles is normally
toward the apex of the heart. In other words, the direction of the electrical potential is
from the base of the ventricles toward the apex..
The mean ORS axis has a magnitude & direction, and is related to the anatomical
axis of the heart. The normal electric axis is directed downwards and to the left
between - 30 and +110 (average + 60). Clinically, the electrical axis of the heart is
determined from the standard bipolar limb leads; lead I and lead III as follows:
First, record the maximum potential (that of QRS wave; R wave) and polarity
(+ve or –ve), to determine the maximum potential, you might need to subtract
the area of the negative wave from the area of the positive wave. This means
that the net QRS deflection in each lead is calculated by subtracting the
amplitude of the largest -ve wave in the QRS from that of the R wave.
Second, a distance equal to the net deflection in each lead is drawn as an
arrow on the corresponding axis of the bipolar limb lead (clock), starting from
its zero potential point and pointing to the resulting polarities (+ve or -ve).
Third, draws perpendicular lines form both ends of the arrows; th apices of the
two net potentials of lead I and III, the point of intersection of these two lines
represents the mean electrical axis or the mean QRS vector of the ventricles.
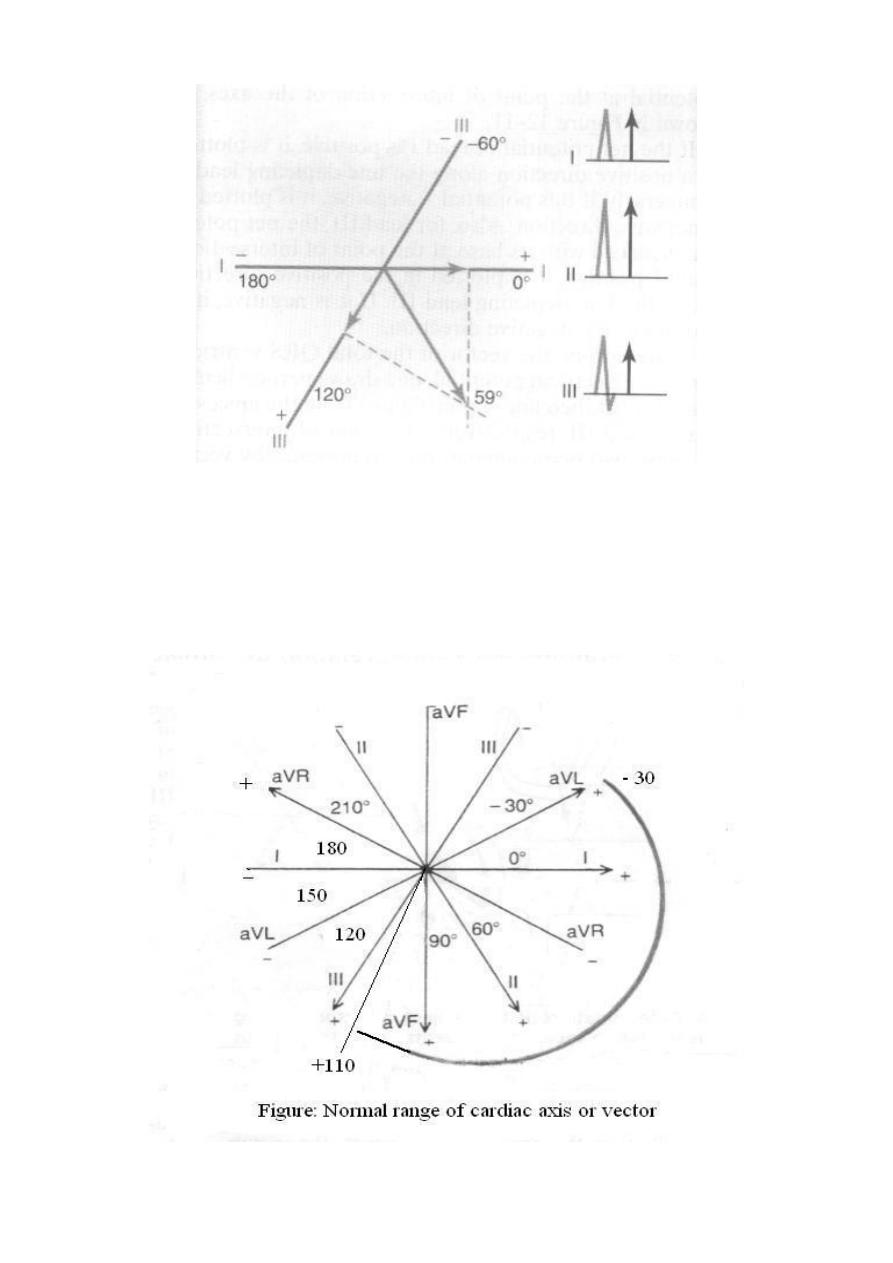
In a normal heart, the average direction of the vector of the heart during spread of the
depolarization waves through the ventricles; the mean QRS vector, is about +59
degrees, as shown in the following figures:
Figure: Determination of projected vectors in leads I, II, and III where vector A
represent the instantaneous potential in the ventricles.
19
Figure: The mean electrical axis of the heart (59 degree) plotted
From lead I and lead III.
The cardiac vector affects the configuration of the ECG waves in the various leads.
The normal direction of the mean QRS vector is downwards and to the left and is
generally between –30 and +110 degrees.
20
Axis deviation:
Axis deviation occurs if the electric axis of the heart is beyond the normal range and
it may be to the right or to the left. QRS axis further right that of +110 constitutes
Right axis deviation (RAD), QRS axis left that of –30 constitutes Left axis
deviation (LAD).
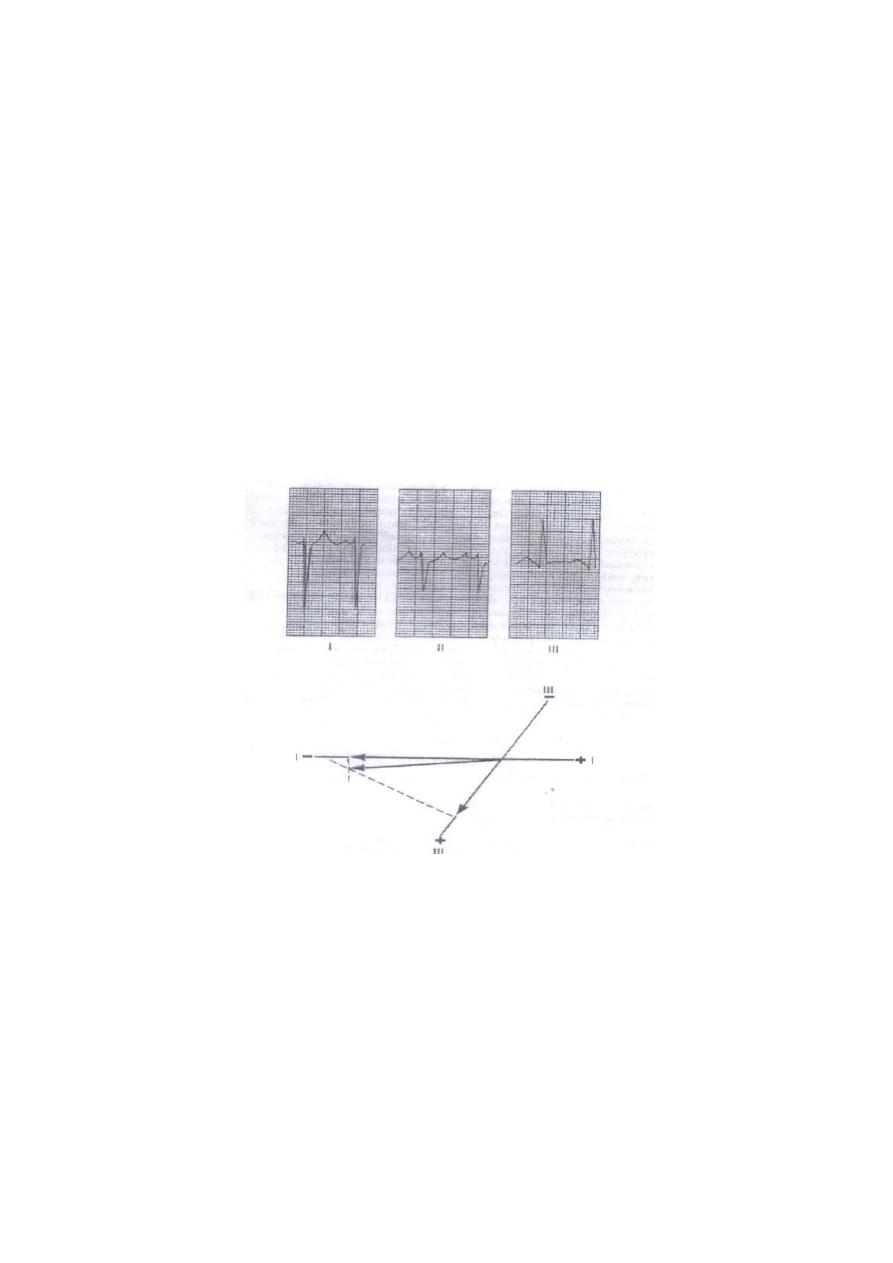
Right axis deviation
This normally occurs in vertical hearts (e.g. in tall slender subjects), but
pathologically, it is common in right ventricular hypertrophy and right bundle branch
block. In this case, the projection of the mean QRS axis is toward the -ve pole in lead
I and toward the +ve pole in lead III, so in ECG, there are deep -ve waves (S waves)
in lead I and high +ve waves (R waves) in lead III, as shown in the following figure.
Figure: Right axis deviation and a slightly prolonged QRS complex.
21
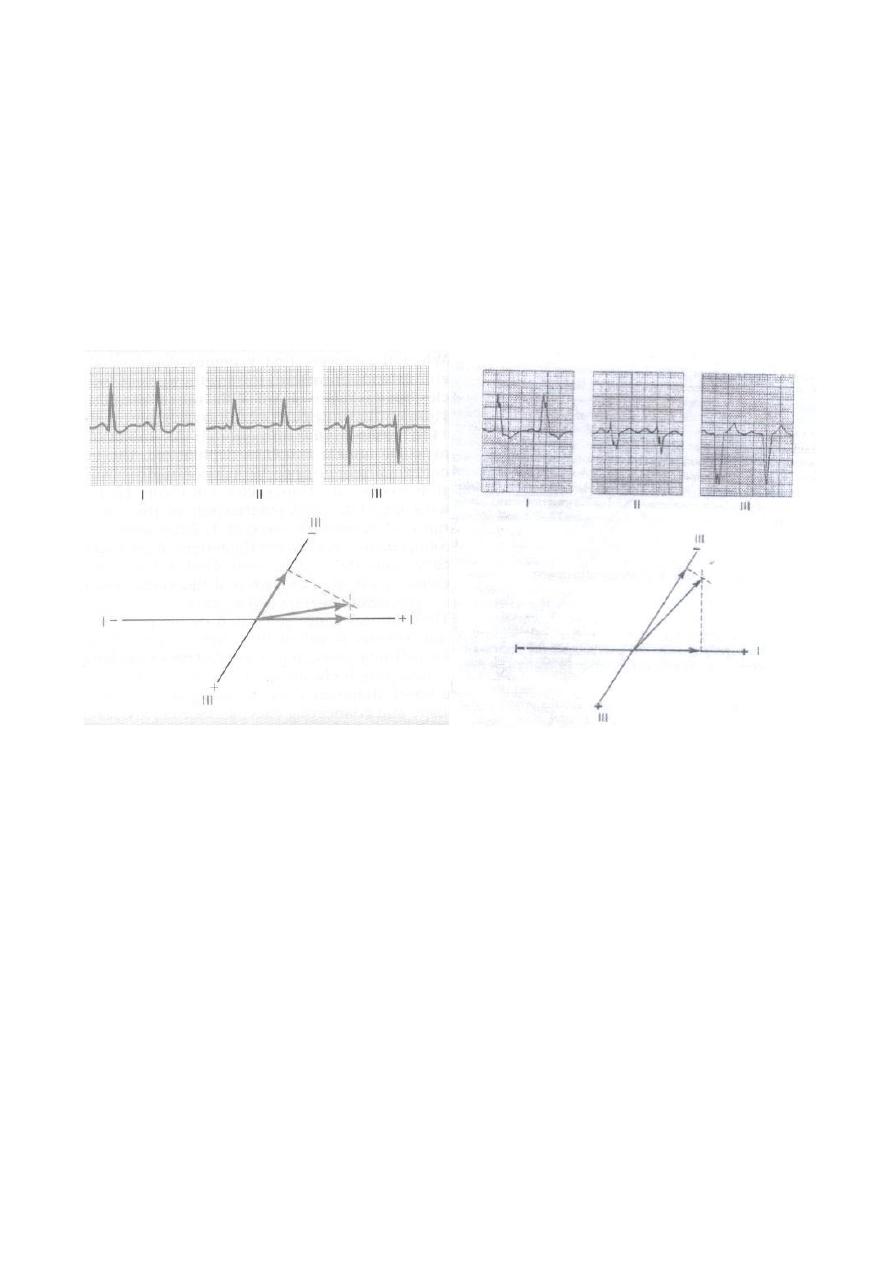
Left axis deviation
This normally occurs in horizontal hearts (e.g. in short obese subjects and pregnant
women) but pathologically, it is common in left ventricular hypertrophy and left
bundle branch block. In this case, the projection of the mean QRS axis is toward the
+ve pole in lead I and toward the -ve pole in lead III, so in ECG there are high +ve
waves (R waves) in lead I and deep -ve waves (S waves) in lead III.
Figure: Example of left axis deviation.
Figure: left axis deviation caused by
left bundle branch block. Note also the
greatly prolonged QRS complex.
22
Lect. 7
Cardiac arrhythmia
Objectives:
1. List the types of arrhythmias.
2. Identify on ECG: ectopic beats, atrial & ventricular fibrillation, heart block.
The causes of the cardiac arrhythmias are usually one or a combination of the
following abnormalities in the rhythmicity-conduction system of the heart:
1- Abnormal rhythmicity of the pacemaker.
2- Shift of the pacemaker from the sinus node to other parts of the heart.
3- Blocks at different points in the transmission of the impulse through the heart.
4- Abnormal pathways of impulse transmission through the heart.
5- Spontaneous generation of abnormal impulses in almost any part of the heart.
Types of arrhythmias
1- Abnormal sinus rhythms.
2- Conduction block.
3- Premature Contractions.
4- Paroxysmal tachycardia.
1-Abnormal sinus rhythms:
Sinus Tachycardia.
Sinus Bradycardia.
Sinus Arrhythmia.
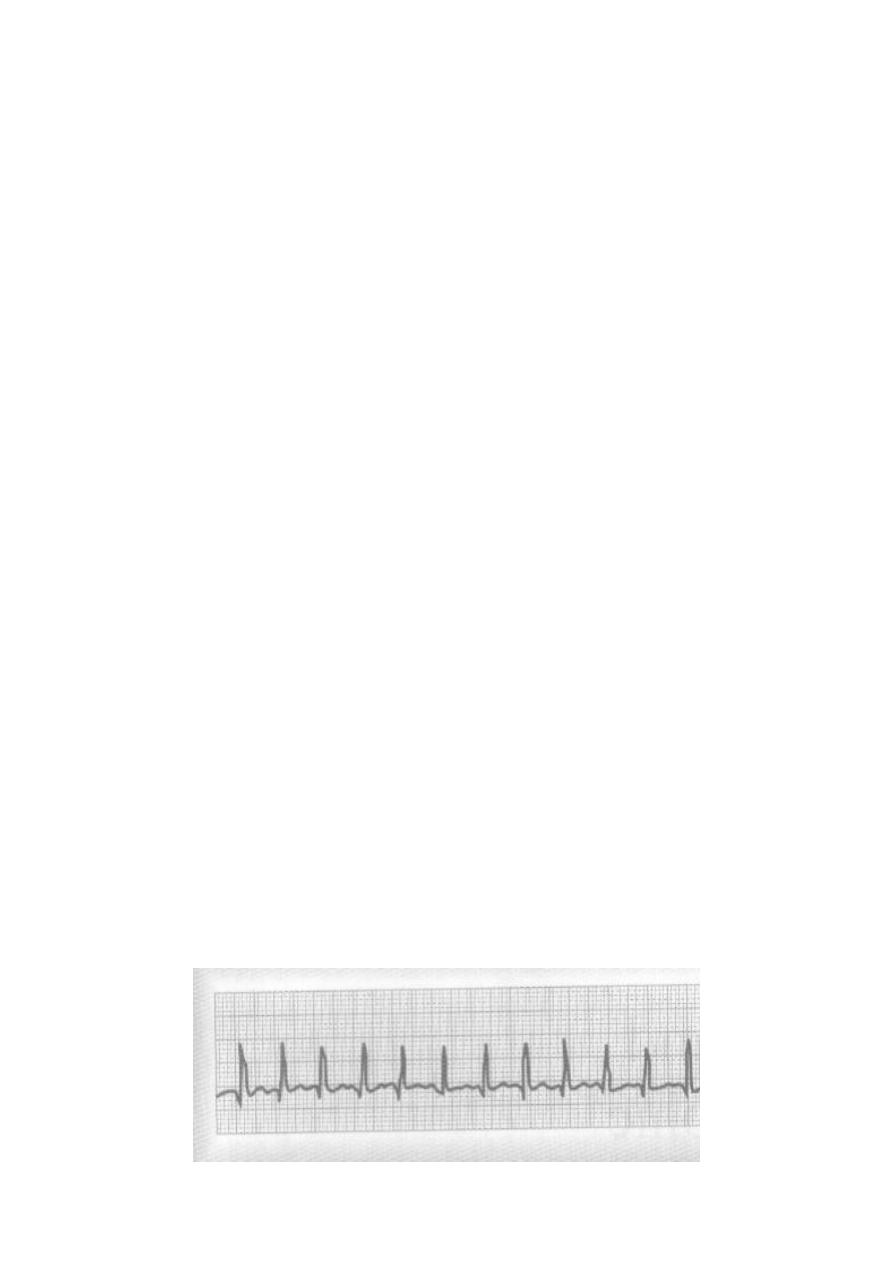
Tachycardia
The term "tachycardia" means fast heart rate, usually defined as faster than 100 beats
per minute. The electrocardiogram is normal except that the rate of heartbeat is
increased. The general causes of tachycardia are:
increased body temperature,
Stimulation of the heart by the sympathetic nerves.
23
Sinus tachycardia, HR = 150 (300/2)
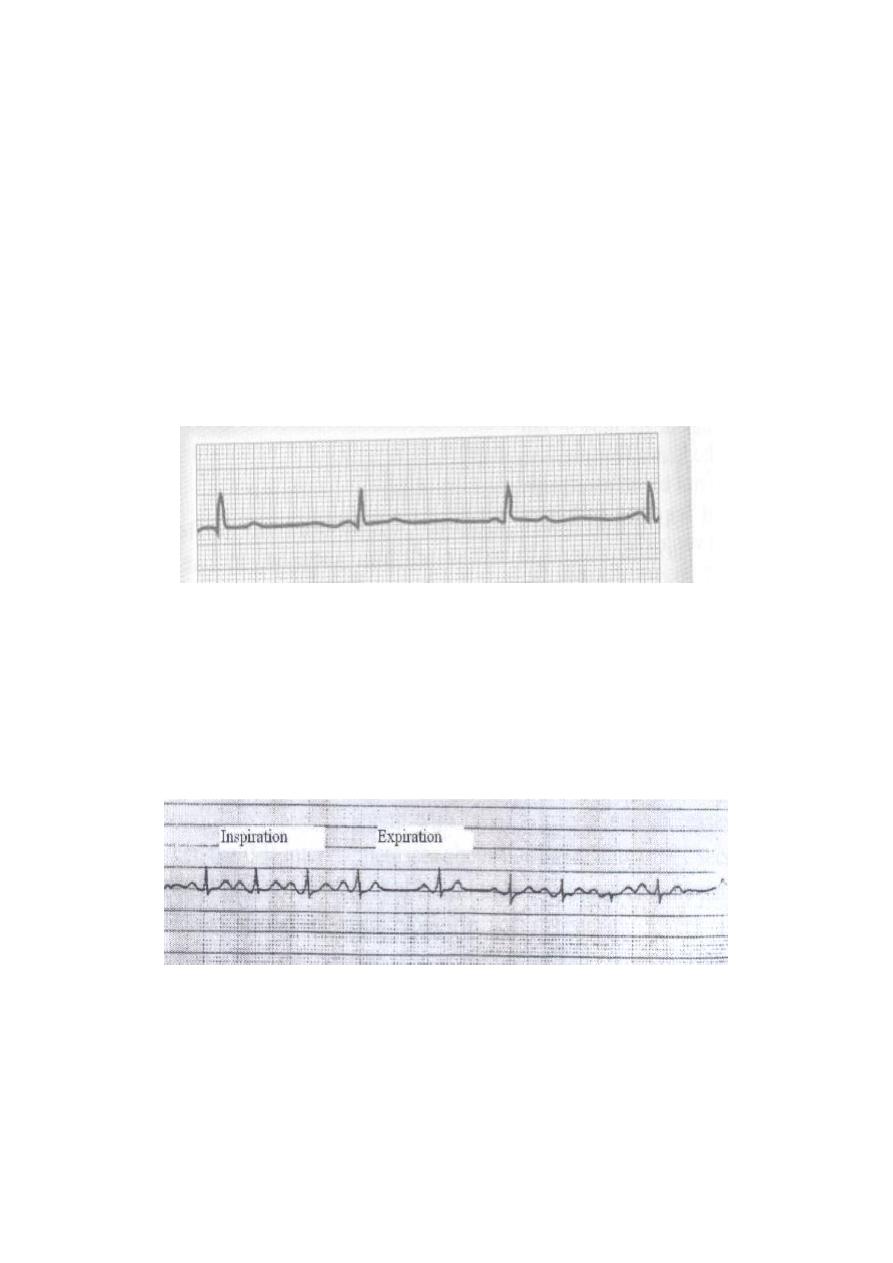
Bradycardia
The term "bradycardia" means a slow heart rate, usually defined as less than 60 beats
per minute. Examples:
Bradycardia in Athletes.
Vagal Stimulation. In patients with carotid sinus syndrome; arteriosclerosis of
the carotid sinus causes excessive sensitivity of the baroreceptors located in the
arterial wall; as a result, mild pressure on the neck elicits a strong baroreceptor
reflex, causing intense vagal stimulation of the heart and extreme bradycardia.
Sometimes this reflex is so powerful that it stops the heart.
Sinus bradycardia of 40 beats per minute.
(300/7.5 = 40)
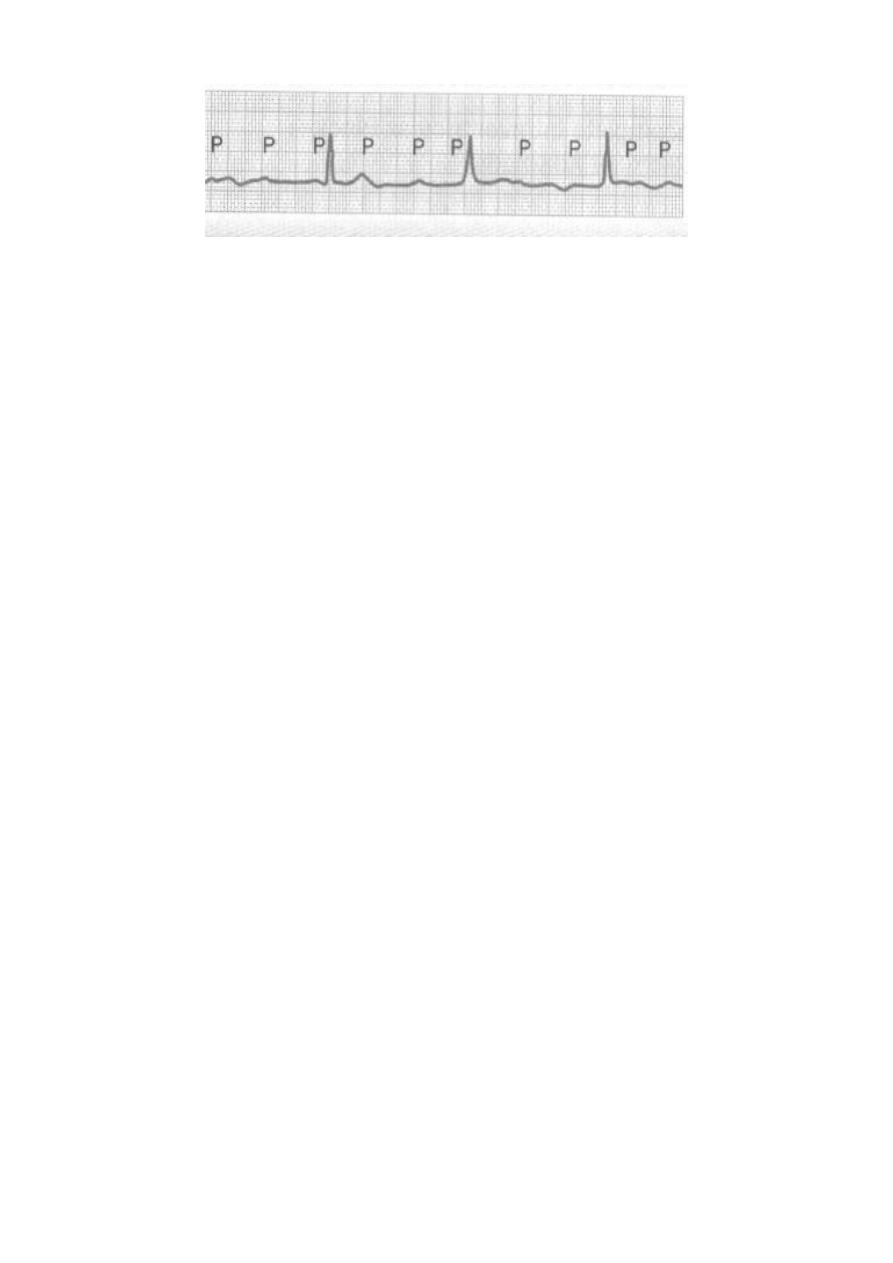
Sinus Arrhythmia
The heart rate is increased during inspiration and decreased during expiration. The
ECG is normal except that the number of the cycles varies with the two phases of
respiration. It is a common normal finding in young adults and children.
Sinus arrhythmia, acceleration of sinus rate during inspiration
and slowing during expiration.
2-Conduction block:
Sinoatrial Block.
Atrioventricular Block (Heart Block).
1. First Degree Heart Block.
2. Second Degree Heart Block.
24
3. Third Degree Heart Block.
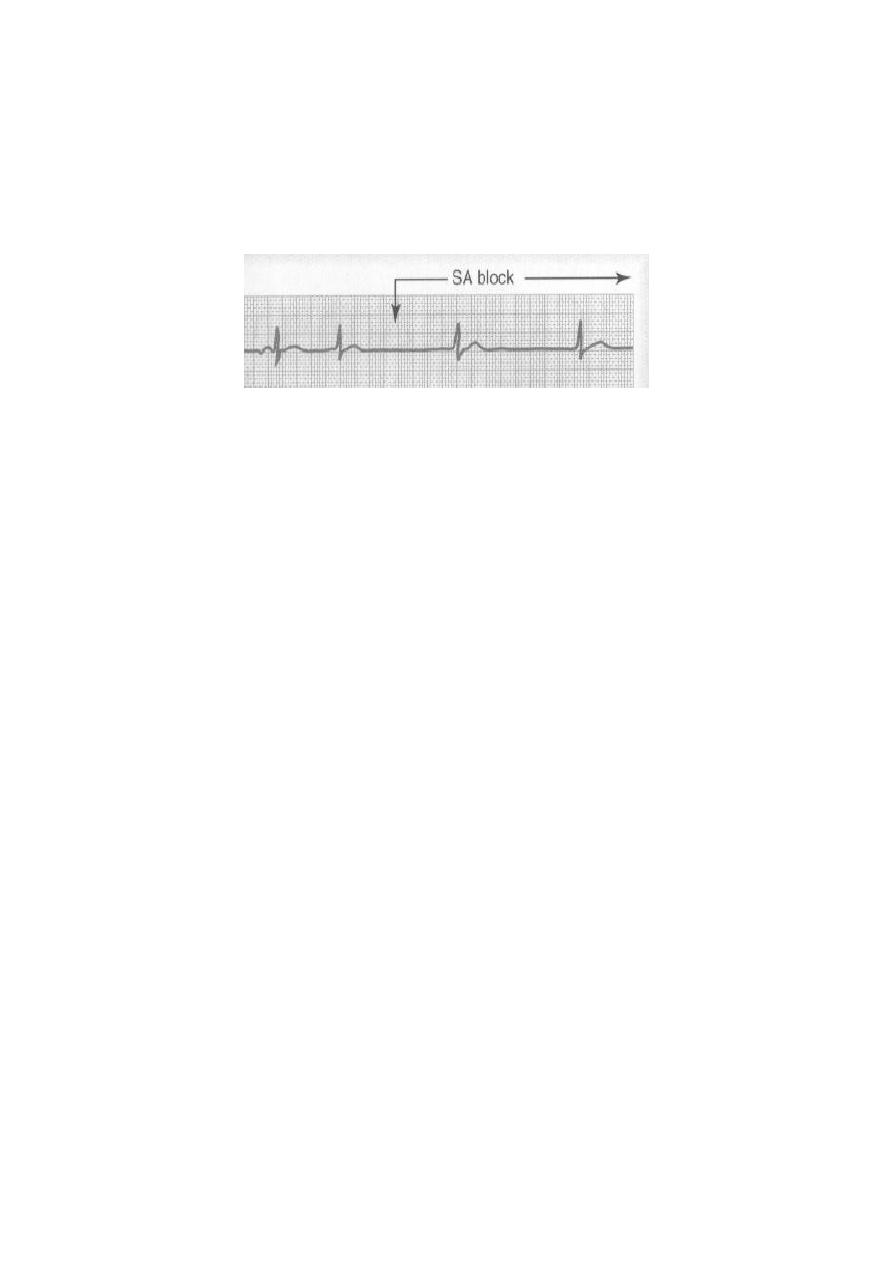
Sinoatrial Block
The impulse from the sinus node is blocked before it enters the atrial muscle.
There is sudden cessation of P- wave with standstill of the atrium (missed beat).
Sinoatrial nodal block (missed beat).
Atrioventricular Block (Heart Block)
Impulses pass from the atria into the ventricles is through the A-V bundle (the bundle
of His). Conditions that can either decrease or block the impulse through this bundle
are:
Ischemia of the A-V node or A-V bundle fibers by coronary insufficiency.
Compression of the A-V bundle by scar tissue or by calcification.
Inflammation of the A-V node or A-V bundle, which can results frequently
from different types of myocarditis, such as occur in diphtheria and rheumatic
fever.
Extreme stimulation of the heart by the vagus nerves blocks impulse
conduction through the A-V node. Such vagal excitation occasionally results
from strong stimulation of the baroreceptors in people with the carotid sinus
syndrome.
First Degree Heart Block (Prolonged P-R interval)
The normal time between the beginning of the P wave and the beginning of the QRS
complex is 0.12 – 0.21 second, when the heart is beating at a normal rate. This P-R
interval usually decreases in length with faster heartbeat and increases with slower
heartbeat. When the P-R interval increases above a value of about 0.21 second in a
heart beating at normal rate, the P-R interval is said to be prolonged and the patient is
said to have first degree incomplete heart block (in acute rheumatic fever). The
following Figure shows an electrocardiogram with a prolonged P-R interval. Thus,
first degree heart block is defined as a delay of conduction from the atria to the
ventricles but not actual blockage of conduction.
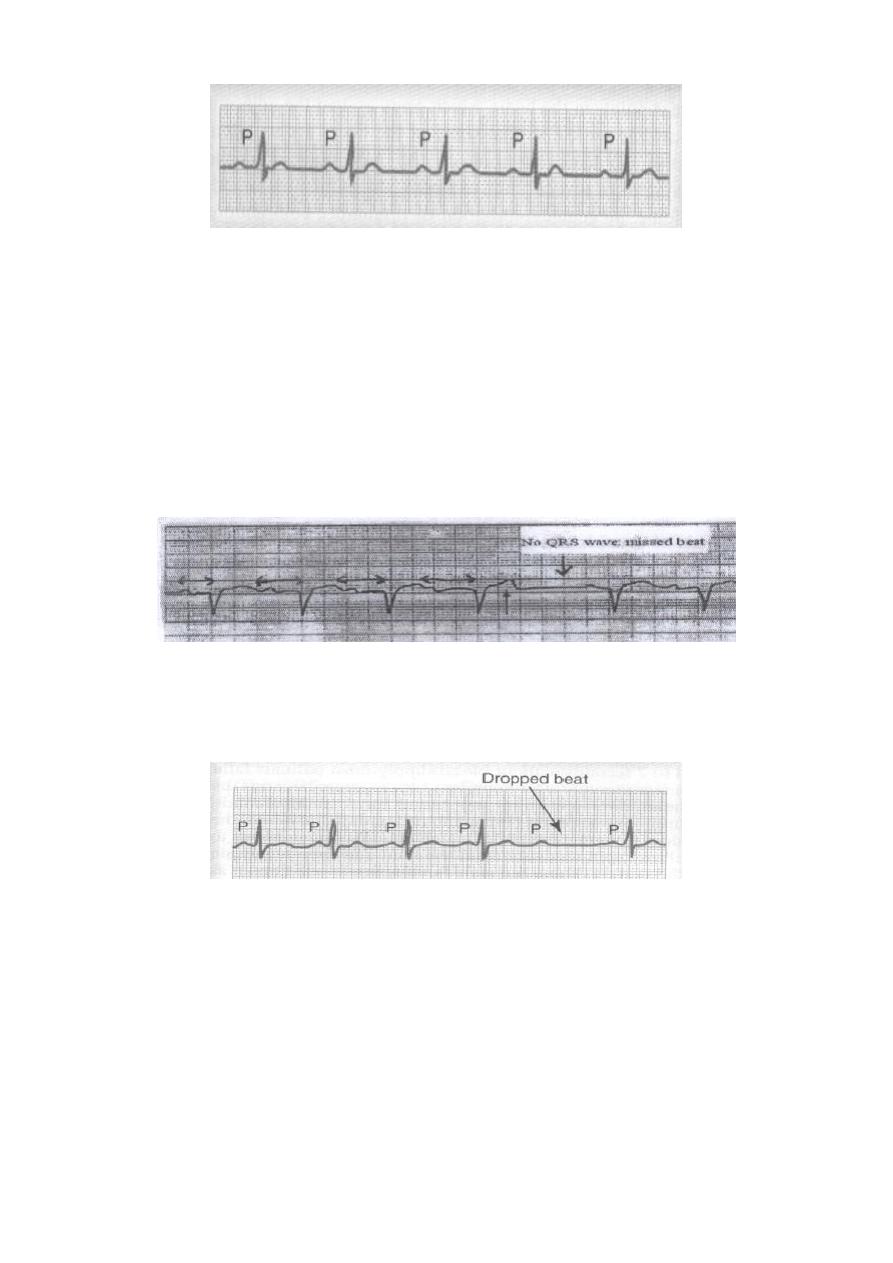
25
First-degree heart block, prolonged P-R interval.
Second Degree Heart Block
The atria beat at a faster rate than the ventricles, and there are dropped beats of the
ventricles. This condition is called second degree incomplete heart block, as shown in
the following figures; a progressive prolongation of the P-R intervals as well as one
dropped beat as a result of failure of conduction from the atria to the ventricles.
At times, every other beat of the ventricles is dropped, so that a "2:1 rhythm"
develops in the heart, with the atria beating twice for every single beat of the
ventricles. Sometimes other rhythms such as 3:2 or 3:1 also develop.
Second-degree heart block, progressive PR prolongation failure of
P-wave conduction to the ventricle (missed ventricular beat).
Second-degree heart block, with missed ventricular beat.
Third Degree Heart Block (Complete heart block)
Complete block of the impulse from the atria into the ventricles. The P waves become
dissociated from the QRS-T complexes. As shown, the rate of ventricular beat is less
than 40 per minute. Furthermore, there is no relation between the rhythm of the P
waves and that of the QRS-T complexes because the ventricles have escaped from
control by the atria, and they are beating at their own natural rate.
26
Complete heart block. P-waves are dissociated
from the QRS complexes.
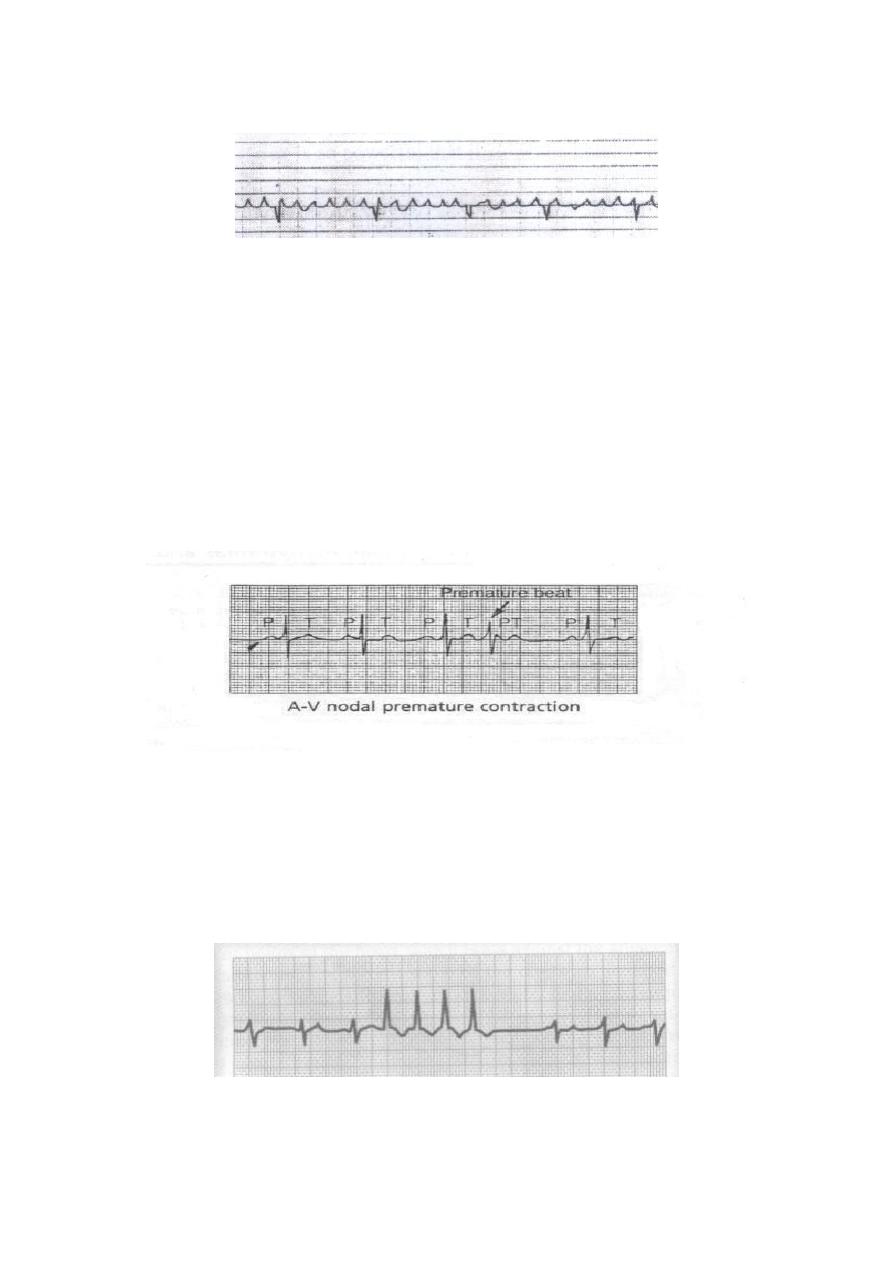
3-Premature Contractions:
A premature contraction is a contraction of the heart before the time that normal
contraction would have been expected. This condition is also called extrasystole,
premature beat, or ectopic beat. Most premature contractions result from ectopic foci
in the heart, which emit abnormal impulses at odd times. The possible causes:
Local areas of ischemia.
Small calcified plaques at different points in the heart, which press against the
adjacent cardiac muscle so that some of the fibers are irritated.
Toxic irritation of the A-V node, Purkinje system, or myocardium caused by
drugs, nicotine, or caffeine. Mechanical initiation of premature contractions is
also frequent during cardiac catheterization.
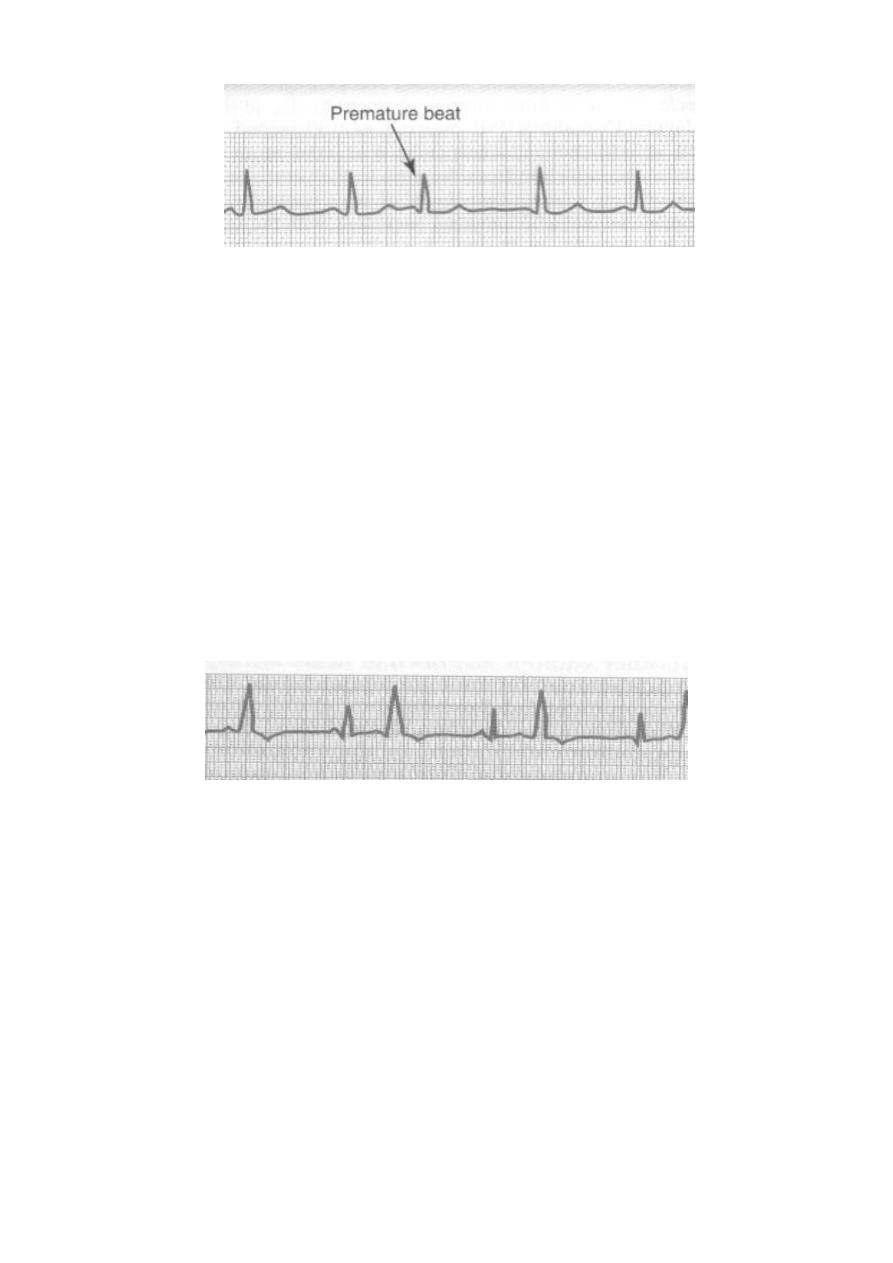
Premature Atrial Contractions
The following figure shows a single premature atrial contraction, The P-wave of this
beat occurs too soon in the heart cycle, and the P-R interval is shortened, indicating
that the ectopic origin of the beat is near the A-V node. Also, the interval between the
premature contraction and the next succeeding contraction is slightly prolonged,
which is called a compensatory pause. One of the reasons for this is that the
premature contraction originated in the atrium some distance from the sinus node,
and the impulse had to travel through a considerable amount of atrial muscle before it
discharged the sinus node. Consequently, the sinus node discharged late in the
premature cycle, and this made the succeeding sinus node to be discharged late.
Premature atrial contractions occur:
In healthy people.
In athletes.
Mild toxic conditions resulting from; excess smoking, lack of sleep, ingestion
of too much coffee, alcoholism, and the use of various drugs.
27
Atrial premature beat.
Premature Ventricular Contractions
The electrocardiogram of the following figure shows a series of premature ventricular
contractions (PVCs) alternating with normal contractions. PVCs cause specific
effects in the electrocardiogram, as follows:
The QRS complex is usually prolonged.
The QRS complex has a high voltage.
The T wave has a potential polarity opposite to that of the QRS complex.
Some PVCs result from factors such as cigarettes, coffee, lack of sleep, and
emotional irritability. Other PVCs originate from infracted or ischemic areas of the
heart.
Ventricular ectopic beats, broad QRS complex.
4-Paroxysmal tachycardia:
Abnormalities in any portion of the heart, including the atria, the Purkinje system, or
the ventricles, can cause rapid rhythmical discharge of impulses that spread in all
directions throughout the heart. The term "paroxysmal" means that the heart rate
usually becomes rapid in paroxysms, with the paroxysms beginning suddenly and
lasting for a few seconds, a few minutes, a few hours, or much longer. Then the
paroxysms usually end suddenly as they begun, with the pacemaker of the heart
shifting back to the sinus node.
Paroxysmal tachycardia:
Supraventricular arrhythmias:
1. Atrial tachycardia;
a- Supraventricular tachycardia (SVT).
b- Atrial fibrillation (AF).
c- Atrial flutter.
28
2. Junctional tachycardias (AV nodal paroxysmal tachycardia).
Ventricular paroxysmal tachycardia.
a- Ventricular tachycardia (VT).
b- Ventricular fibrillation (VF).
Supraventricular arrhythmias:
Atrial tachycardias (arising from atrial myocardium) or junctional tachycardias (AV
node tachycardia), both of which are called Supraventricular tachycardias, usually
occurs in young, otherwise healthy people.
They are originated above the bifurcation of bundle of His. The unique characteristics
of these arrhythmias are:
1- Narrow QRS.
2- P-wave either visible, irregular in shape and with shorter duration or invisible.
3- Variable PR interval due to variable rate of conduction at AV node.
Atrial tachycardias:
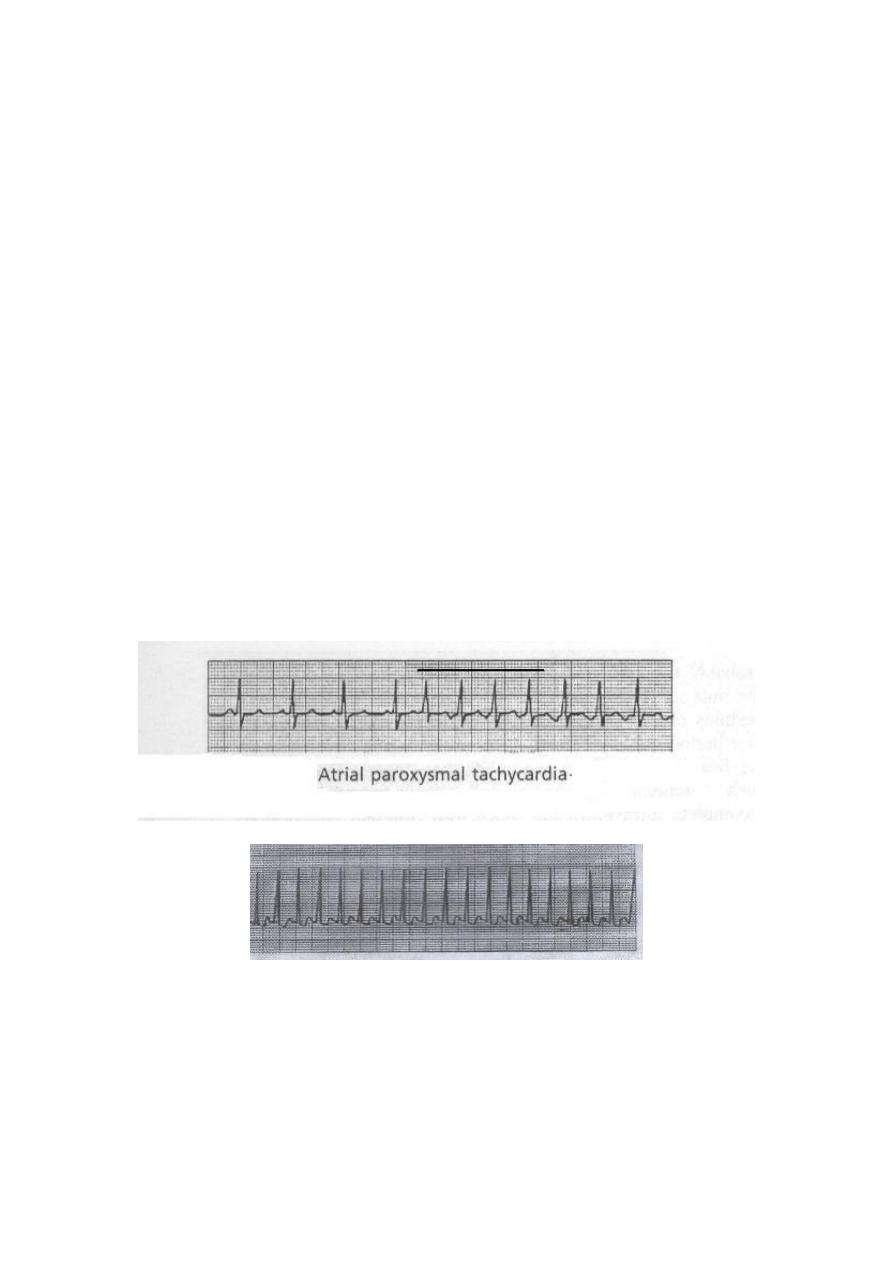
a- paroxysmal Supraventricular tachycardia (SVT)
As shown in the following record, there is a sudden increase in the rate of heartbeat
from about 95 to about 150 beats per minute. It can be seen that an inverted P-wave
occurs before each of the QRS-T complexes during the paroxysm of rapid heartbeat,
and this P-wave is partially superimposed on the normal T wave of the preceding
beat. This indicates that the origin of this paroxysmal tachycardia is in the atrium, but
because the P-wave is abnormal, the origin is not near the sinus node.
Supraventricular tachycardia, no P wave (missed) or obscured.
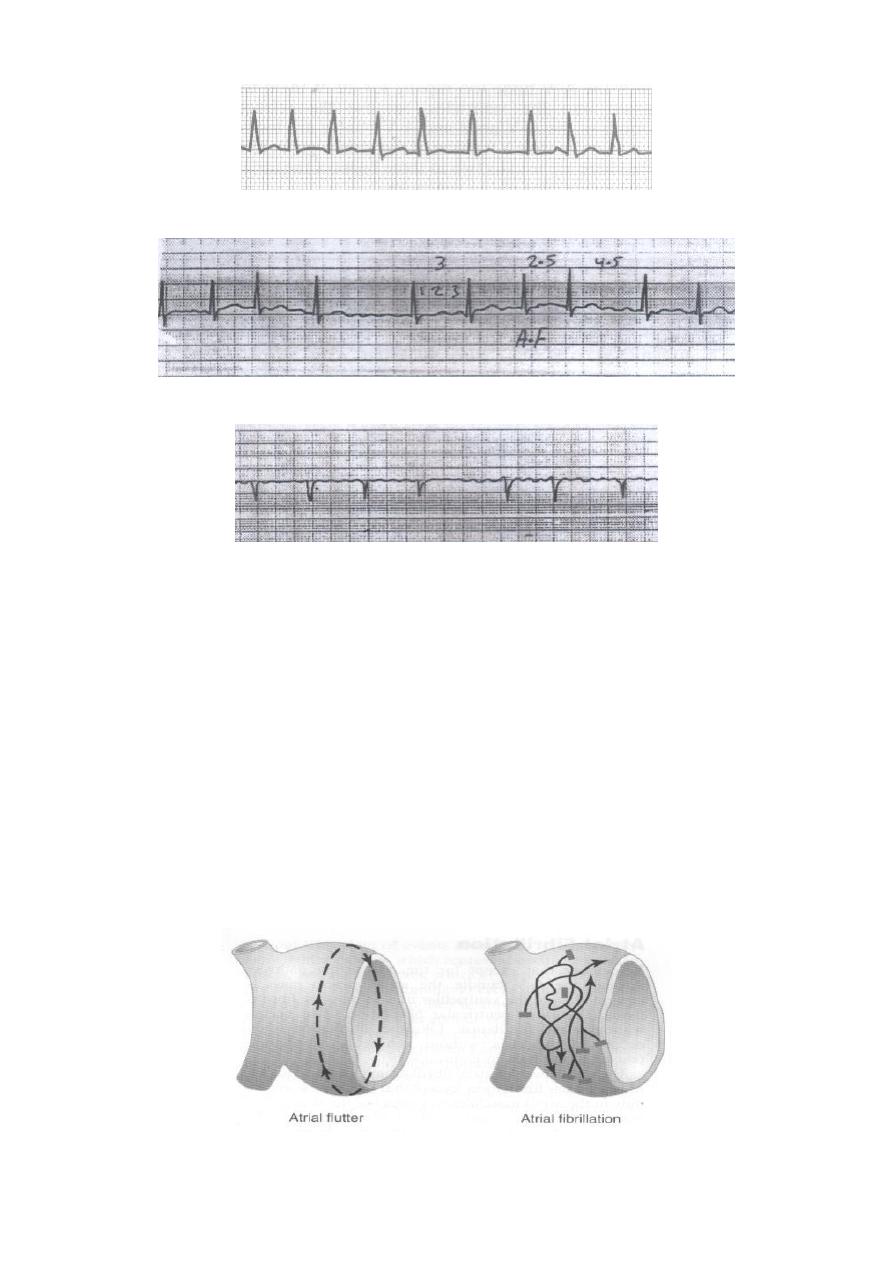
b- Atrial fibrillation
A frequent cause of atrial fibrillation is atrial enlargement resulting from heart
valve lesions, or from ventricular failure with excess damming of blood in the
atria. The dilated atrial walls predispose to atrial fibrillation, which is irregular
irregularity of the rhythm with no or obscured P-wave.
29
Atrial fibrillation, no P wave or obscurred.
Atrial fibrillation; irregular rhythm (irregular irregularity).
Atrial fibrillation; Fine, high frequency, and very low voltage P- wave.
c- Atrial Flutter
In Atrial flutter, the electrical signal travels as a single large wave front always in one
direction around and around the atrial muscle mass. As shown in the following
Figure, this wave travels from top to bottom to top around the openings of the
superior and inferior venae cavae. Atrial Flutter causes a rapid rate of contraction of
the atria, usually between 200 and 350 beats per minute. But not all can stimulate the
ventricles, therefore, there are usually two to three beats of the atria for every single
beat of the ventricles.
In the Atrial flutter ECG trace, the P waves are strong (saw-teeth appearance), the
QRS-T complex follows an atrial P wave only once for every two to three beats of
the atria, giving a 2:1 and a 3: 1 rhythm.
Pathways of impulses in atrial flutter and atrial fibrillation.
30
Atrial flutter; saw-teeth appearance of the P-wave.
Junctional tachycardias (AV nodal paroxysmal tachycardia)
Paroxysmal tachycardia often results from an aberrant rhythm that involves the AV
node. This usually causes normal QRST complexes but missing or obscured P-waves.
Ventricular Paroxysmal Tachycardia (VT):
The electrocardiogram of ventricular paroxysmal tachycardia has the appearance of a
series of ventricular premature beats occurring one after another without any normal
beats inbetween. Ventricular tachycardia frequently initiates the lethal condition of
ventricular fibrillation because of rapid stimulation of the ventricular muscle.
Ventricular paroxysmal tachycardia.
31
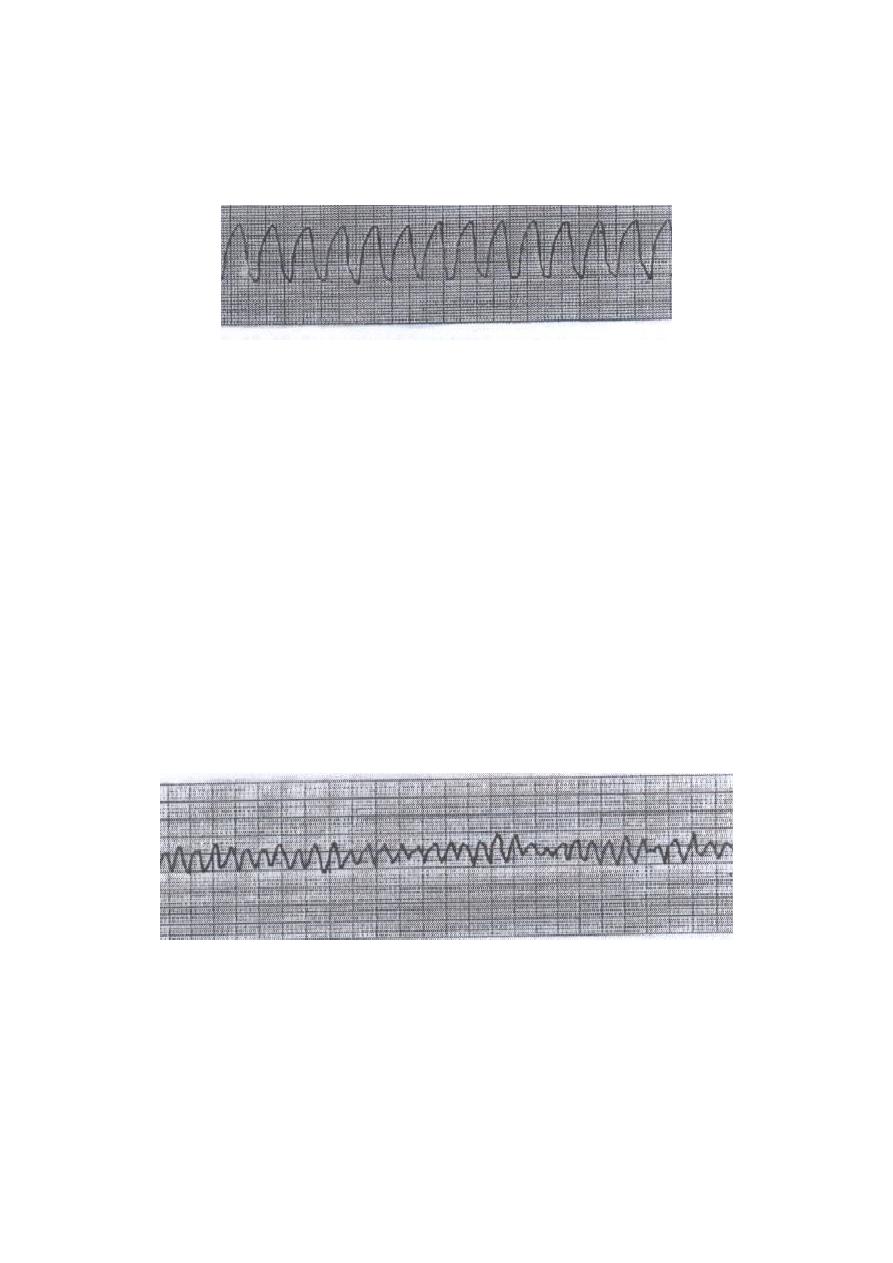
a- Ventricular tachycardia (VT)
VT refers to a rhythm originating from a ventricular ectopic focus at a rate greater
than 100 beats per minute. The ECG shows a wide-complex tachycardia with no
associated P-wave.
Ventricular tachycardia, regular wide QRS tachycardia
at a rate of 170 / min.
b- Ventricular fibrillation (VF)
Ventricular fibrillation results from cardiac impulses that have gone here and there
within the ventricular muscle mass. Stimulating first, one portion of the ventricular
muscle, then another portion, then another, and eventually feeding back onto itself to
re-excite the same ventricular muscle over and over. Multiple factors can spark the
beginning of ventricular fibrillation:
(1) Sudden electrical shock of the heart.
(2) Ischemia of the heart muscle, of its specialized conducting system, or both.
Ventricular fibrillation.

32
Lect. 8
Cardiac output
Objectives:
1. Define cardiac output, heart rate, and stroke volume.
2. Describe how heart rate and stroke volume interact to control cardiac output.
3. state the influence of venous return on cardiac output.
4. Define the terms preload, and afterload.
Cardiac output is the amount of blood pumped by each ventricle per minute,
expressed in liters/minute. Normally, it is about 5 liters per minute.
The cardiac output (CO) is determined through multiplying the heart rate (HR) by the
stroke volume (SV).
CO = HR X SV
Heart rate = the number of heart beats/minute (aveage; 72 beat/minute).
Stroke volume = the volume of blood ejected by each ventricle with each beat.
If the HR = 72 beats/min., and the SV is of 70 ml;
Cardiac output = 72 X 70 = 5.04 Liters.
As the cardiovascular system is a closed system, cardiac output of the left ventricle
equals to the cardiac output of the right ventricle i.e., the two sides of the heart have
the same output per minute. It is also the volume of blood flowing through either the
systemic or pulmonary circulation per minute. In other words, cardiac output is the
quantity of blood pumped into the aorta each minute by the heart. This is also the
quantity of blood that flows through the circulation.
cardiac output= arterial blood flow = pulmonary blood flow.
Cardiac output varies widely with the level of activity of the body. Therefore, the
level of body metabolism, exercise, age and size of the body influence the cardiac
output. For young, healthy men, the resting cardiac output averages about 5.6
liter/min., for young women, this value is 10-20% less, but it is not constant. It might
be increased even up to 30 liters/min., depending on the activity of the body.
Therefore, cardiac output is a variable parameter usually it is not less than
5 liter/min., at rest to supply the body with oxygen and to maintain normal BMR
(basal metabolic rate). The highest cardiac output recorded is 48 liters/min., in the
Roadrunners (Hyperdynamic circulation which mean the same blood volume; 5 liters
circulating at a higher speed). Blood volume is about 5 - 6 liters. So the heart pumps
the whole blood in one minute.
Control of cardiac output:
The cardiac output is controlled (either increased or decreased or maintained) by the
following factors.
Venous return (preload).
Heart rate (HR)
Myocardial contractility.
Cardiac compliance.
Afterload.

33
Venous return:
The venous return (VR) is the amount of the blood flowing from the tissues into the
veins and then into the right or left atrium each minute. So in steady state, they are
equal (CO = VR) because what is pumped out from the left ventricle equals to what
returned to the right side of the heart. In other words, It is the quantity of blood
flowing from the veins into the right atrium each minute. It represents the preload.
The venous return and CO must be equal to each other.
The CO is controlled by venous return through the following mechanisms:
Frank-Starling law; the heart pumps automatically whatever amount of blood
flows into the right atrium from the veins. This law states that when increased
quantities of blood flow into the heart, this stretches the walls of the heart
chambers. As a result of the stretch, the cardiac muscle contracts with
increased force to empty the expanded chambers i.e. the extra blood that flows
into the heart (VR) is automatically pumped without delay into the aorta and
flows again through the circulation.
The effect of the venous return on the heart rate by mean of stretching the
heart. Stretch of the SA node in the wall of the right atrium has a direct effect
on the rhythmicity of the SA node itself to increase heart rate 10 – 15% .
Another factor, the stretched right atrim initiates a nervous reflex called the
Bainbridge reflex, passing first to the medullary vasomotor center and then
back to the heart by sympathetic nerves, to increase the heart rate. The increase
in the heart rate then helps to pump the extra blood.

34
Decrease in Cardiac Output Caused by Decreased Venous Return.
Anything that interferes with venous return also can lead to decreased cardiac output.
Some of these factors are the following:
1. Decreased blood volume.
Resulting most often from hemorrhage. Loss of blood decreases the filling of the
vascular system to such a low level that there is not enough blood in the peripheral
vessels to create peripheral vascular pressures high enough to push the blood back
to the heart.
2. Acute venous dilation.
In case of sudden and acute vasodilatation especially the peripheral veins involved.
This results most often when the sympathetic nervous system suddenly becomes
inactive. For instance, fainting often results from sudden loss of sympathetic
nervous system activity, which causes the peripheral vessels, (veins), to dilate
markedly. This decreases the filling pressure of the vascular system because the
blood volume can no longer create adequate pressure in the flaccid peripheral
blood vessels. As a result, the blood “pools” in the vessels and does not return to
the heart.
3. Obstruction of the large veins.
When the large veins leading into the heart become obstructed, so that the blood in
the peripheral vessels cannot flow back into the heart. Consequently, the cardiac
output falls markedly.
4. Decreased tissue mass, especially decreased skeletal muscle mass.
With normal aging or with prolonged periods of physical inactivity, there is
usually a reduction in the size of the skeletal muscles. This, in turn, decreases the
total oxygen consumption and blood flow needs of the muscles, resulting in
decreases in skeletal muscle blood flow and cardiac output.
* Regardless of the cause of low cardiac output, if the cardiac output falls below that
level required for adequate nutrition of the tissues, the person is said to suffer
circulatory shock. This condition can be lethal within a few minutes to a few hours.

35
Heart rate and cardiac output:
In resting state, (the venous return is constant), changes in heart rate between 100-200
beats/min., not affect CO markedly. However, high heart rate (more than 200
beats/minute) in patient with ventricular tachycardia (VT) or supraventricular
tachycardia (SVT) may affect CO to be insufficient to maintain the nutritional needs
of the body because such increase in heart rate will reduces the duration of
ventricular diastole and so reduce the time available for ventricular filling that will
reduce the stroke volume. On the other hand, slow heart rate may also reduce CO, as
in complete heart block disease (HR < 40 beats/minute).
In exercise, (the venous return is increased), cardiac output is increased to meet the
body need by increasing in both heart rate and stroke volume, the increase in heart
rate is through sympathetic stimulation as the exercise is a stressful situation, while
the increase in stroke volume is through the increase in venous return by the action of
skeletal muscles that squeezed and pumped the blood toward the heart, and through
the increased myocardial contractility.
So, the heart rate is effective in increasing the CO if the venous return is increased,
otherwise the stroke volume will be decreased and so the decreased CO.

36
Lect. 9
Con. On cardiac output …
Stroke Volume
Objectives:
1. Describe how a change in preload, afterload, and myocardial contractility will
affect cardiac performance.
Stroke volume (SV) is defined as the amount of blood pumped out by each ventricle
per beat. It is about 70 ml/beat at rest but may increase to 150 ml/beat with exercise.
The stroke volume equals to the amount of blood present in the ventricle when
systole starts just before the initiation of ventricular contraction. However, the
ventricles don’t completely empty themselves of blood during contraction (2/3 of
blood is ejected, 1/3 is left there) therefore, a more forceful contraction can produce
an increase in stroke volume.
Substruction of end-systolic volume (ESV) from end-diastolic volume (EDV)
produce stroke volume (SV).
SV = EDV - ESV.
EDV: the ventricular blood volume at the end of the diastole; normally
EDV = 110 to 120 ml.
ESV: the ventricular blood volume at the end of the systole; normaly ESV = 40 ml.
* Strok volume = 70 to 80 ml.
Regulation of Stroke Volume
The stroke volume is regulated by three variables:
The end-diastolic volume (EDV).
Sympathetic nervous system input to the ventricles (myocardial contractility;
strength of ventricular contraction).
The total peripheral resistance.
The end-diastolic volume is the amount of blood in the ventricles immediately
before they begin to contract (preload). The stroke volume is directly proportional to
the preload; an increase in EDV results in an increase in stroke volume. This
relationship is known as the Frank-Starling law. In other words, the ventricle
contracts more forcefully during systole when it has been filled to a grater degree
during distole.
The stroke volume is also directly proportional to the myocardial contractility
which is influenced by cardiac sympathetic nerves (norepinephrine) and circulating
epinephrine secreted from adrenal medulla. Thus, when the ventricles contract more
forcefully as a result of sympathetic nerve stimulation or epinephrine which is
independend of a change in end-diastolic ventricular volume, they pump more blood
(increased stroke volume).

37
The total peripheral resistance which is the impedance to blood flow in the arteries
(aortic impedance). The pressure in the arterial system before the ventricle contracts
is, in turn, a function of the total peripheral resistance. The higher the peripheral
resistance, the higher the pressure. Thus, an increased arterial pressure tends to
reduce stroke volume. The total peripheral resistance thus presents an impedance to
the ejection of blood from the ventricle, or an afterload imposed on the ventricle after
contraction. This means that the stroke volume is inversely proportional to the total
peripheral resistance; the greater the peripheral resistance, the lower the SV.
Ejection Fraction (EF%):
The proportion of the end-diastolic volume that is ejected against a given afterload
depends on the strength of ventricular contraction. Normally, contraction strength is
sufficient to eject 70 to 80 ml of blood out of a total end-diastolic volume of 110 to
120 ml (2/3 of blood is ejected). The ejection fraction is thus about 65%.
In other words, the ejection fraction is the ratio of stroke volume to end-diastolic
volume (EDV) and it reflects the ventricular contractility, expressed as percentage,
normally it averages at rest 65% (again, about 2/3 of the EDV is ejected).
Increased ventricular contractility causes an increase in ejection fraction.
EF% = SV / EDV X 100.
EF% = 80/120 X 100 = 2/3 %. (more than 55% considered as normal).
In heart failure, the EF is reduced; < 50%.
EF can be measured by Echocardiogram (Echo) that can measure the EDV, ESV and
so the SV.
Myocardial contractility:
It is defined as the strength of contraction at any given EDV.
Myocardial contractility exerts a major influence on stroke volume and in turn on the
cardiac output. It is reduced in heart failure.
It is measured by Ejection Fraction.
Myocardial contractility is affected by the following factors :
The preload (i.e., EDV): controls the power of cardiac contractility by Frank-
Starling's law.
Sympathetic nerve supply: The resting cardiac sympathetic tone increases the
cardiac pumping power to 13-15 litres/minute, and maximal sympathetic
stimulation (e.g. in severe muscular exercise) increases it to about 25 litres/
minute.
The afterload (i.e., aortic impedance): An increase in the afterload
(e.g. due to rise of the arterial blood pressure, aortic stenosis or polycythaemia)
reduces the cardiac pumping power, and vice versa.
Ventricular hypertrophy; This may normally occur in some athletes as a result
of prolonged strenuous exercises, and it can increase the cardiac pumping
power up to about 35 litres minute.

38
Cardiac compliance:
It is the stretchability, elasticity, it is the change in volume per unit change in pressure
= ∆V/∆P, decreased compliance in which there is a myocardial stiffness, this is in
disease condition which will affect cardiac output as in cases of cadiomyopathies, and
pericardial effusion.
Afterload:
It is the resistance that oppose cardiac output, e.g., increased arterial systolic pressure
(systolic hypertension), valve disease that obstruct the outflow of blood as in case of
aortic stenosis disease. So increased afterload will reduce cardiac output.
On the other hand, reduced total peripheral resistance (reduced afterload) causes high
cardiac output. Conditions that can decrease the total peripheral resistance and at the
same time increase the cardiac output to above normal include:
1. Beriberi. This disease is caused by insufficient quantity of the vitamin thiamine
(vitamin B1) in the diet. Lack of this vitamin causes diminished ability of the
tissues to use some cellular nutrients, and the local tissue blood flow mechanisms
in turn cause marked compensatory peripheral vasodilation. Sometimes the total
peripheral resistance decreases to as little as one-half normal. Consequently, the
long-term levels of venous return and cardiac output also often increase to twice
normal.
2. Arteriovenous fistula (shunt, also called an AV shunt): occurs between a major
artery and a major vein, in which blood flow directly from the artery into the vein.
This greatly decreases the total peripheral resistance and, likewise, increases the
venous return and cardiac output.
3. Hyperthyroidism. In hyperthyroidism, the metabolism of most tissues of the body
becomes greatly increased. Oxygen usage increases, and vasodilator products are
released from the tissues. Therefore, the total peripheral resistance decreases
markedly because of the local tissue blood flow control reactions throughout the
body; consequently, the venous return and cardiac output often increase to 40 to 80
percent above normal.
4. Anemia. In anemia, two peripheral effects greatly decrease the total peripheral
resistance, as a consequence, the cardiac output increases greatly. One of these is
reduced viscosity of the blood, resulting from the decreased concentration of red
blood cells. The other is diminished delivery of oxygen to the tissues, which causes
local vasodilation.

39
Low cardiac output:
(Abnormalities)
Fainting: low cardiac output leads to ischemia of the brain; causing fall down
(fainting). It is a protective mechanism to correct the brain ischemia through
increasing blood supply to the brain.
Shock: also low cardiac output that may cause hypotension, again leading to
ischaemia to the brain.
Methods for measuring cardiac output:
In animal experiments, cardiac output can be measured using any type of flowmeter
(electromagnetic, or ultrasonic flowmeter) which can be placed on the aorta or
pulmonary arteries i.e., blood flow in the root of aorta can be recorded by an
electromagnetic flowmeter.
In the human, CO is measured by indirect methods that do not require surgery.
Two methods commonly used are:
The oxygen fick method.
The indicator dilution method.
Another method is by Echocardiography; it consists of emitting Ultrasonic waves to
the heart. Such echoes record the ventricular movements, from which both the EDV
and ESV and so the SV can be calculated. The CO then can be measured by
multipling the SV X HR.
……………………………………………………………………………..
ESV contractility and afterload.
EDV cardiac compliance and preload (venous return).