1
1
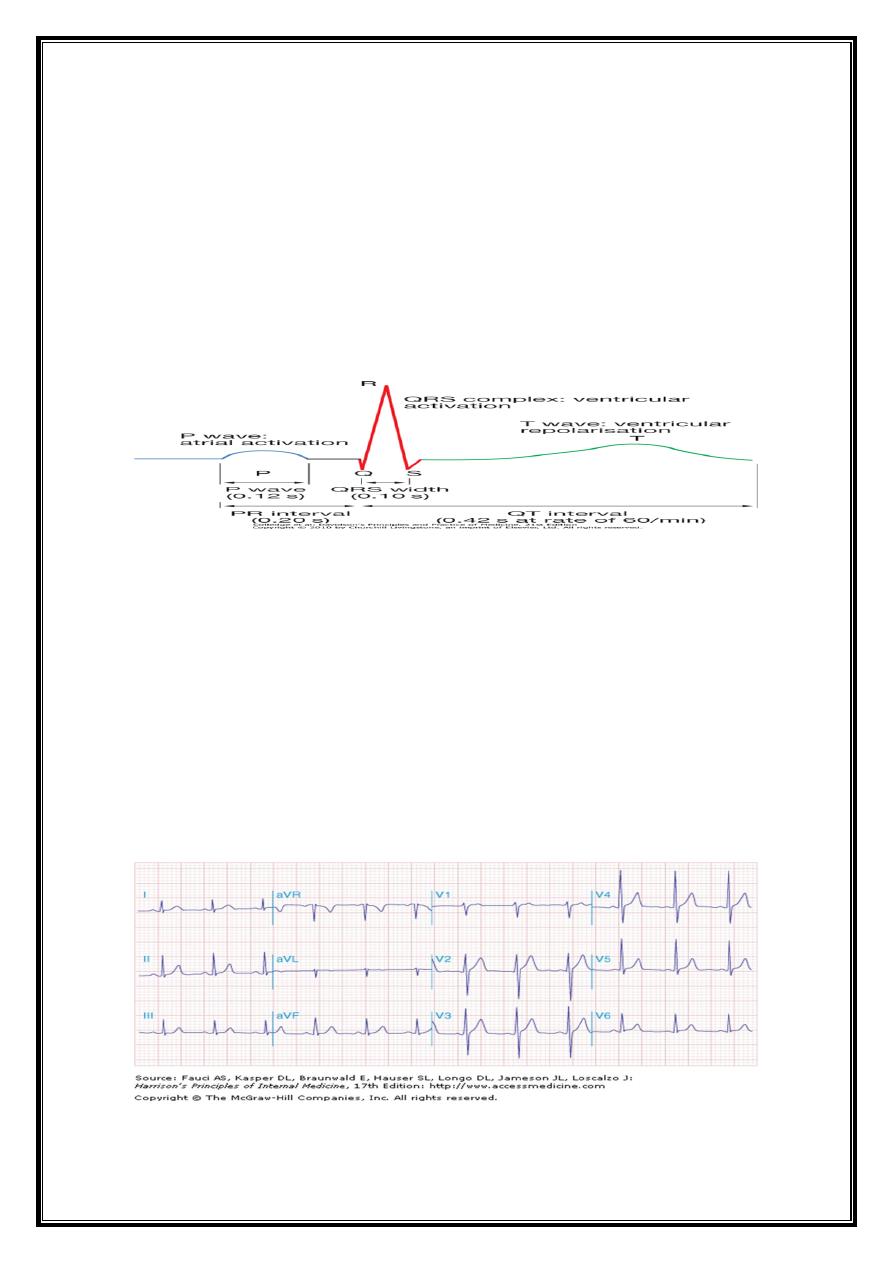
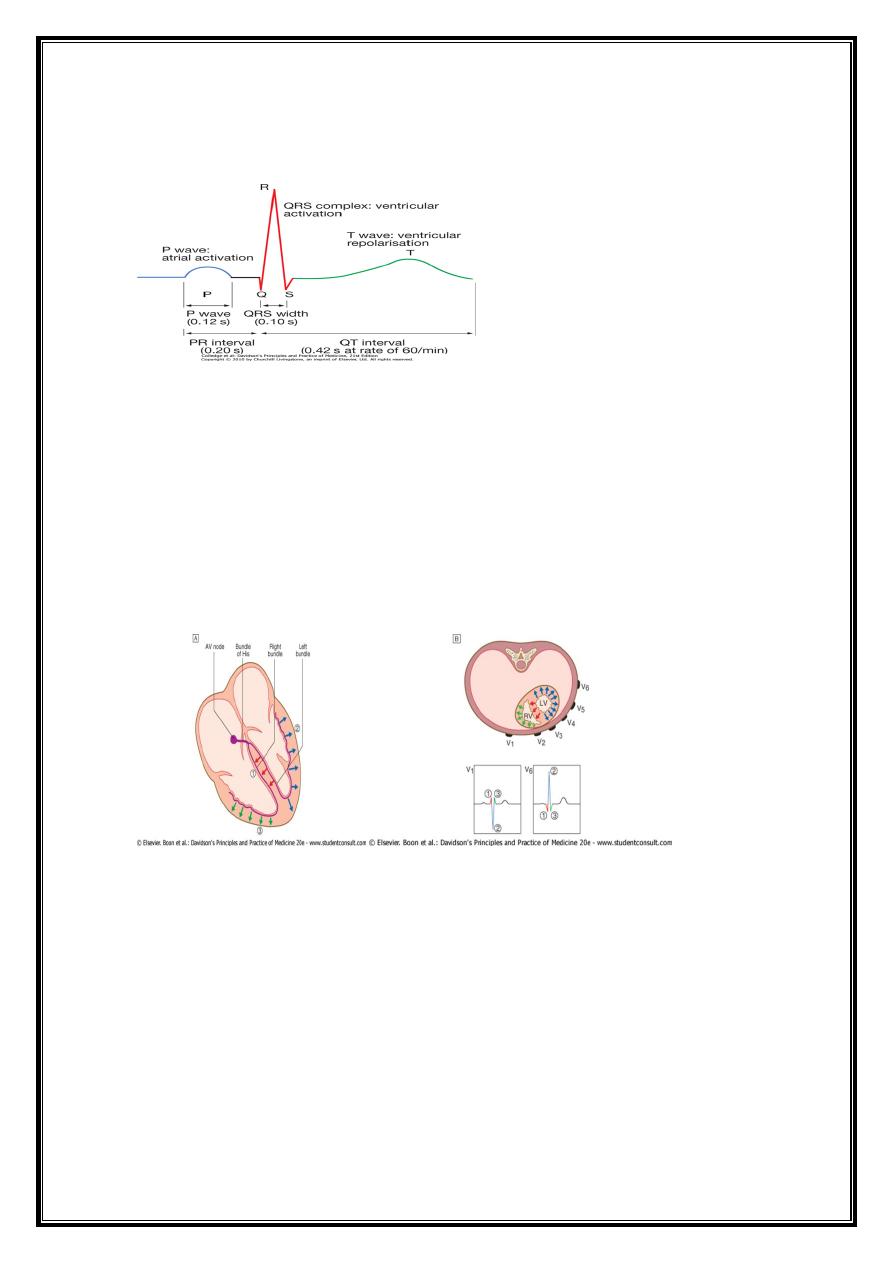
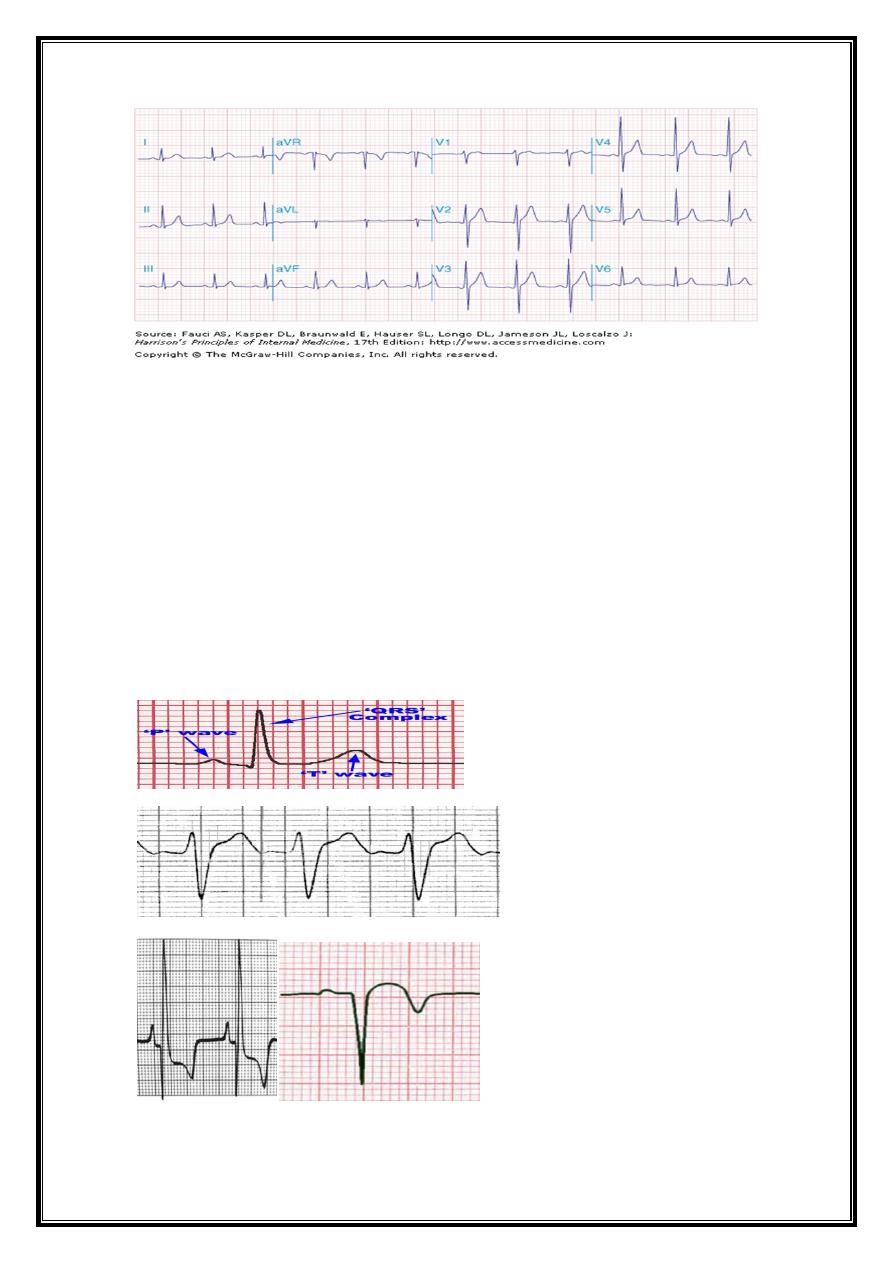
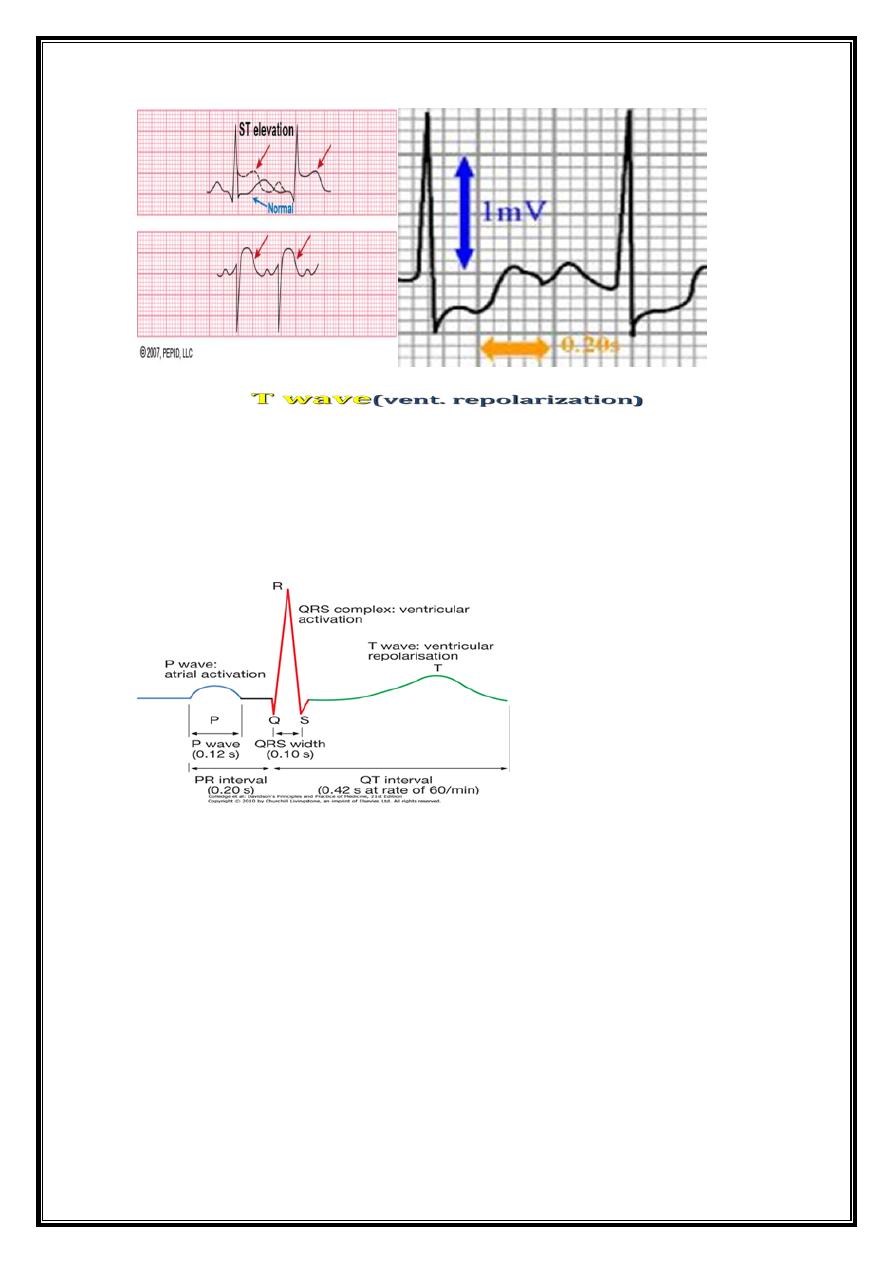
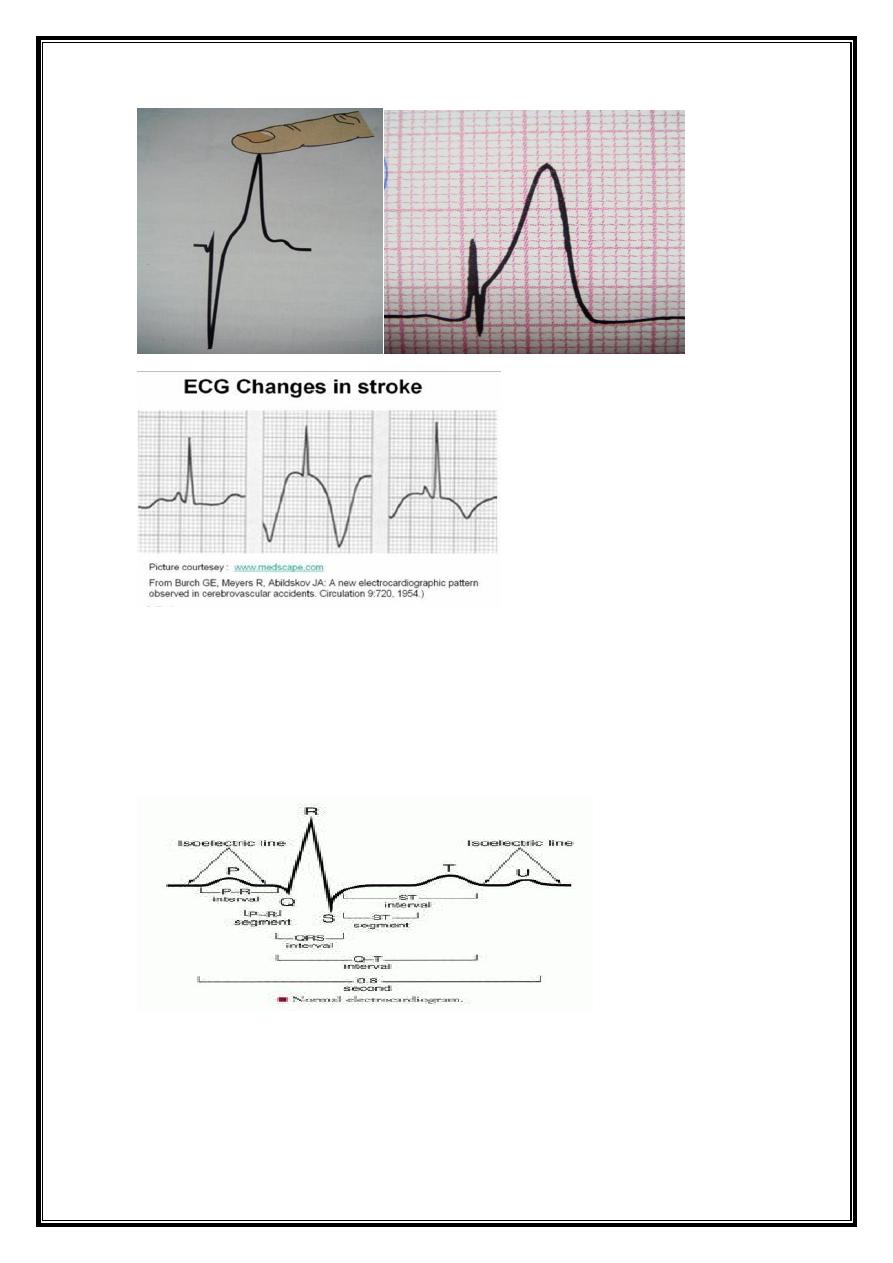
ECG Waveforms and Intervals
ECG waveforms labeled alphabetically
P wave== represents atrial depolarization QRS complex=ventricular depolarization
ST-T-U complex (ST segment, T wave, and U wave)== V repolarization.
J point = junction between end of QRS complex -beginning ST Segment
Atrial repolarization =too low in amplitude to be detected,
may become apparent in acute pericarditis and atrial infarction
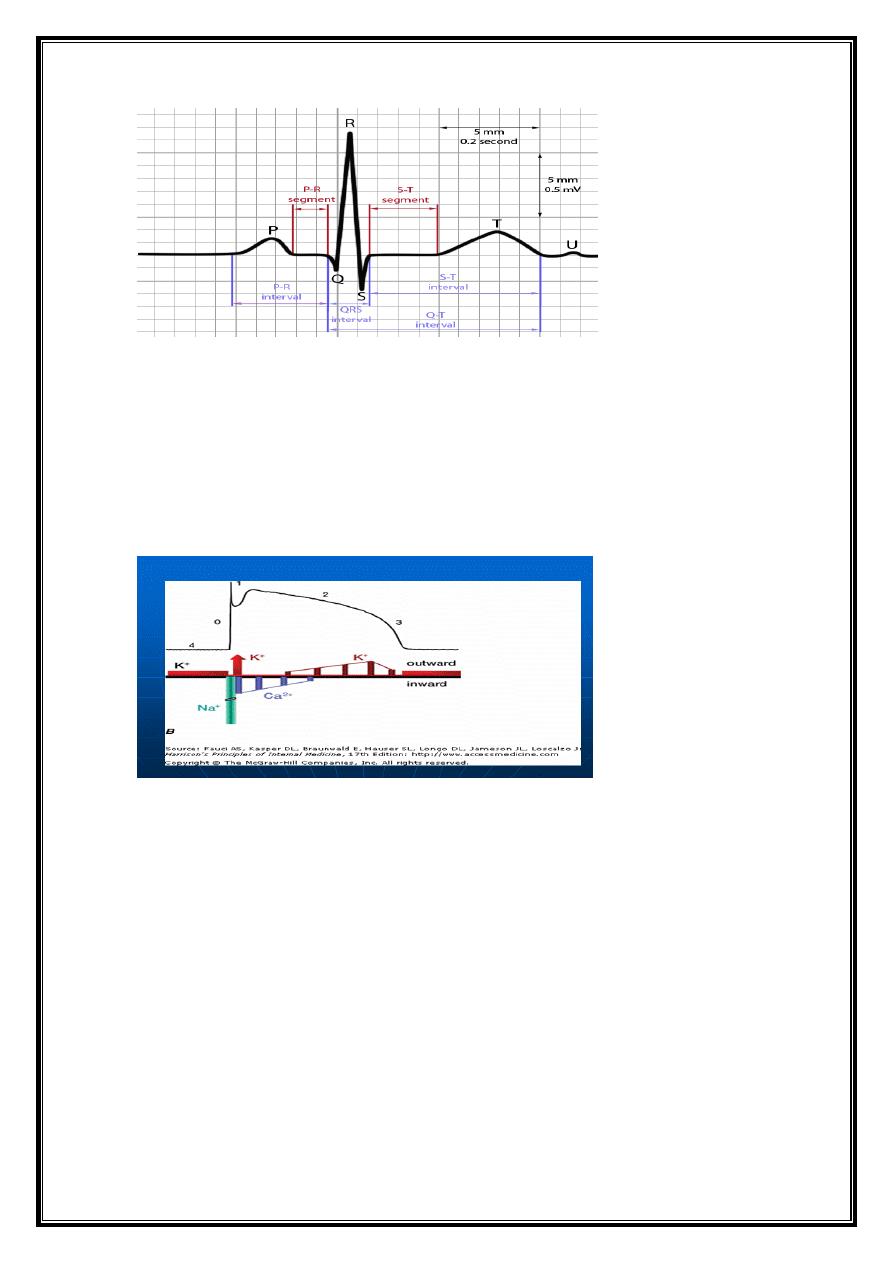
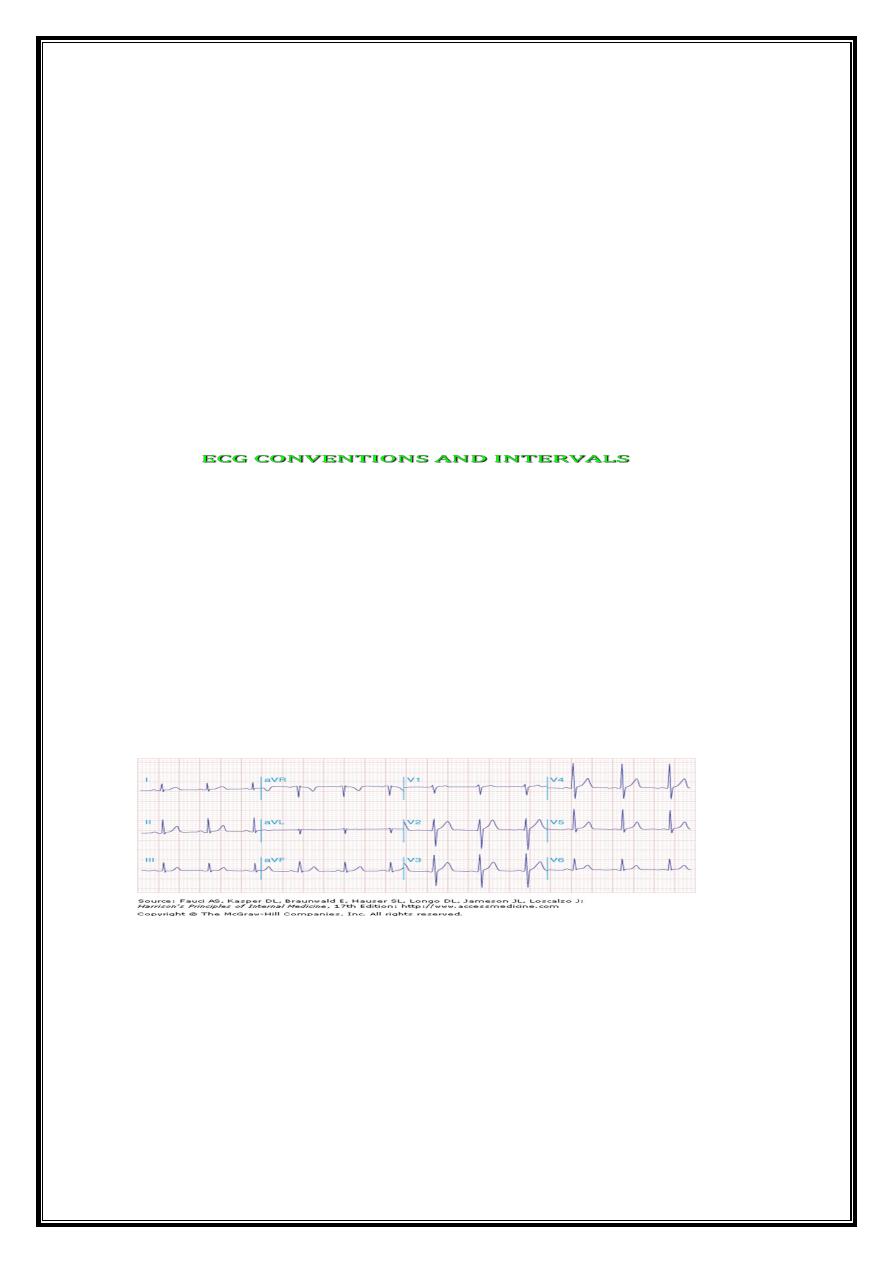
ECG CONVENTIONS AND INTERVALS
Depolarisation towards electrode: positive deflection
Depolarisation away from electrode: negative deflection
Sensitivity: 10 mm = 1 mV
Paper speed: 25 mm per second
Each large (5 mm) square = 0.2 s
Each small (1 mm) square = 0.04 s
HR= 1500/R-R interval (mm) (i.e. 300 ÷ No. of large sq.between beats)
2
2
Origin of ECG waves & segments
1-Normal Complexes (waves)
2-Normal Intervals
3-Normal Segments and Junctions
P wave
Origin=produced by atrial depolarization
Length(duration)= 0.12 second long or less
Amplitude(height)(voltage)=2.5mm
Direction= leftward and inferiorly in the frontal plane
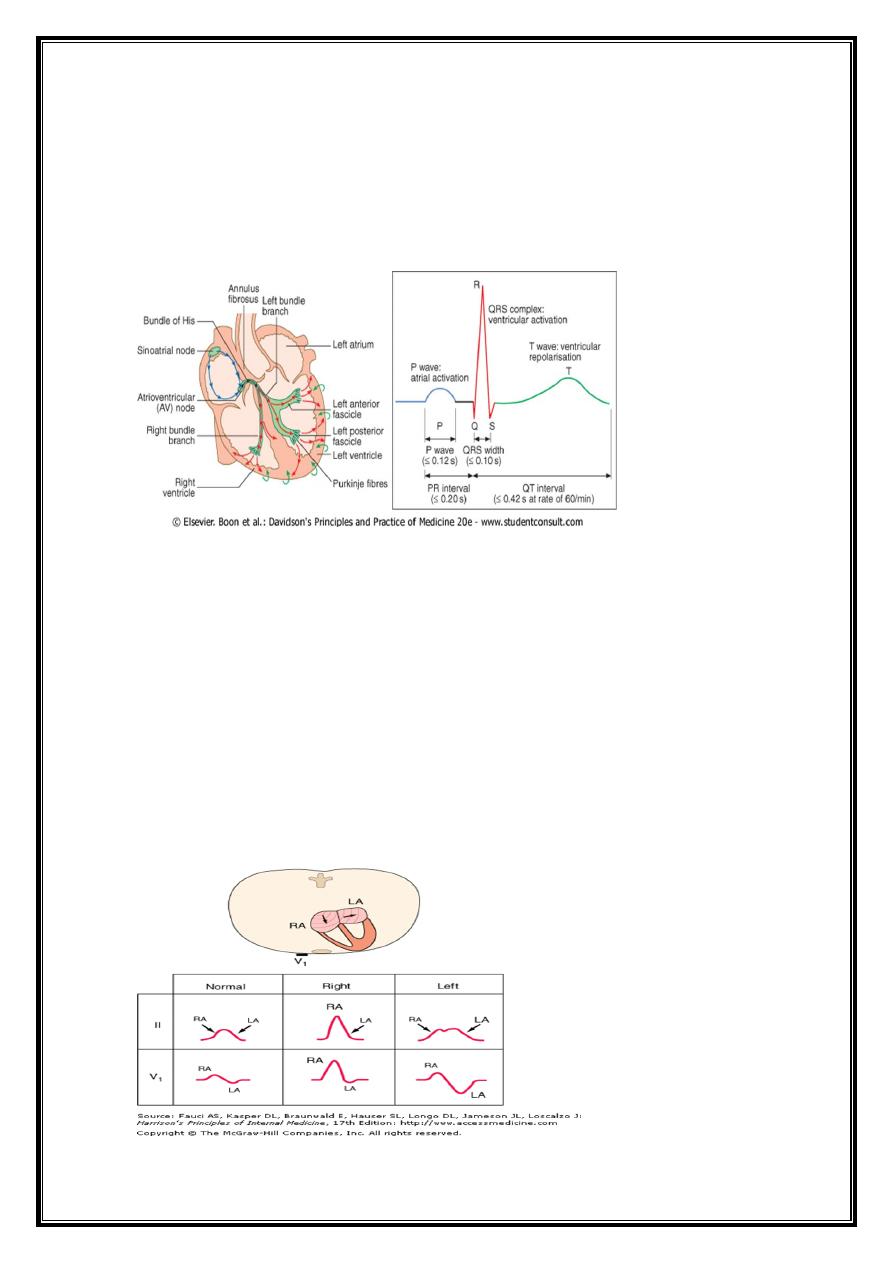
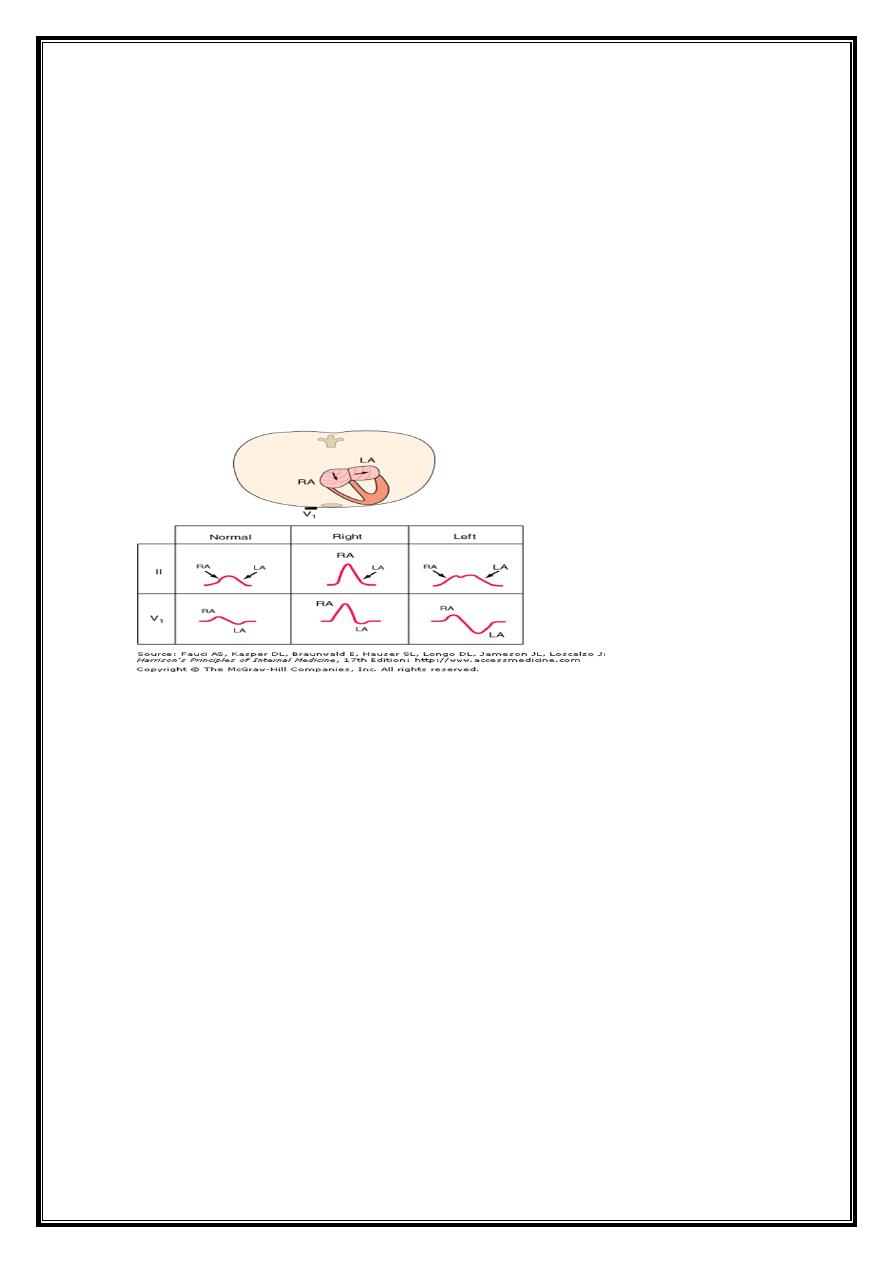
normal P wave -positive in lead II and negative in lead aVR.
normal P wave in lead V1 =biphasic with a positive component reflecting right atrial
depolarization, followed by a small (<1 mm2) negative component reflecting left atrial
depolarization.
3
3
Abnormalities of P wave
Absent (ventricular or supraventricular arrhythmias)
Relation of P wave to QRS complex
Long P wave = Right atrial enlargement or hypertrophy, or interatrial conduction delay
(conduction system disease .
Notched=left Atrial enlargement (MS)
Retrograde P waves (negative in lead II, positive in lead aVR) (activation of atria from
ectopic pacemaker in lower part of either atrium or in AV junction region)
PR interval measures Atrio-Ventricular conduction time=
1- time required for atrial depolarization
2- normal conduction delay in AV node (approx. 0.07 sec.)
3- impulse propagation through His bundle and bundle branches to the onset of
ventricular depolarization.
Normal PR interval= 0.12- 0.20 second
related to heart rate and to prevailing autonomic tone
4
4
QRS Complex
QRS-T waveforms of surface ECG correspond in general way with =different phases of
simultaneously obtained ventricular action potentials (intracellular recordings from single
myocardial fibers
Rapid upstroke (phase 0) of AP = onset of QRS.
Plateau (phase 2) corresponds to = isoelectric ST segment
Active repolarization (phase 3) = inscription of T wave.
Nomenclature of QRS complex (ventricular depolarization).
Q (q) wave =initial negative deflection = onset of ventricular depolarization;
R (r) wave =first positive deflection = ventricular depolarization
S (s) wave =negative deflection = ventricular depolarization that follows first positive (R)
wave.
QS wave =negative deflection that does not rise above baseline.
R' (r') wave = second positive deflection and follows an S wave;
s‘ wave= negative deflection that follows r‘ is termed;
If s wave does not follow initial R wave==> second positive deflection ==> R'(r')
wave.QRS complex ==> Rr‘ (rR') complex.
5
5
Capital letters (Q, R, S) =waves greater than 5 mm;
lowercase letters (q, r, s) =waves less than 5 mm.
QRS Phases of vent.depolarization
1-Depolarisation of interventricular septum =moves from left to right==>small initial
negative deflection in lead V6 (Q wave) and initial positive deflection in lead V1 (R
wave).
2-activation of body of LV, =large positive deflection or R wave in V6 (with reciprocal
changes in V1).
3-final phase of depolarisation =RV ==>produces small negative deflection or S wave in
V6.
Appearance of QRS Complex during Normal V. dep.
Right precordial lead (V1) =biphasic depolarization process = small positive deflection
(septal r wave) followed by a larger negative deflection (S wave).
Left precordial lead-V6= same sequence with a small negative deflection (septal q wave)
followed by a relatively tall positive deflection (R wave).
Intermediate leads =relative increase in R-wave amplitude (normal R-wave progression) and
decrease in S-wave amplitude progressing across chest from right to left. Precordial lead
where R and S waves are of approximately equal amplitude ==transition zone (usually V3 or
V
6
6
Abnormalities of QRS complex
1-Wide QRS=bundle branch blo
2-High(tall) QRS =
ventricular hypertrophy
3-Deep Q wave=
pathological Q=M infarction
4-Progression of R w ave
0
7
7
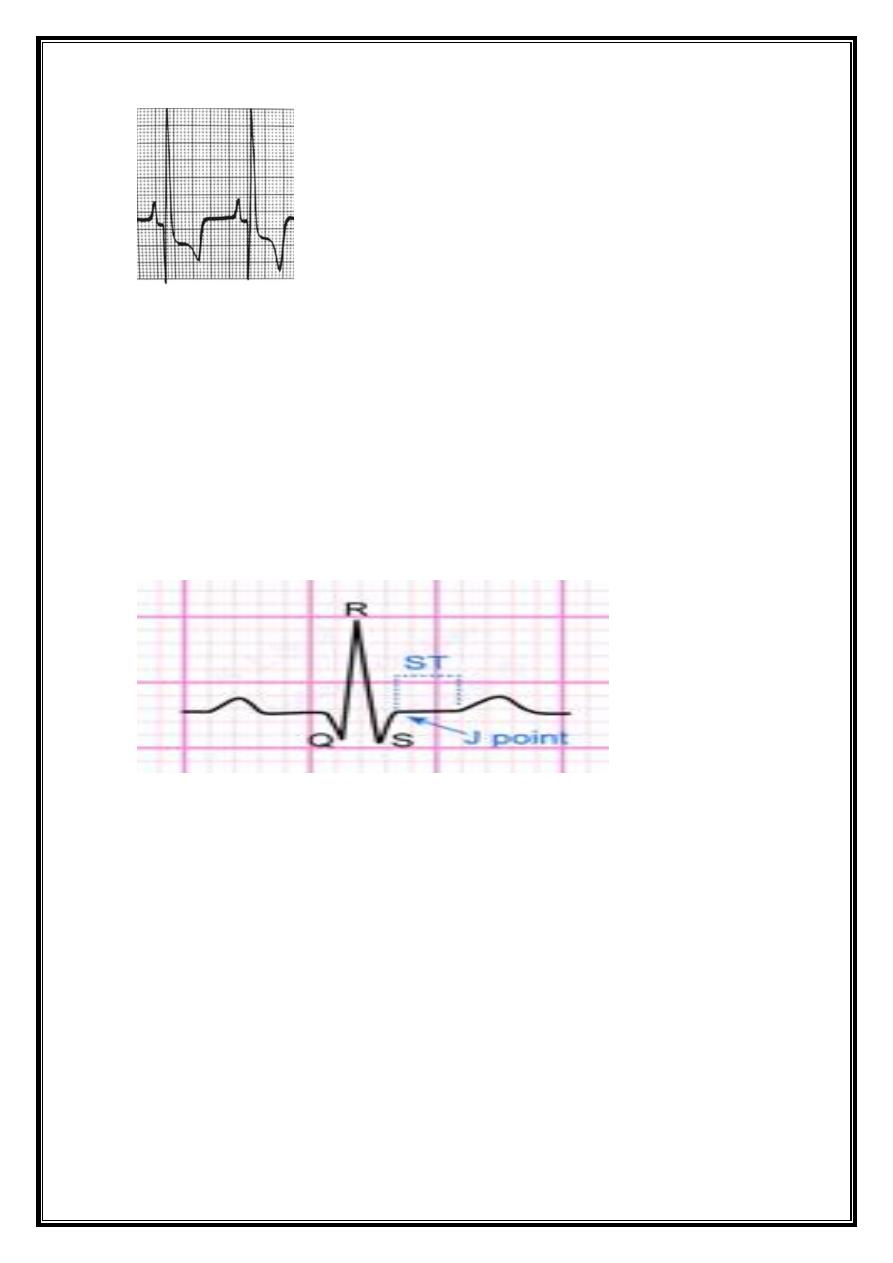
ST segment
J junction=
point at which the QRS complex ends and t ST segment begins;
cannot be easily discernible during rapid heart rates and hyperkalemia.
can be depressed or elevated relative to the isoelectric baseline.
ST segment =
begins at J point and ends at onset of T wave.
usually isoelectric - may vary from -0.5 to +2 mm in precordial leads;
considered elevated or depressed compared with portion of baseline between end of
T wave and beginning of P wave (TP segment).
ST-segment abnormalities are important diagnostically in acute myocardial ischemia and
infarction and pericarditis
Abnormalities of ST segment
ST elevation
ST depression
8
8
T wave
= deflection produced by ventricular repolarization.
Normally= mean T-wave vector oriented roughly concordant with mean QRS vector (within
about 45° in the frontal pla
Abnormalities of T wave
T-wave inversion = myocardial ischaemia or infarction, and electrolyte disturbances
Hyperacute T-acute MI.hyperkalaemia
9
9
U Wave
Normal U wave = small, rounded deflection ( 1 mm) that follows T wave and usually has
same polarity as T wave.
(usually positive) deflection preceding subsequent P wave; (??repolarization of
intraventricular (Purkinje) conduction system
Abnormities of U wave
1-Abnormal increase in U-wave amplitude
drugs (dofetilide, amiodarone, sotalol, quinidine, procainamide, disopyramide) or
10
10
hypokalemia
2- Very prominent U waves =
marker of increased susceptibility to torsades de pointes (type of ventricular
tachycardia) .
3-Negative U waves, best seen in leads V4-6,
acute myocardial ischemia (insensitive but relatively specific markers of left anterior
descending coronary artery disease)
left ventricular hypertrophy
4- some circumstances(hypokalemia and hypomagnesemia)= U wave represent an
oscillatory membrane potential, called afterdepolarization.
Depolarisation towards electrode: positive deflection
Depolarisation away from electrode: negative deflection
Sensitivity: 10 mm = 1 mV
Paper speed: 25 mm per second
Each large (5 mm) square = 0.2 s
Each small (1 mm) square = 0.04 s
HR=Regular1500/R-R interval (mm) (i.e. 300 ÷ No. of large sq.between
How to read a 12-lead ECG: examination sequence
Rate &Rhythm strip (lead II) =rate and rhythm
Cardiac axis =leads I and lead 11(normal +ve)
P-wave shape =Tall P waves /notched P waves
PR interval Normal = 0.12-0.20 secs.Prolongation//short
QRS duration> 0.12 secs = BBB
11
11
amplitude=Large LVH
Q waves= previous MI
ST segment = elevation =
MI, pericarditis or LVaneurysm
depression = Ml isch. or infar)
T wave= inversion = M ischaemia or infarction, electr.dist.
U-wave =hypokalemia and hypomagnesemia
Very prominent = increased susceptibility to torsades de pointes
Negative U waves, ( V4-6) = in acute Mischemia +LVH
QT interval =onset of Q to the end of T=Normal < 0.42 sec. QT
Varies with HR, must be corrected(Q-Tc).Max.=0.42(men),0.43 sec. (women)
prolongation =congenital long QT syndrome, low K+, Mg2+ or Ca2+, drugs
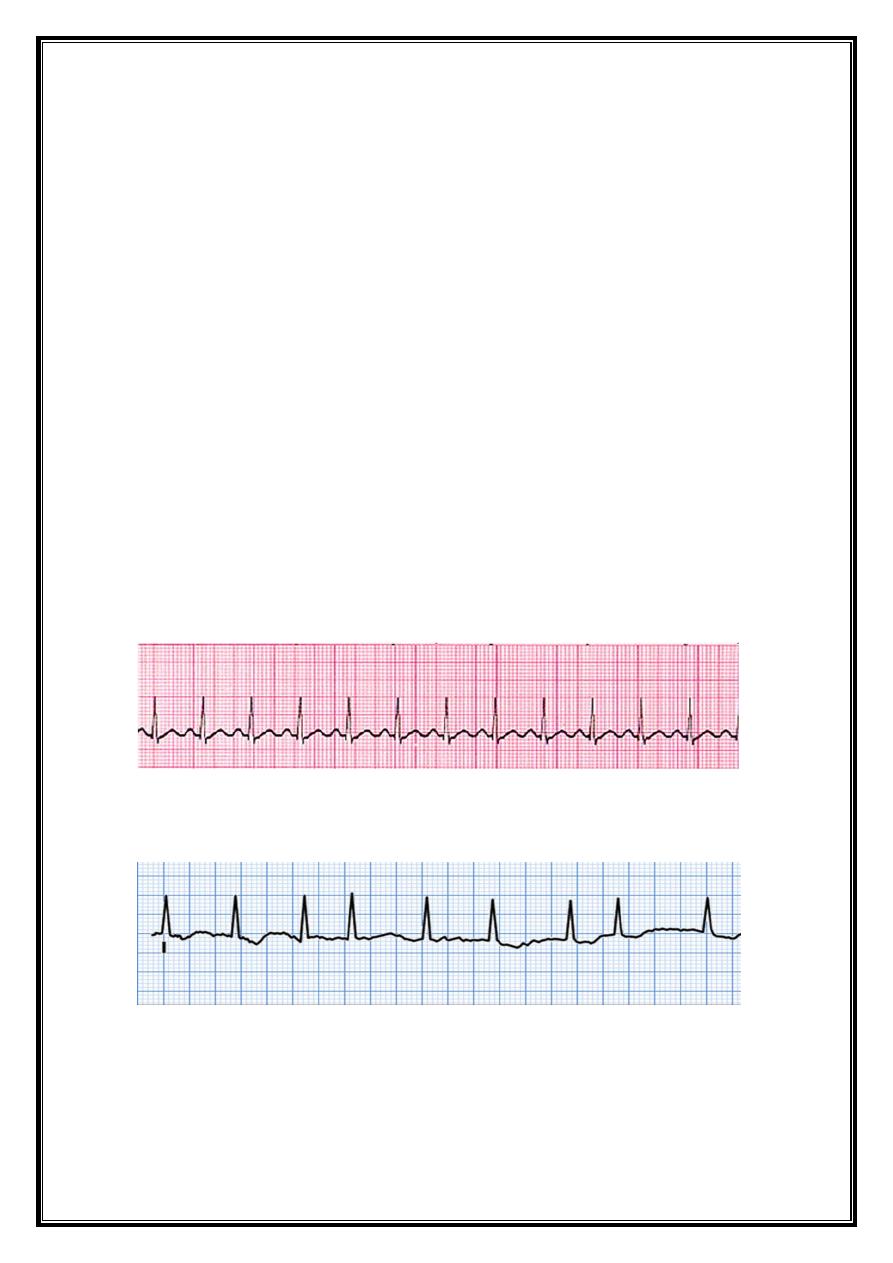
HEART RATE
Regular- 1500/No.of sm.sq. between 2 R or 300/No.of large
Irregular-
No.of R in one min.=60 sec. or 3 sec(15 s sq.)x20
12
12
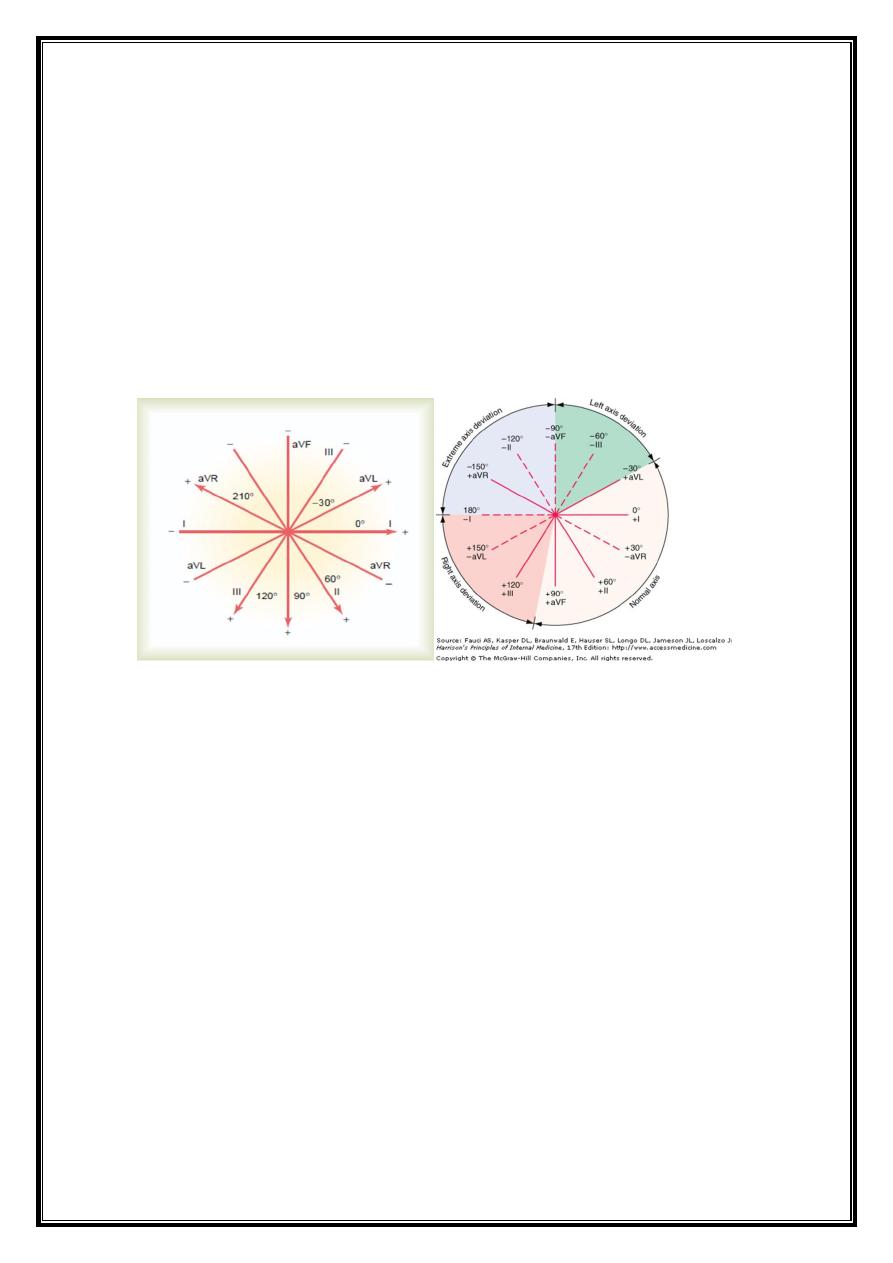
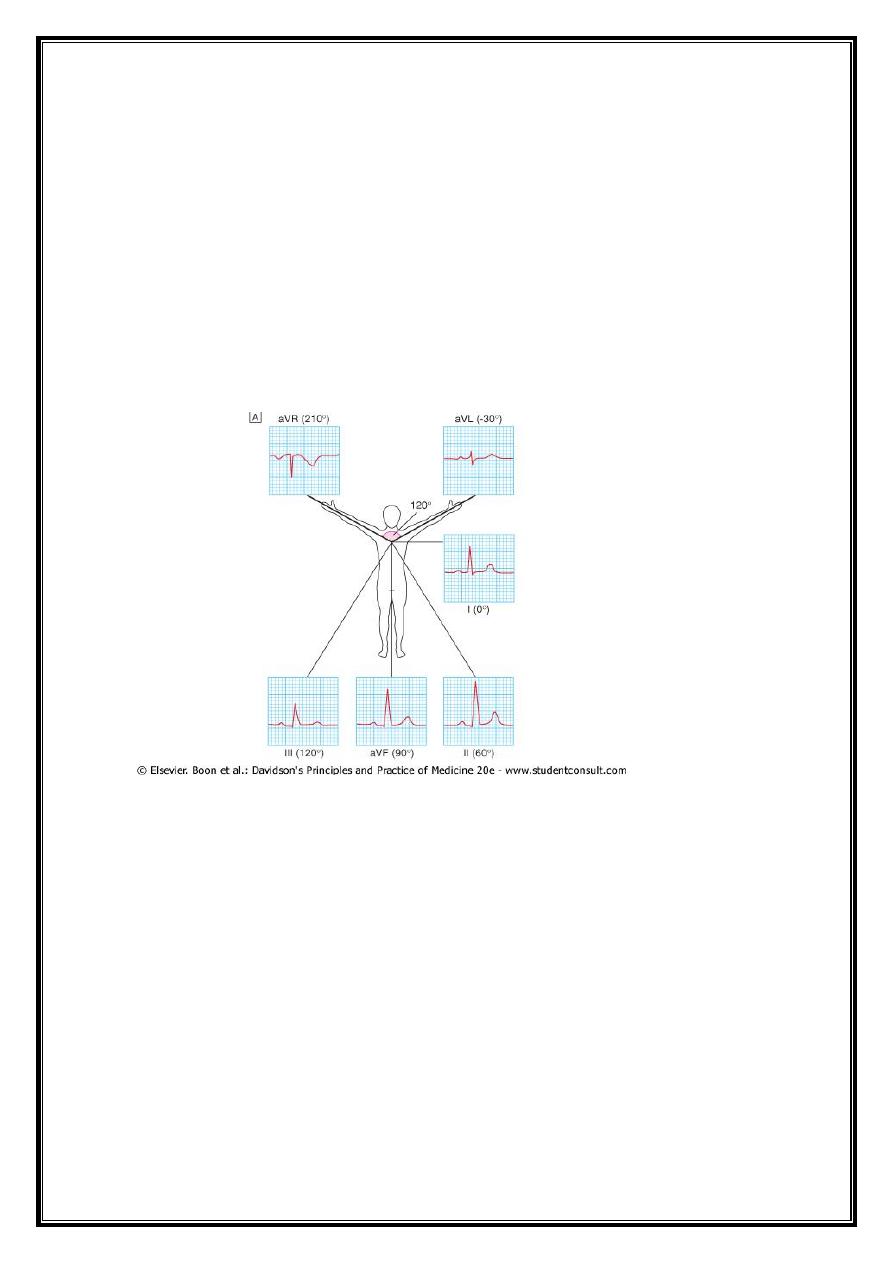
Cardiac axis
average vector of ventricular depolarisation= frontal cardiac axis.
vector at right angles to a lead= depolarisation in that lead is equally negative and positive
(isoelectric).
QRS complex=isoelectric in aVL--negative in aVR
most strongly positive in lead II
main vector or axis of depolarisation =60 °.
normal cardiac axis lies between -30 ° and +90
QRS pattern in extremity leads - vary –
depending on electrical axis of QRS, (mean orientation of QRS vector)
Normally=QRS axis ranges from –30° to +100° .
axis more negative than –30° =left axis deviation,
axis more positive than +100° right axis deviation.
Left axis deviation
normal variant
left ventricular hypertrophy,
block in ant. fascicle of left bundle system
(left anterior fascicular block or hemiblock),
inferior myocardial infarction.
Right axis deviation
13
13
Normal variant (particularly in children and young adults)
Spurious finding (reversal of left and right arm electrodes)
Right ventricular overload (acute or chronic),
Infarction of lateral wall of left ventricle
Dextrocardia,
Left pneumothorax
Left posterior fascicular block.