L
E
N
G
T
H
L
E
N
G
T
H
W
E
I
G
H
T
W
E
I
G
H
T
Birth
3
9
6
Birth
3
12
9
6
18
21
24
27
30
33
36
15
2
3
4
5
6
7
10
12
14
16
8
6
kg
lb
AGE (MONTHS)
12
15
18
21
24
27
30
33
36
kg
Mother’s Stature
Father’s Stature
Gestational
Date
Age
Weight
Length
Head Circ.
Age:
Weeks
Birth
Comment
AGE (MONTHS)
8
9
10
11
12
13
14
15
16
17
90
95
100
cm
cm
100
lb
16
18
20
22
24
26
28
30
32
34
36
38
95
90
75
50
25
10
5
40
45
50
55
60
65
70
75
80
90
95
85
95
90
75
50
25
10
5
15
16
17
18
19
20
21
22
23
24
25
26
27
28
29
30
31
32
33
34
35
36
37
38
39
40
41
in
in
41
40
39
38
37
36
35
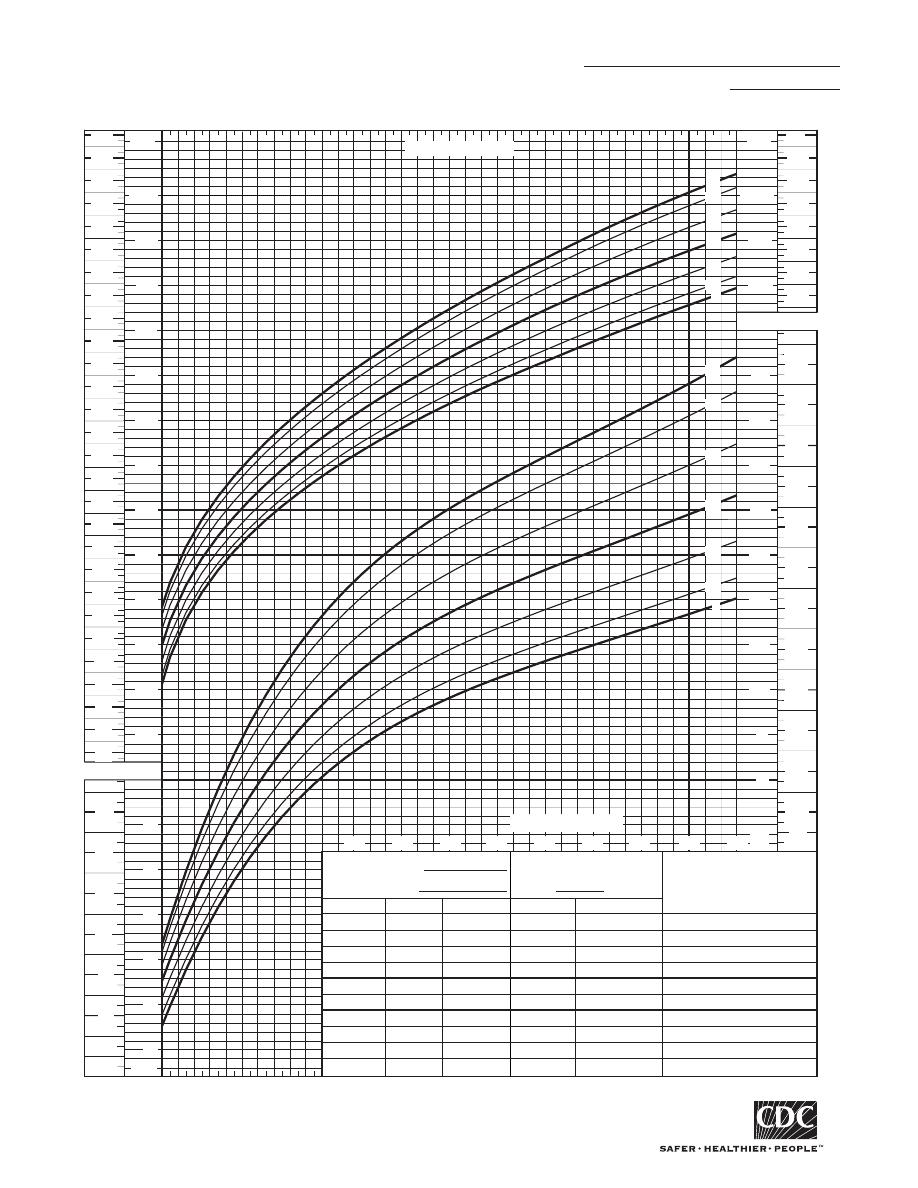
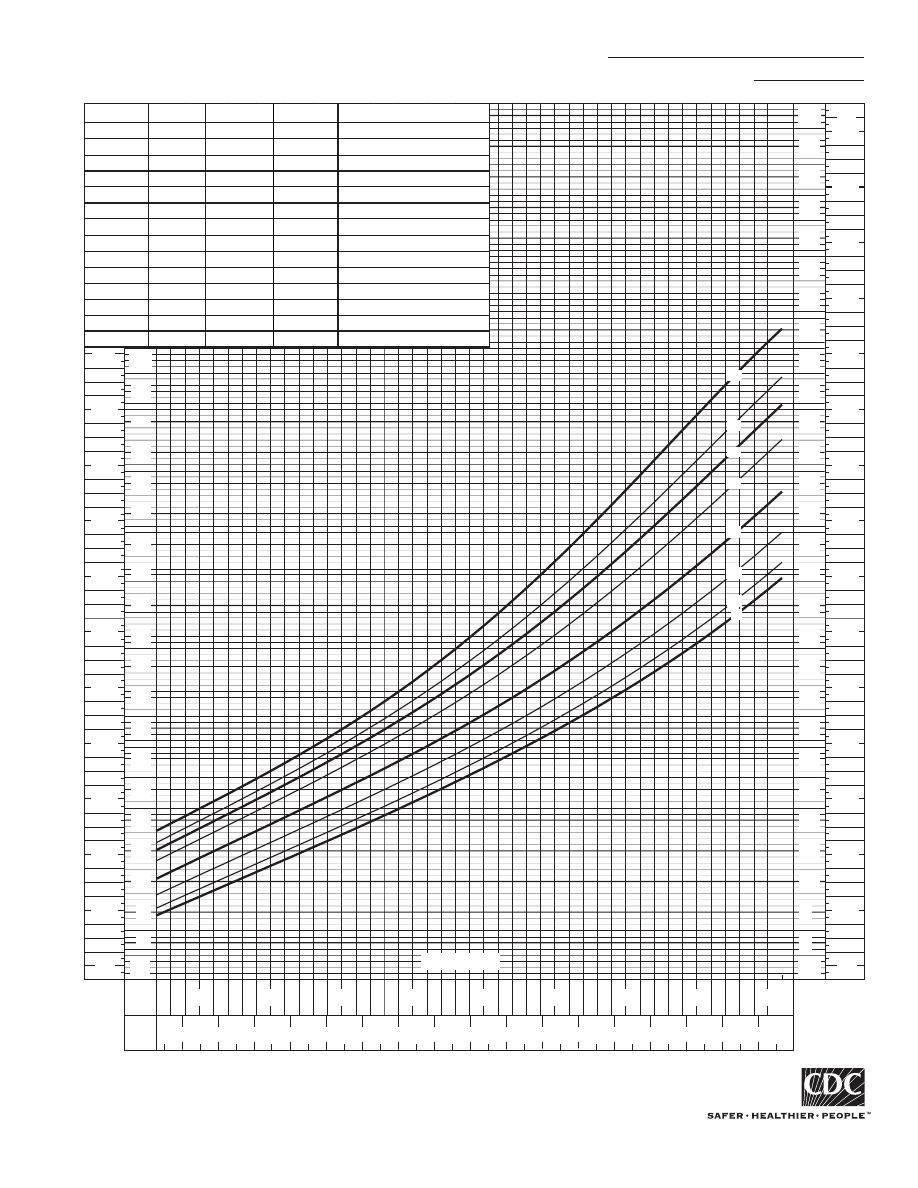
SOURCE: Developed b
(2000).
y the National Center for Health Statistics in collaboration with
the National Center for Chronic Disease Prevention and Health Promotion
http://www.cdc.gov/growthcharts
Birth to 36 months: Boys
L
Weight-for-age percentiles
ength-for-age and
NAME
RECORD #
Pubished May 30, 2000 (modified 4/20/01).
L
E
N
G
T
H
L
E
N
G
T
H
W
E
I
G
H
T
W
E
I
G
H
T
Birth
3
9
6
Birth
3
12
9
6
18
21
24
27
30
33
36
15
2
3
4
5
6
7
10
12
14
16
8
6
kg
lb
AGE (MONTHS)
12
15
18
21
24
27
30
33
36
kg
Mother’s Stature
Father’s Stature
Gestational
Date
Age
Weight
Length
Head Circ.
Age:
Weeks
Birth
Comment
AGE (MONTHS)
8
9
10
11
12
13
14
15
16
17
90
95
100
cm
cm
100
lb
16
18
20
22
24
26
28
30
32
34
36
38
40
45
50
55
60
65
70
75
80
90
95
85
15
16
17
18
19
20
21
22
23
24
25
26
27
28
29
30
31
32
33
34
35
36
37
38
39
40
41
in
in
41
40
39
38
37
36
35
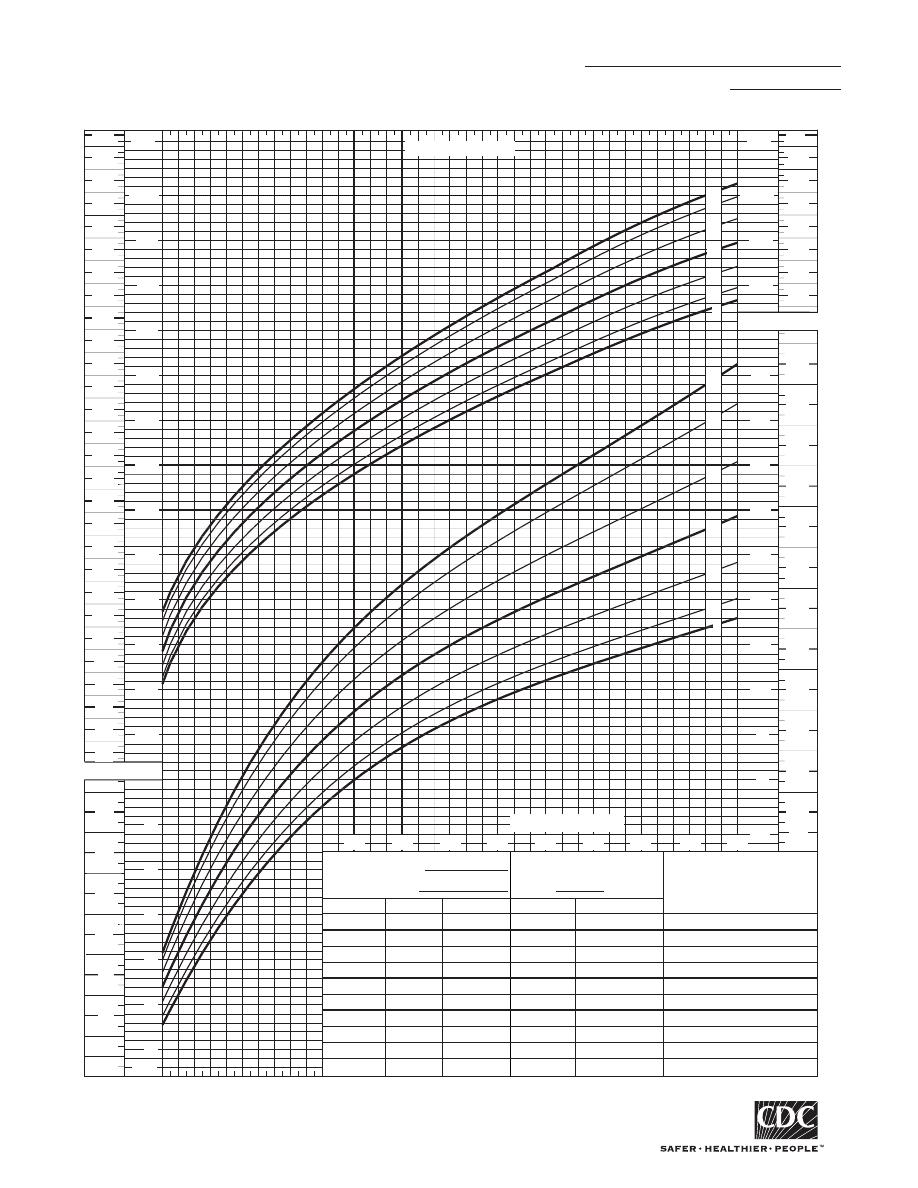
SOURCE: Developed b
(2000).
y the National Center for Health Statistics in collaboration with
the National Center for Chronic Disease Prevention and Health Promotion
http://www.cdc.gov/growthcharts
Birth to 36 months: Girls
L
Weight-for-age percentiles
ength-for-age and
NAME
RECORD #
Published May 30, 2000 (modified 4/20/01).
95
90
75
50
25
10
5
95
90
75
50
25
10
5
12
Birth
3
12
9
6
18
21
24
27
30
33
36
15
52
50
48
46
44
42
40
38
36
32
cm
52
50
48
46
44
cm
20
19
18
17
16
15
14
13
in
20
19
18
in
H
E
A
D
C
I
R
C
U
M
F
E
R
E
N
C
E
34
17
H
E
A
D
C
I
R
C
U
M
F
E
R
E
N
C
E
AGE (MONTHS)
95
90
50
25
10
5
75
30
42
W
E
I
G
H
T
W
E
I
G
H
T
14
20
18
14
16
12
10
8
6
4
2
9
8
7
2
9
8
7
22
20
18
14
16
24
26
28
30
32
34
36
38
40
42
44
in
cm
kg
lb
1
3
12
13
14
15
16
17
W
E
I
G
H
T
12
10
11
46
48
50
22
24
18
19
20
21
22
10
11
6
5
4
95
90
50
25
10
75
5
kg
in
cm
LENGTH
lb
6
5
Date
Age
Weight
Length
Head Circ.
Comment
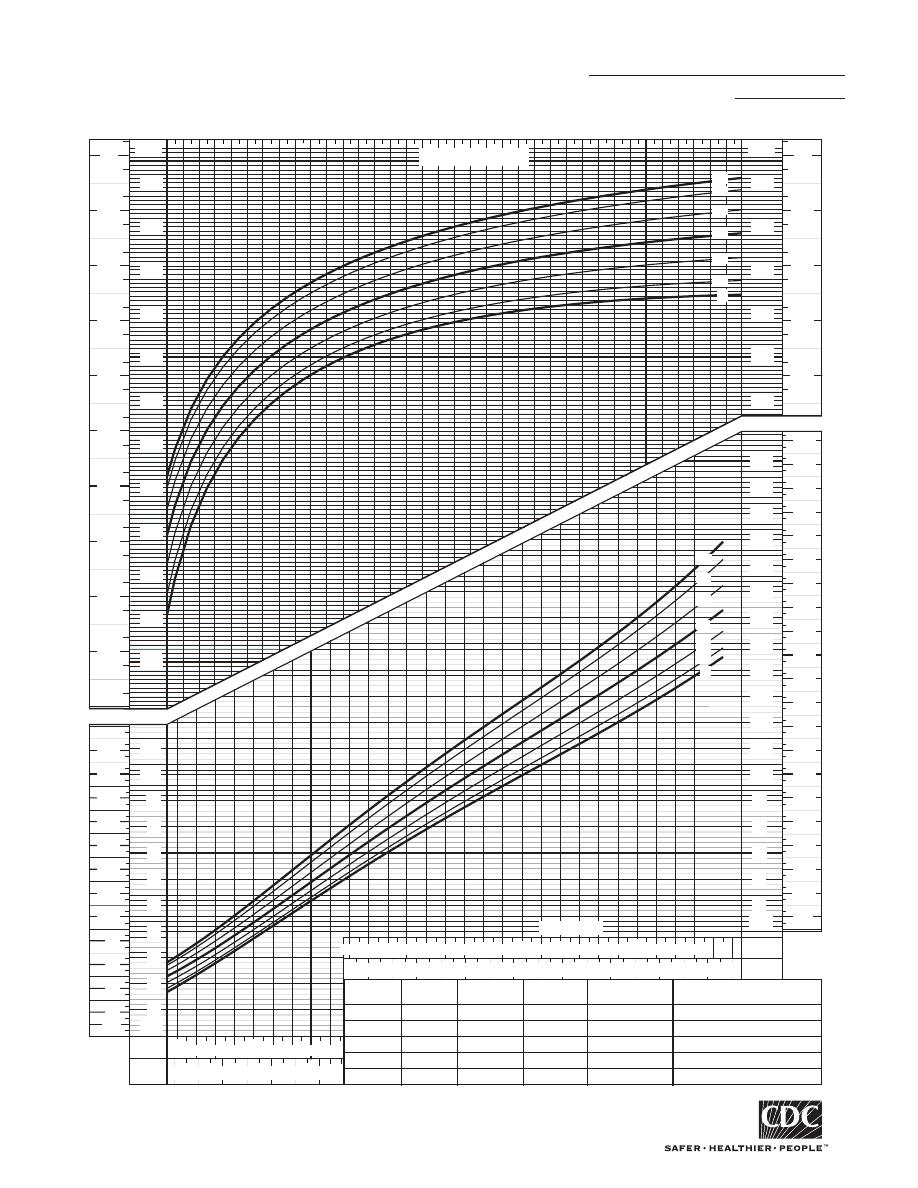
SOURCE: Developed b
(2000).
y the National Center for Health Statistics in collaboration with
the National Center for Chronic Disease Prevention and Health Promotion
http://www.cdc.gov/growthcharts
46 48 50 52 54 56 58 60 62
64 66 68 70 72 74 76 78 80 82 84 86 88 90 92
90
94 96 98100
41
40
39
38
37
35 36
34
33
32
31
30
29
28
27
26
24
23
22
21
20
19
18
Birth to 36 months: Boys
Head circumference-for-age and
Weight-for-length percentiles
NAME
RECORD #
Published May 30, 2000 (modified 10/16/00).
12
Birth
3
12
9
6
18
21
24
27
30
33
36
15
52
50
48
46
44
42
40
38
36
32
cm
52
50
48
46
44
cm
20
19
18
17
16
15
14
13
in
20
19
18
in
H
E
A
D
C
I
R
C
U
M
F
E
R
E
N
C
E
34
17
H
E
A
D
C
I
R
C
U
M
F
E
R
E
N
C
E
95
90
50
25
10
5
75
30
AGE (MONTHS)
42
95
90
50
25
10
75
5
W
E
I
G
H
T
W
E
I
G
H
T
14
20
18
14
16
12
10
8
6
4
2
9
8
7
2
9
8
7
22
20
18
14
16
24
26
28
30
32
34
36
38
40
42
44
in
cm
kg
lb
1
3
12
13
14
15
16
17
W
E
I
G
H
T
12
10
11
46
48
50
22
24
18
19
20
21
22
10
11
6
5
4
kg
in
cm
LENGTH
lb
6
5
Date
Age
Weight
Length
Head Circ.
Comment
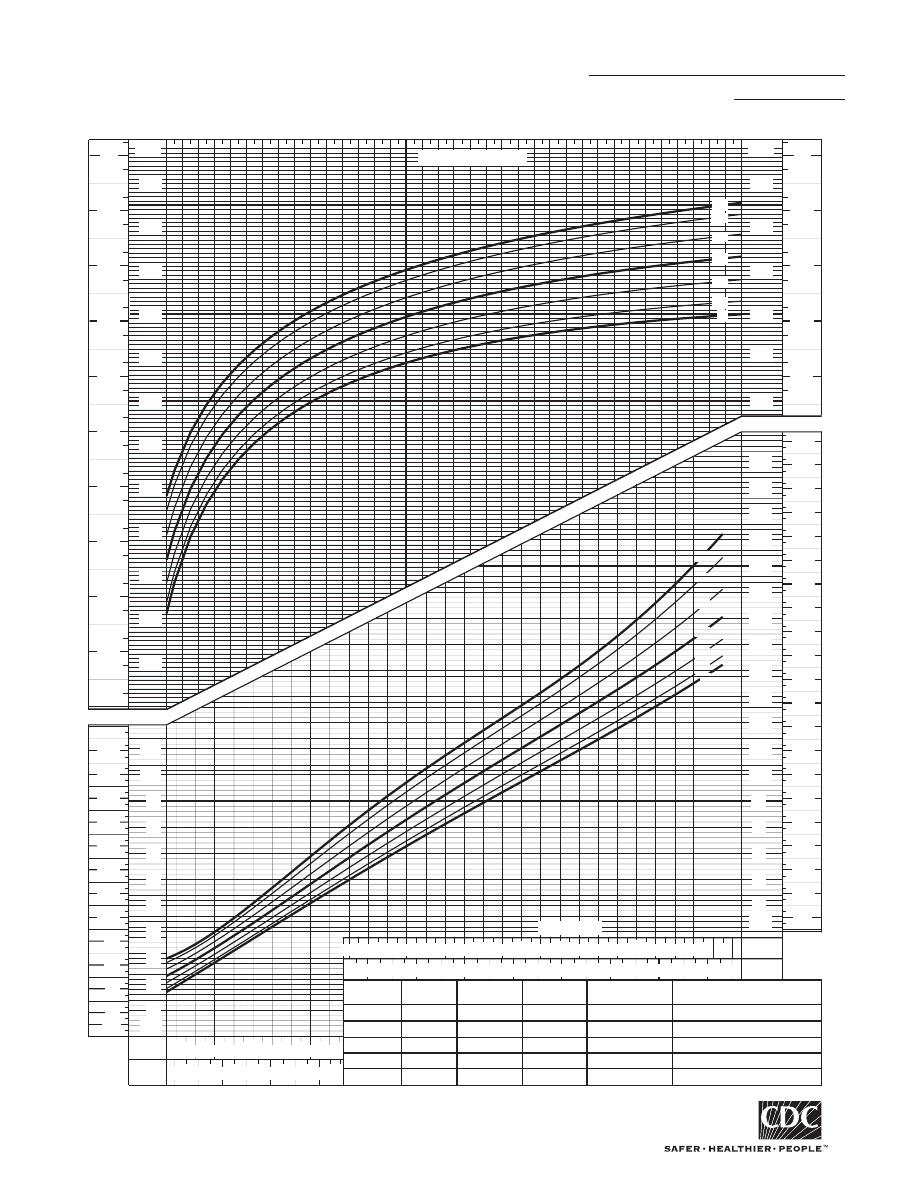
SOURCE: Developed b
(2000).
y the National Center for Health Statistics in collaboration with
the National Center for Chronic Disease Prevention and Health Promotion
http://www.cdc.gov/growthcharts
46 48 50 52 54 56 58 60 62
64 66 68 70 72 74 76 78 80 82 84 86 88 90 92
90
94 96 98100
41
40
39
38
37
35 36
34
33
32
31
30
29
28
27
26
24
23
22
21
20
19
18
Birth to 36 months: Girls
Head circumference-for-age and
Weight-for-length percentiles
NAME
RECORD #
Published May 30, 2000 (modified 10/16/00).
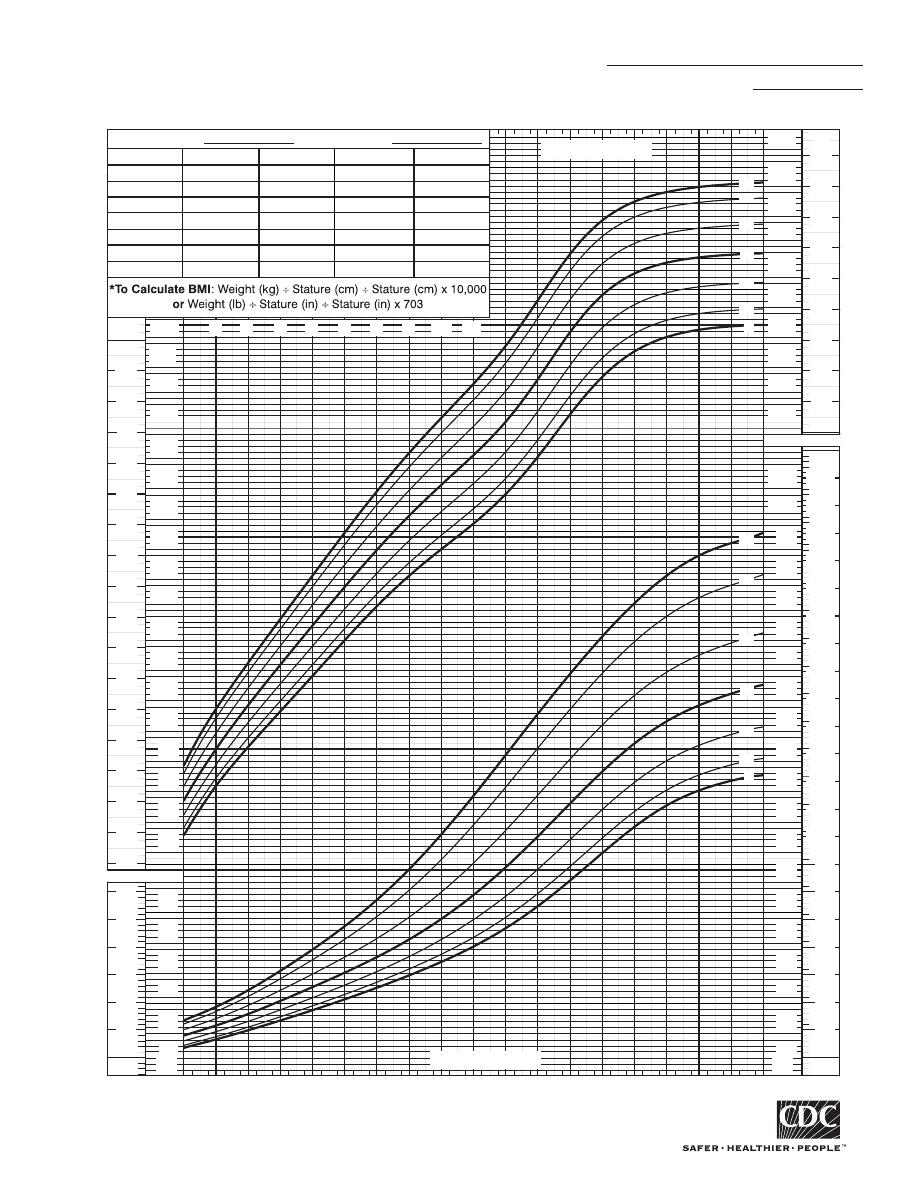
2 to 20 years: Boys
Stature
Weight-for-age percentiles
-for-age and
NAME
RECORD #
SOURCE: Developed b
(2000).
y the National Center for Health Statistics in collaboration with
the National Center for Chronic Disease Prevention and Health Promotion
http://www.cdc.gov/growthcharts
Published May 30, 2000 (modified 11/21/00)..
W
E
I
G
H
T
W
E
I
G
H
T
S
T
A
T
U
R
E
2
3
4
5
6
7
8
9
10 11 12 13 14 15 16 17 18 19 20
S
T
A
T
U
R
E
74
76
72
70
68
66
64
62
60
in
lb
30
40
50
60
70
80
90
100
110
120
130
140
150
160
170
180
190
200
210
220
230
62
42
44
46
48
60
58
52
54
56
in
30
32
34
36
38
40
lb
30
40
50
60
70
80
kg
10
15
20
25
30
35
80
85
90
95
100
105
110
115
120
125
130
135
140
150
155
cm
150
155
160
165
170
175
180
185
190
kg
10
15
20
25
30
35
105
45
50
55
60
65
70
75
80
85
90
95
100
12 13 14 15 16 17 18 19 20
AGE (YEARS)
AGE (YEARS)
40
95
90
75
50
25
10
5
95
90
75
50
25
10
5
160
cm
11
3
4
5
6
7
8
9
10
145
Date
Mother’s Stature
Father’s Stature
Age
Weight
Stature
BMI*
50

SOURCE: Developed b
(2000).
y the National Center for Health Statistics in collaboration with
the National Center for Chronic Disease Prevention and Health Promotion
http://www.cdc.gov/growthcharts
2 to 20 years: Girls
Stature
Weight-for-age percentiles
-for-age and
NAME
RECORD #
Published May 30, 2000 (modified 11/21/00).
W
E
I
G
H
T
W
E
I
G
H
T
cm
150
155
160
165
170
175
180
185
190
lb
30
40
50
60
70
80
90
100
110
120
130
140
150
160
170
180
190
200
210
220
230
kg
10
15
20
25
30
35
105
45
50
55
60
65
70
75
80
85
90
95
100
20
20
S
T
A
T
U
R
E
40
lb
30
40
50
60
70
80
S
T
A
T
U
R
E
62
42
44
46
48
60
58
52
54
56
in
30
32
34
36
38
40
50
74
76
72
70
68
66
64
62
60
in
kg
10
15
20
25
30
35
80
85
90
95
100
105
110
115
120
125
130
135
140
145
150
155
2
3
4
5
6
7
8
9
10 11 12 13 14 15 16 17 18 19
12 13 14 15 16 17 18 19
AGE (YEARS)
AGE (YEARS)
160
cm
11
3
4
5
6
7
8
9
10
95
90
75
50
25
10
5
95
90
75
50
25
10
5
Date
Mother’s Stature
Father’s Stature
Age
Weight
Stature
BMI*
2
5
4
3
6
7
8
9
10
11
12
13
14
15
16
17
18
19
20
26
24
22
20
18
16
14
12
kg/m
2
28
26
24
22
20
18
16
14
12
kg/m
2
30
32
34
BMI
BMI
AGE (YEARS)
13
15
17
19
21
23
25
27
13
15
17
19
21
23
25
27
29
31
33
35
95
90
75
50
25
10
5
85
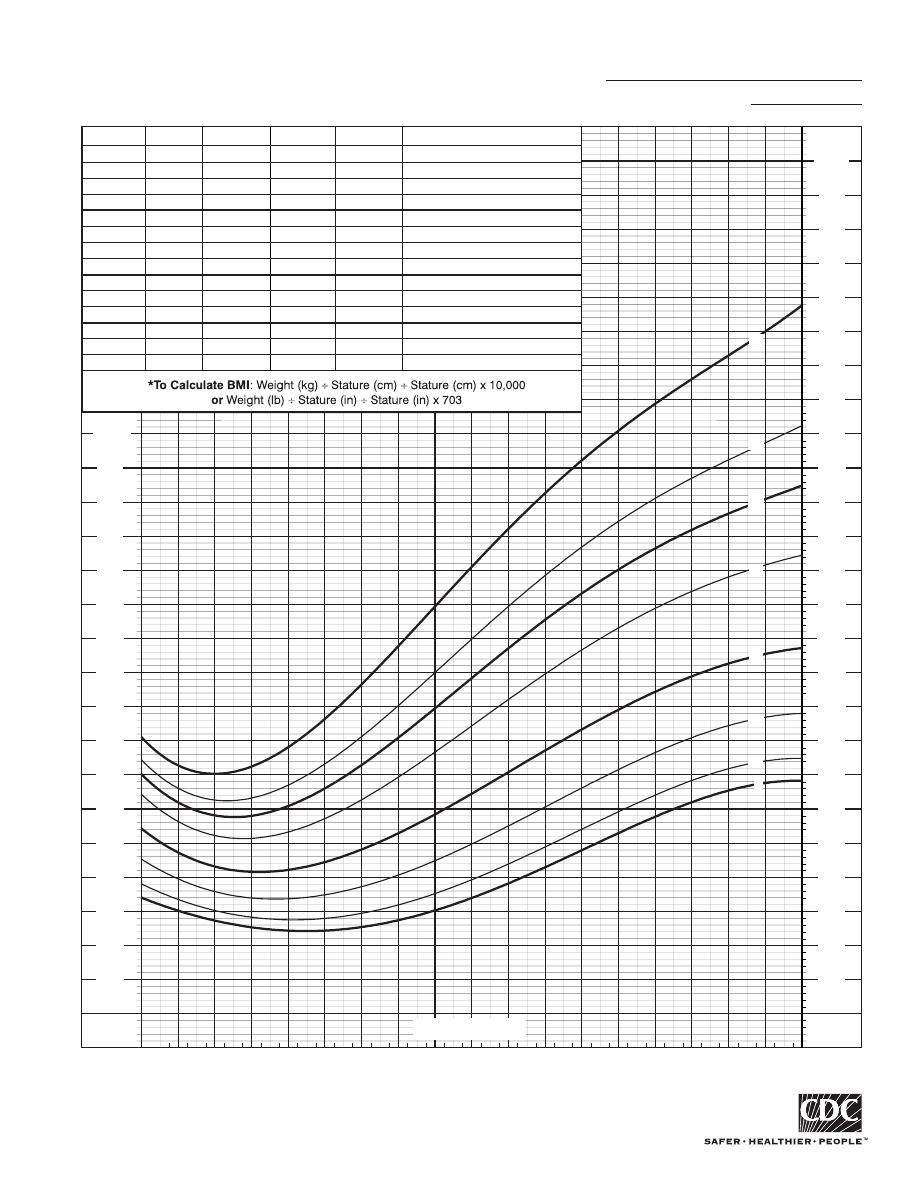
2 to 20 years: Boys
Body mass index-for-age percentiles
NAME
RECORD #
SOURCE: Developed b
(2000).
y the National Center for Health Statistics in collaboration with
the National Center for Chronic Disease Prevention and Health Promotion
http://www.cdc.gov/growthcharts
Date
Age
Weight
Stature
BMI*
Comments
Published May 30, 2000 (modified 10/16/00).
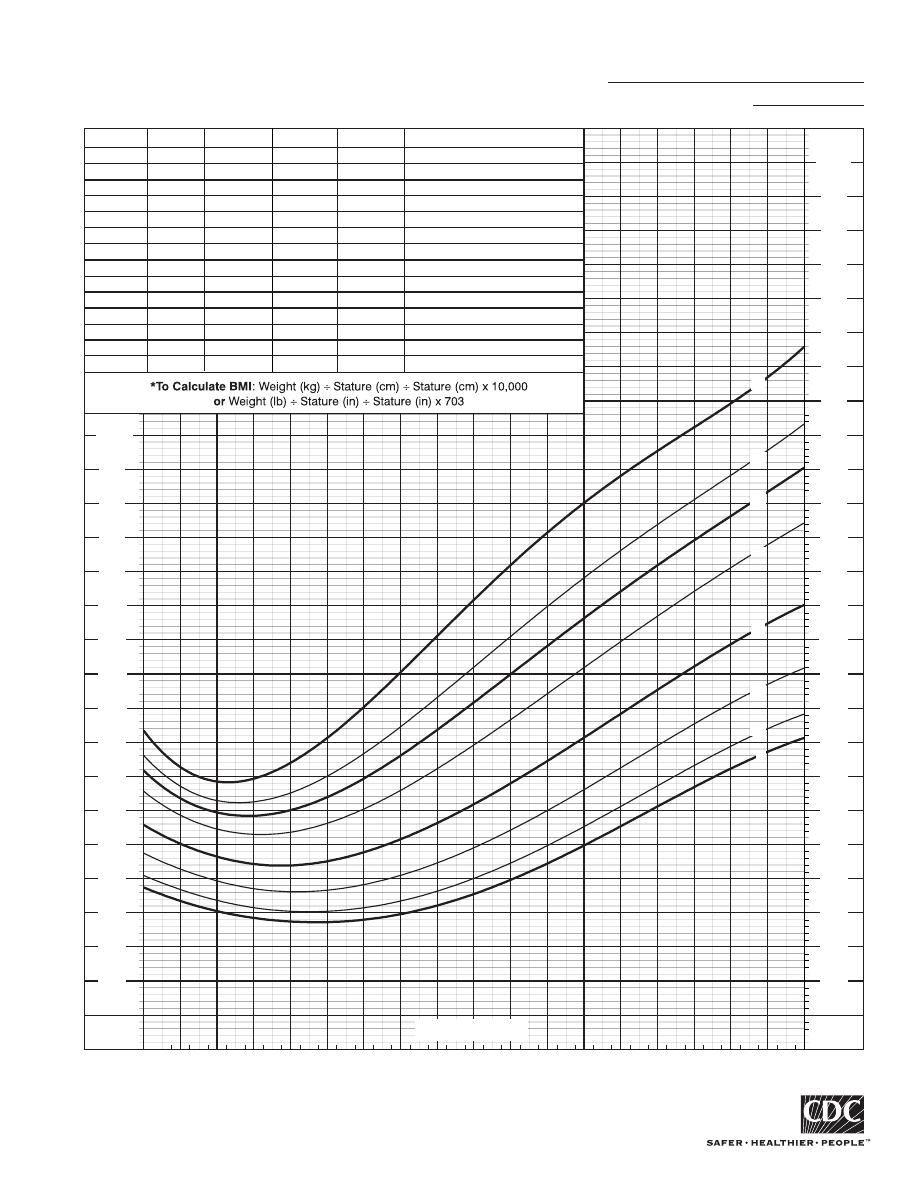
2 to 20 years: Girls
Body mass index-for-age percentiles
NAME
RECORD #
SOURCE: Developed b
(2000).
y the National Center for Health Statistics in collaboration with
the National Center for Chronic Disease Prevention and Health Promotion
http://www.cdc.gov/growthcharts
2
5
4
3
6
7
8
9
10
11
12
13
14
15
16
17
18
19
20
26
24
22
20
18
16
14
12
kg/m
2
28
26
24
22
20
18
16
14
12
kg/m
2
30
32
34
BMI
BMI
AGE (YEARS)
13
15
17
19
21
23
25
27
13
15
17
19
21
23
25
27
29
31
33
35
Date
Age
Weight
Stature
BMI*
Comments
95
90
85
75
50
10
25
5
Published May 30, 2000 (modified 10/16/00).
56
52
48
44
40
36
32
28
24
20
lb
lb
56
52
48
44
40
36
32
28
24
20
60
in
cm
31
32
33
34
35
36
37
38
39
40
41
42
43
44
45
46
47
kg
kg
19
18
17
16
15
14
13
12
11
10
9
8
27
26
25
24
23
22
21
20
26
25
24
23
22
21
20
19
18
17
16
15
14
13
12
11
10
9
8
28
29
30
31
32
33
34
64
68
72
76
kg
lb
kg
kg
lb
lb
80
85
90
95
100
105
110
115
120
Date
Age
Weight
Stature
Comments
95
50
25
75
90
95
5
10
85
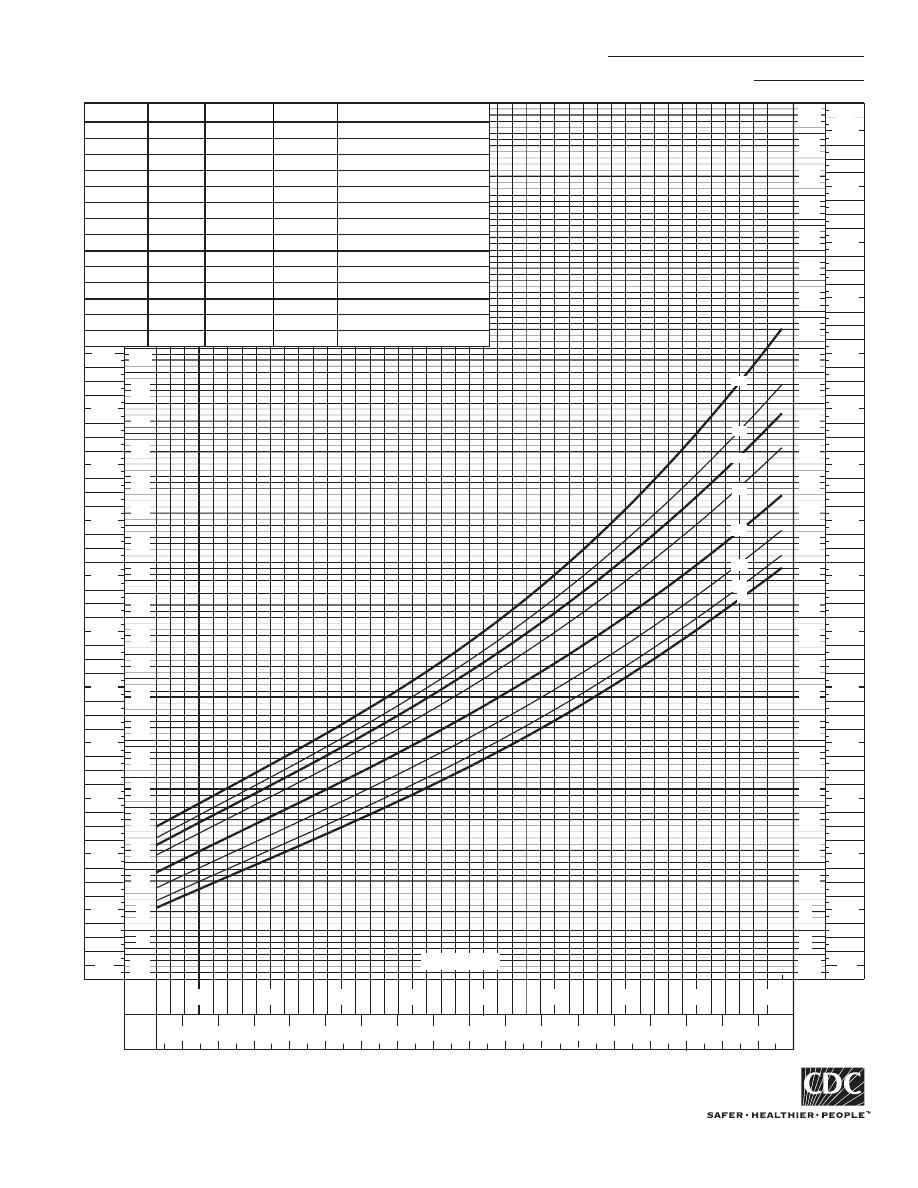
STATURE
Weight-for-stature percentiles: Boys
NAME
RECORD #
SOURCE: Developed b
(2000).
y the National Center for Health Statistics in collaboration with
the National Center for Chronic Disease Prevention and Health Promotion
http://www.cdc.gov/growthcharts
Published May 30, 2000 (modified 10/16/00).
56
52
48
44
40
36
32
28
24
20
lb
lb
56
52
48
44
40
36
32
28
24
20
60
in
cm
31
32
33
34
35
36
37
38
39
40
41
42
43
44
45
46
47
kg
kg
19
18
17
16
15
14
13
12
11
10
9
8
27
26
25
24
23
22
21
20
26
25
24
23
22
21
20
19
18
17
16
15
14
13
12
11
10
9
8
28
29
30
31
32
33
34
64
68
72
76
kg
lb
kg
kg
lb
lb
80
85
90
95
100
105
110
115
120
Date
Age
Weight
Stature
Comments
50
25
75
90
95
5
10
85
STATURE
Weight-for-stature percentiles: Girls
NAME
RECORD #
SOURCE: Developed b
(2000).
y the National Center for Health Statistics in collaboration with
the National Center for Chronic Disease Prevention and Health Promotion
http://www.cdc.gov/growthcharts
Published May 30, 2000 (modified 10/16/00).